Doniphan, MO - homes for sale
2 of 2 results displayed
- New
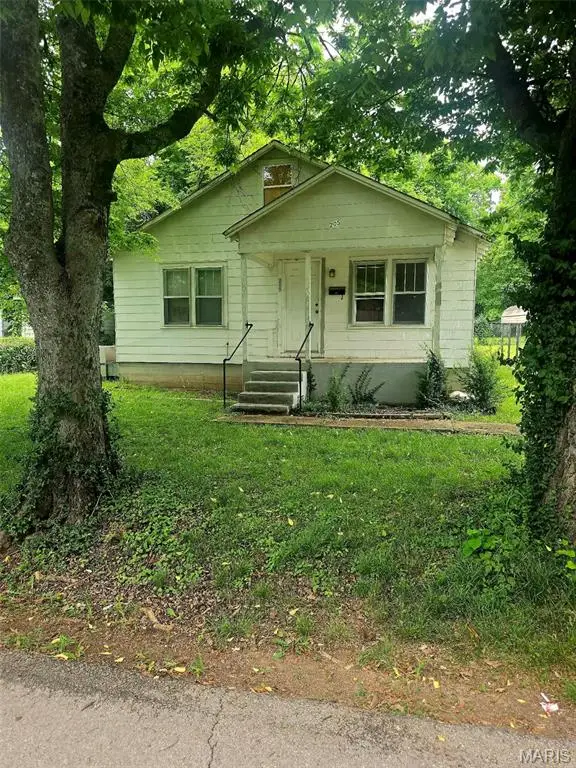 $69,900Active1 beds 2 baths2,742 sq. ft.
205 Morgan, Doniphan, MO 63935
MLS# 26041486Listed by: COLLIN H MURRAY & ASSOCIATES REALTY LLC 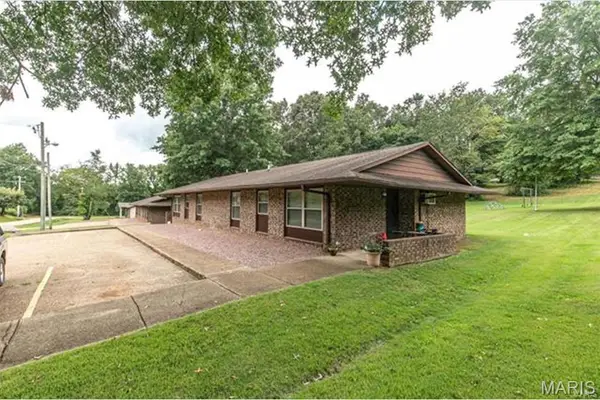 $1,700,000Active24 beds 24 baths17,028 sq. ft.
1020 E Washington, Doniphan, MO 63935
MLS# 26024251Listed by: COLLINS & ASSOCIATES
Local realty services provided by:CENTURY 21 Broughton Team
Copyright 2026 Mid-America Regional Information Systems. All rights reserved. Listings courtesy of Mid-America Regional Information Systems as distributed by MLS GRID <Last Updated June 30, 2026. Mid-America Regional Information Systems provides content displayed here (“provided content”) on an “as is” basis and makes no representations or warranties regarding the provided content, including, but not limited to those of non-infringement, timeliness, accuracy, or completeness. Individuals and companies using information presented are responsible for verification and validation of information they utilize and present to their customers and clients. Mid-America Regional Information Systems will not be liable for any damage or loss resulting from use of the provided content or the products available through Portals, IDX, VOW, and/or Syndication. Recipients of this information shall not resell, redistribute, reproduce, modify, or otherwise copy any portion thereof without the expressed written consent of Mid-America Regional Information Systems.
Neighborhoods near Doniphan, MO
Zip codes near Doniphan, MO
- 63901 homes for sale
- 63935 homes for sale
- 63937 homes for sale
- 63939 homes for sale
- 63941 homes for sale
- 63942 homes for sale
- 63943 homes for sale
- 63945 homes for sale
- 63953 homes for sale
- 63954 homes for sale
- 63965 homes for sale
- 63967 homes for sale
- 65778 homes for sale
- 72413 homes for sale
- 72422 homes for sale
- 72444 homes for sale
- 72455 homes for sale
- 72456 homes for sale
- 72460 homes for sale
- 72470 homes for sale
Popular searches near Doniphan, MO
- Beaver Dam homes for sale
- Brown-Carpenter homes for sale
- Current River homes for sale
- Doniphan Township homes for sale
- Fairdealing homes for sale
- Flatwoods homes for sale
- Gatewood homes for sale
- Grandin homes for sale
- Harris homes for sale
- Johnson homes for sale
- Johnson homes for sale
- Jordan homes for sale
- Maynard homes for sale
- Naylor homes for sale
- Neely homes for sale
- Richardson homes for sale
- Siloam homes for sale
- Success homes for sale
- Washington homes for sale
- West Doniphan homes for sale
Protect your home and budget from life's surprises with an Assurant Home Warranty, backed by a partner that supports you through every step of homeownership. Explore Plans.
©2026 Century 21 Real Estate LLC. All rights reserved. CENTURY 21®, the CENTURY 21 Logo and C21® are service marks owned by Century 21 Real Estate LLC. Century 21 Real Estate LLC fully supports the principles of the Fair Housing Act and the Equal Opportunity Act. Each office is independently owned and operated. Listing information is deemed reliable but not guaranteed accurate.