- Ashland, San Leandro homes for sale
- Burbank, Hayward homes for sale
- Castro Valley, Castro Valley homes for sale
- Cherryland, Hayward homes for sale
- Fairview, Hayward homes for sale
- Floresta Gardens, San Leandro homes for sale
- Glen Eden, Hayward homes for sale
- Harder-Tennyson, Hayward homes for sale
- Hayward Highland, Hayward homes for sale
- Hayward North, Hayward homes for sale
- Jackson Triangle, Hayward homes for sale
- Longwood - Winton Grove, Hayward homes for sale
- Mission Foothills, Hayward homes for sale
- Mission - Garin, Hayward homes for sale
- Mt. Eden, Hayward homes for sale
- San Lorenzo, San Lorenzo homes for sale
- Santa Clara, Hayward homes for sale
- South Gate, Hayward homes for sale
- Tennyson - Alquire, Hayward homes for sale
- Upper B Street, Hayward homes for sale
Downtown Hayward, Hayward, CA - homes for sale
6 of 6 results displayed
 $799,000Active-- beds -- baths
22622 2nd Street, Hayward, CA 94541
MLS# 41125555Listed by: PARAMOUNT BUILDINGS & LOANS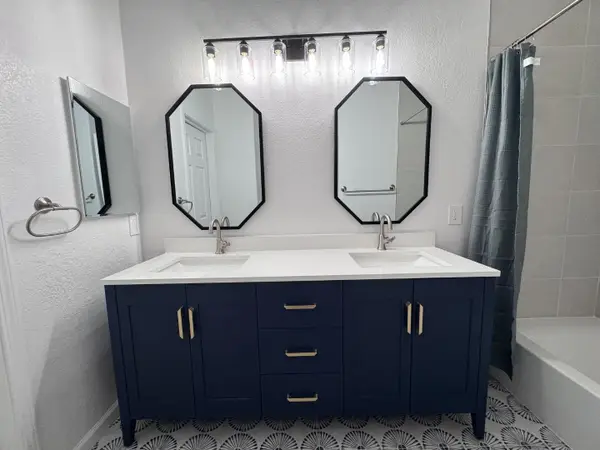 $749,000Pending3 beds 3 baths1,361 sq. ft.
710 City Walk Place #3, Hayward, CA 94541
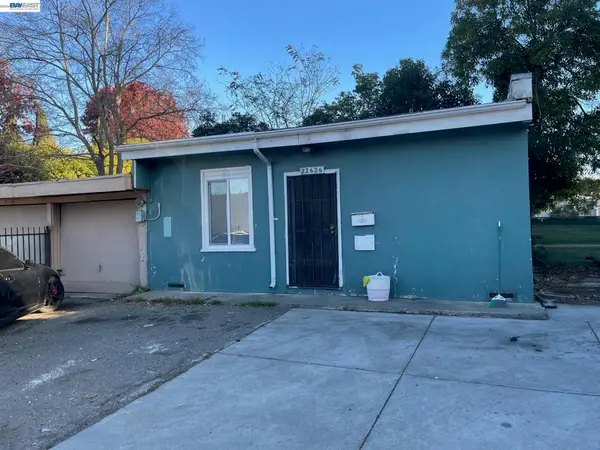
MLS# ML82035663Listed by: LUXMORE REAL ESTATE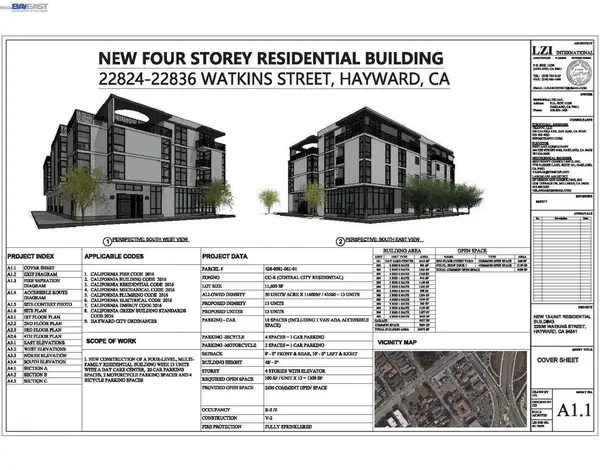 $1,200,000Active0.27 Acres
22836 Watkins St, Hayward, CA 94541
MLS# 41124614Listed by: PACIFIC LAND BROKERS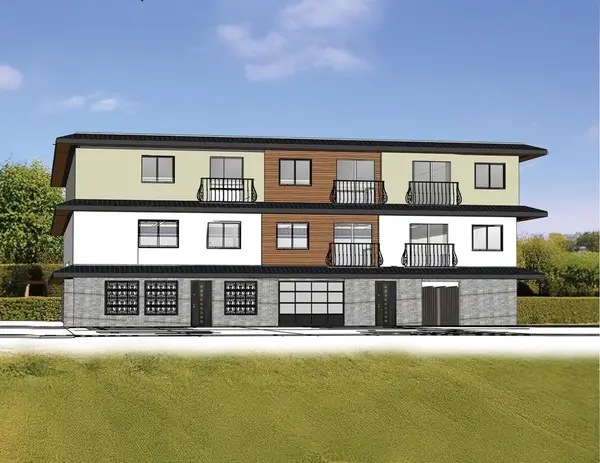 $1,150,000Active0.15 Acres
1289 Russell Way, Hayward, CA 94541
MLS# 41122143Listed by: LEGACY REAL ESTATE & ASSOC.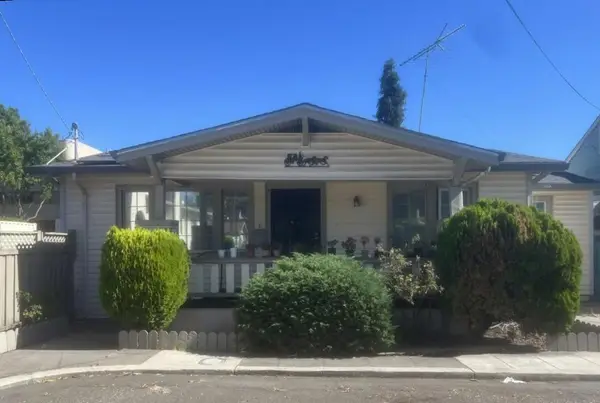
 $588,000Active2 beds 1 baths768 sq. ft.
1225 Richard Place, Hayward, CA 94541
MLS# ML82024124Listed by: CENTURY 21 MASTERS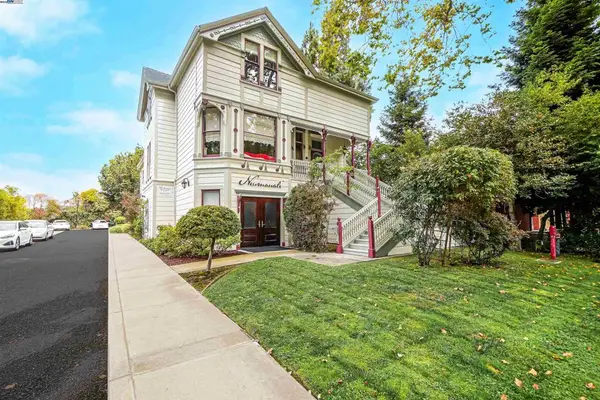 $1,399,000Active-- beds -- baths
742 B St, Hayward, CA 94541
MLS# 41114649Listed by: FOHL REALTY & INVESTMENTS
Local realty services provided by:CENTURY 21 Classic Estates, CENTURY 21 Sierra Properties
The information being provided by California Regional MLS (Southern California) is for the consumer's personal, non-commercial use and may not be used for any purpose other than to identify prospective properties consumer may be interested in purchasing. Any information relating to real estate for sale referenced on this web site comes from the Internet Data Exchange (IDX) program of the California Regional MLS (Southern California). CENTURY 21 Classic Estates is not a Multiple Listing Service (MLS), nor does it offer MLS access. This website is a service of CENTURY 21 Classic Estates, a broker participant of California Regional MLS (Southern California). This web site may reference real estate listing(s) held by a brokerage firm other than the broker and/or agent who owns this web site.
The accuracy of all information, regardless of source, including but not limited to open house information, square footages and lot sizes, is deemed reliable but not guaranteed and should be personally verified through personal inspection by and/or with the appropriate professionals. The data contained herein is copyrighted by California Regional MLS (Southern California) and is protected by all applicable copyright laws. Any unauthorized dissemination of this information is in violation of copyright laws and is strictly prohibited.
Copyright 2021 California Regional MLS (Southern California). All rights reserved.
Popular neighborhoods near Downtown Hayward, Hayward, CA
Zip codes near Downtown Hayward, Hayward, CA
- 94502 homes for sale
- 94536 homes for sale
- 94541 homes for sale
- 94542 homes for sale
- 94544 homes for sale
- 94545 homes for sale
- 94546 homes for sale
- 94552 homes for sale
- 94555 homes for sale
- 94577 homes for sale
- 94578 homes for sale
- 94579 homes for sale
- 94580 homes for sale
- 94583 homes for sale
- 94587 homes for sale
- 94588 homes for sale
- 94603 homes for sale
- 94605 homes for sale
- 94619 homes for sale
- 94621 homes for sale
Counties near Downtown Hayward, Hayward, CA
- Alameda County homes for sale
- Amador County homes for sale
- Calaveras County homes for sale
- Contra Costa County homes for sale
- Marin County homes for sale
- Merced County homes for sale
- Monterey County homes for sale
- Napa County homes for sale
- Sacramento County homes for sale
- San Benito County homes for sale
- San Francisco County homes for sale
- San Joaquin County homes for sale
- San Mateo County homes for sale
- Santa Clara County homes for sale
- Santa Cruz County homes for sale
- Solano County homes for sale
- Sonoma County homes for sale
- Stanislaus County homes for sale
- Sutter County homes for sale
- Yolo County homes for sale
Protect your home and budget from life's surprises with an Assurant Home Warranty, backed by a partner that supports you through every step of homeownership. Explore Plans.
©2026 Century 21 Real Estate LLC. All rights reserved. CENTURY 21®, the CENTURY 21 Logo and C21® are service marks owned by Century 21 Real Estate LLC. Century 21 Real Estate LLC fully supports the principles of the Fair Housing Act and the Equal Opportunity Act. Each office is independently owned and operated. Listing information is deemed reliable but not guaranteed accurate.