- 6th Avenue, Tacoma homes for sale
- Browns Point, Tacoma homes for sale
- Cascade Park, Tacoma homes for sale
- Central Tacoma, Tacoma homes for sale
- East Side, Tacoma homes for sale
- Fircrest, Tacoma homes for sale
- Hayda Park, Tacoma homes for sale
- Hillside, Tacoma homes for sale
- Hilltop, Tacoma homes for sale
- North Slope, Tacoma homes for sale
- North Tacoma, Tacoma homes for sale
- Old Town, Tacoma homes for sale
- Proctor, Tacoma homes for sale
- St Helens, Tacoma homes for sale
- South End, Tacoma homes for sale
- South Tacoma, Tacoma homes for sale
- Stadium District, Tacoma homes for sale
- Three Bridges, Tacoma homes for sale
- UPS Neighborhood, Tacoma homes for sale
- West End, Tacoma homes for sale
Downtown Tacoma, Tacoma, WA - homes for sale
2 of 2 results displayed
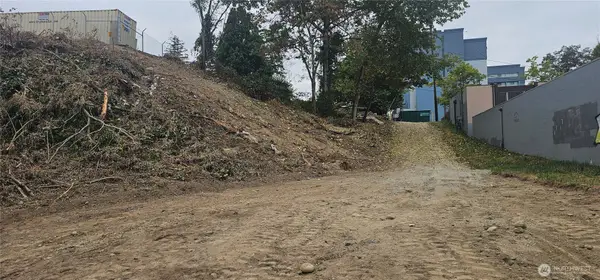 $199,000Active0.32 Acres
611 E 27th Street, Tacoma, WA 98409
MLS# 2427369Listed by: YELM WINDERMERE
 $239,000Active0.07 Acres
2505 Tacoma Avenue S #2, Tacoma, WA 98402
MLS# 2221672Listed by: GOLDHOUSE REALTY
Local realty services provided by:CENTURY 21 Real Estate Center
Listings courtesy of Northwest MLS as distributed by MLS GRID. Based on information submitted to the MLS GRID as of April 3, 2026. All data is obtained from various sources and may not have been verified by broker or MLS GRID. Supplied Open House Information is subject to change without notice. All information should be independently reviewed and verified for accuracy. Properties may or may not be listed by the office/agent presenting the information. Listing information is provided for consumers' personal, non-commercial use, solely to identify prospective properties for potential purchase; all other use is strictly prohibited and may violate relevant federal and state law. Information deemed reliable but not guaranteed. Copyright © 2026 MLS GRID. All Rights Reserved.
Popular neighborhoods near Downtown Tacoma, Tacoma, WA
Zip codes near Downtown Tacoma, Tacoma, WA
- 98023 homes for sale
- 98354 homes for sale
- 98371 homes for sale
- 98402 homes for sale
- 98403 homes for sale
- 98404 homes for sale
- 98405 homes for sale
- 98406 homes for sale
- 98407 homes for sale
- 98408 homes for sale
- 98409 homes for sale
- 98418 homes for sale
- 98422 homes for sale
- 98424 homes for sale
- 98443 homes for sale
- 98444 homes for sale
- 98465 homes for sale
- 98466 homes for sale
- 98467 homes for sale
- 98499 homes for sale
Counties near Downtown Tacoma, Tacoma, WA
- Clallam County homes for sale
- Columbia County homes for sale
- Cowlitz County homes for sale
- Grays Harbor County homes for sale
- Island County homes for sale
- Jefferson County homes for sale
- King County homes for sale
- Kitsap County homes for sale
- Kittitas County homes for sale
- Lewis County homes for sale
- Mason County homes for sale
- Pacific County homes for sale
- Pierce County homes for sale
- San Juan County homes for sale
- Skagit County homes for sale
- Skamania County homes for sale
- Snohomish County homes for sale
- Thurston County homes for sale
- Wahkiakum County homes for sale
- Yakima County homes for sale
Protect your home and budget from life's surprises with an Assurant Home Warranty, backed by a partner that supports you through every step of homeownership. Explore Plans.
©2026 Century 21 Real Estate LLC. All rights reserved. CENTURY 21®, the CENTURY 21 Logo and C21® are service marks owned by Century 21 Real Estate LLC. Century 21 Real Estate LLC fully supports the principles of the Fair Housing Act and the Equal Opportunity Act. Each office is independently owned and operated. Listing information is deemed reliable but not guaranteed accurate.