- Armory Gardens, Tampa homes for sale
- Channel District, Tampa homes for sale
- Channelside, Tampa homes for sale
- Courier City/Oscawana, Tampa homes for sale
- Davis Islands, Tampa homes for sale
- East Ybor, Tampa homes for sale
- Harbour Island, Tampa homes for sale
- Historic Hyde Park, Tampa homes for sale
- Historic Ybor, Tampa homes for sale
- Hyde Park, Tampa homes for sale
- Hyde Park North, Tampa homes for sale
- North Hyde Park, Tampa homes for sale
- Old West Tampa, Tampa homes for sale
- Ridgewood Park, Tampa homes for sale
- Riverside Heights, Tampa homes for sale
- South Nebraska, Tampa homes for sale
- Tampa Heights, Tampa homes for sale
- VM Ybor, Tampa homes for sale
- West Riverfront, Tampa homes for sale
- Ybor Heights, Tampa homes for sale
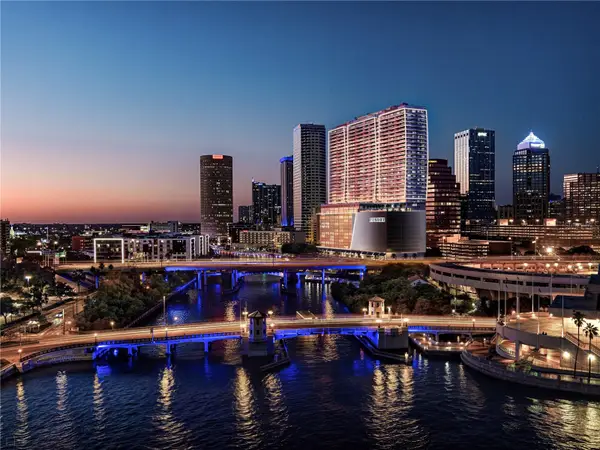
Downtown Tampa, Tampa, FL - homes for sale
34 of 34 results displayed
- New
 $2,285,000Active2 beds 3 baths2,259 sq. ft.
111 S Ashley Drive #2809, TAMPA, FL 33602
MLS# TB8489358Listed by: SMITH & ASSOCIATES REAL ESTATE  $3,450,000Active3 beds 4 baths2,953 sq. ft.
111 S Ashley Drive #1608, TAMPA, FL 33602
MLS# TB8486082Listed by: SMITH & ASSOCIATES REAL ESTATE $2,107,000Active2 beds 3 baths1,697 sq. ft.
111 S Ashley Drive #3107, TAMPA, FL 33602
MLS# TB8486088Listed by: SMITH & ASSOCIATES REAL ESTATE- Open Sat, 2 to 4pm
 $2,465,694Active2 beds 3 baths1,902 sq. ft.
1101 E Jackson Street #3808, TAMPA, FL 33602
MLS# TB8481454Listed by: FRANK ALBERT REALTY 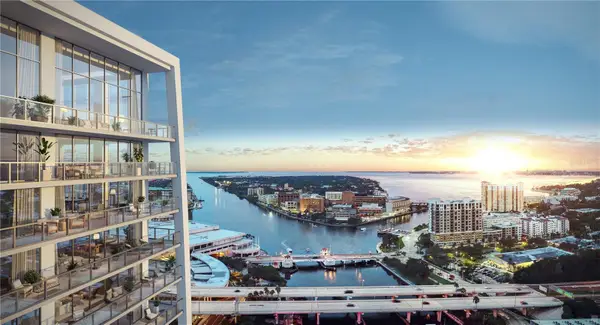 $5,500,000Active3 beds 4 baths3,218 sq. ft.
111 S Ashley Drive #1501, TAMPA, FL 33602
MLS# TB8469770Listed by: SMITH & ASSOCIATES REAL ESTATE $2,930,000Active2 beds 3 baths2,222 sq. ft.
111 S Ashley Drive #3606, TAMPA, FL 33602
MLS# TB8469649Listed by: SMITH & ASSOCIATES REAL ESTATE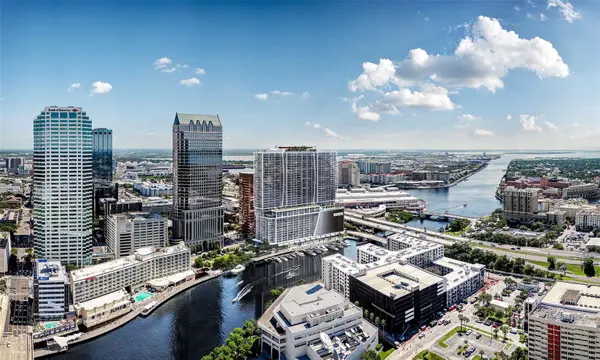 $4,500,000Active3 beds 4 baths3,216 sq. ft.
111 S Ashley Drive #2702, TAMPA, FL 33602
MLS# TB8469653Listed by: SMITH & ASSOCIATES REAL ESTATE $1,875,000Active1 beds 2 baths1,378 sq. ft.
111 S Ashley Drive #3303, TAMPA, FL 33602
MLS# TB8469631Listed by: SMITH & ASSOCIATES REAL ESTATE $1,222,750Active2 beds 2 baths878 sq. ft.
1101 E Jackson Street #2415, TAMPA, FL 33602
MLS# TB8379001Listed by: COMPASS FLORIDA LLC $1,999,000Active2 beds 3 baths2,215 sq. ft.
520 N Tampa St #3103, TAMPA, FL 33602
MLS# TB8455580Listed by: SMITH & ASSOCIATES REAL ESTATE $4,999,000Active3 beds 5 baths3,715 sq. ft.
520 N Tampa St #4003, TAMPA, FL 33602
MLS# TB8455556Listed by: SMITH & ASSOCIATES REAL ESTATE $1,229,000Active2 beds 3 baths1,608 sq. ft.
520 N Tampa St #2304, TAMPA, FL 33602
MLS# TB8455542Listed by: SMITH & ASSOCIATES REAL ESTATE $2,619,000Active3 beds 4 baths2,472 sq. ft.
520 N Tampa St #3701, TAMPA, FL 33602
MLS# TB8455546Listed by: SMITH & ASSOCIATES REAL ESTATE $1,959,000Active2 beds 3 baths2,150 sq. ft.
520 N Tampa St #1906, TAMPA, FL 33602
MLS# TB8455528Listed by: SMITH & ASSOCIATES REAL ESTATE $1,144,690Active-- beds 1 baths684 sq. ft.
1101 E Jackson Street #2621, TAMPA, FL 33602
MLS# TB8376314Listed by: COMPASS FLORIDA LLC $948,306Active-- beds 1 baths578 sq. ft.
1101 E Jackson Street #3206, TAMPA, FL 33602
MLS# TB8342990Listed by: ARC REALTY GROUP $1,402,764Active2 beds 2 baths1,045 sq. ft.
1101 E Jackson Street #3019, TAMPA, FL 33602
MLS# TB8378086Listed by: SMITH & ASSOCIATES REAL ESTATE $875,446Active-- beds 1 baths507 sq. ft.
1101 E Jackson Street #3102, TAMPA, FL 33602
MLS# TB8374871Listed by: HOMESCENE REALTY $2,272,925Active2 beds 3 baths1,566 sq. ft.
1101 E Jackson Street #3804, TAMPA, FL 33602
MLS# TB8342629Listed by: ARC REALTY GROUP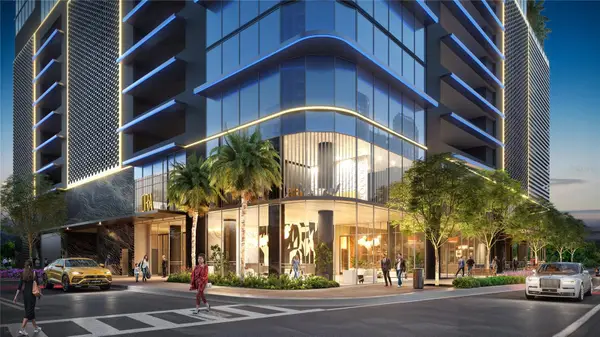 $3,939,012Active3 beds 4 baths2,742 sq. ft.
1101 E Jackson Street #3806, TAMPA, FL 33602
MLS# TB8342640Listed by: ARC REALTY GROUP $2,103,140Active2 beds 2 baths1,414 sq. ft.
1101 E Jackson Street #3607, TAMPA, FL 33602
MLS# TB8342720Listed by: ARC REALTY GROUP $4,212,863Active4 beds 5 baths3,070 sq. ft.
1101 E Jackson Street #3705, TAMPA, FL 33602
MLS# TB8376224Listed by: HOMESCENE REALTY $961,436Active-- beds 1 baths558 sq. ft.
1101 E Jackson Street #3304, TAMPA, FL 33602
MLS# TB8342969Listed by: ARC REALTY GROUP $1,254,824Active2 beds 2 baths955 sq. ft.
1101 E Jackson Street #2205, TAMPA, FL 33602
MLS# TB8342980Listed by: ARC REALTY GROUP $909,563Active-- beds 1 baths572 sq. ft.
1101 E Jackson Street #2016, TAMPA, FL 33602
MLS# TB8342999Listed by: ARC REALTY GROUP $1,195,300Active1 beds 1 baths772 sq. ft.
1101 E Jackson Street #2108, TAMPA, FL 33602
MLS# TB8343002Listed by: ARC REALTY GROUP $1,456,109Active2 beds 2 baths1,048 sq. ft.
1101 E Jackson Street #2010, TAMPA, FL 33602
MLS# TB8343008Listed by: ARC REALTY GROUP $1,144,690Active-- beds 1 baths684 sq. ft.
1101 E Jackson Street #2621, TAMPA, FL 33602
MLS# TB8343107Listed by: ARC REALTY GROUP $870,616Active-- beds 1 baths507 sq. ft.
1101 E Jackson Street #3002, TAMPA, FL 33602
MLS# TB8384606Listed by: CORCORAN DWELLINGS $2,595,000Active2 beds 3 baths1,930 sq. ft.
111 S Ashley Drive #2705, TAMPA, FL 33602
MLS# TB8469643Listed by: SMITH & ASSOCIATES REAL ESTATE $870,616Active-- beds 1 baths507 sq. ft.
1101 E Jackson Street #2302, TAMPA, FL 33602
MLS# TB8386512Listed by: EXP REALTY LLC $5,399,000Active3 beds 5 baths3,785 sq. ft.
520 N Tampa St #4201, TAMPA, FL 33602
MLS# TB8455567Listed by: SMITH & ASSOCIATES REAL ESTATE $1,231,857Active2 beds 2 baths1,048 sq. ft.
1101 E Jackson Street, TAMPA, FL 33602
MLS# TB8371862Listed by: BHHS FLORIDA PROPERTIES GROUP $3,125,000Active2 beds 3 baths2,218 sq. ft.
111 S Ashley Drive #2504, TAMPA, FL 33602
MLS# TB8431574Listed by: SMITH & ASSOCIATES REAL ESTATE
Local realty services provided by:CENTURY 21 Selling Paradise
The information being provided by Stellar Mls is for the consumer's personal, non-commercial use and may not be used for any purpose other than to identify prospective properties consumer may be interested in purchasing. Any information relating to real estate for sale referenced on this web site comes from the Internet Data Exchange (IDX) program of the Stellar Mls. CENTURY 21 Selling Paradise is not a Multiple Listing Service (MLS), nor does it offer MLS access. This website is a service of CENTURY 21 Selling Paradise, a broker participant of Stellar Mls. This web site may reference real estate listing(s) held by a brokerage firm other than the broker and/or agent who owns this web site.
The accuracy of all information, regardless of source, including but not limited to open house information, square footages and lot sizes, is deemed reliable but not guaranteed and should be personally verified through personal inspection by and/or with the appropriate professionals. The data contained herein is copyrighted by Stellar Mls and is protected by all applicable copyright laws. Any unauthorized dissemination of this information is in violation of copyright laws and is strictly prohibited.
Properties in listings may have been sold or may no longer be available.
Copyright 2026 Stellar Mls. All rights reserved.
Popular neighborhoods near Downtown Tampa, Tampa, FL
Zip codes near Downtown Tampa, Tampa, FL
- 33510 homes for sale
- 33602 homes for sale
- 33603 homes for sale
- 33604 homes for sale
- 33605 homes for sale
- 33606 homes for sale
- 33607 homes for sale
- 33609 homes for sale
- 33610 homes for sale
- 33611 homes for sale
- 33612 homes for sale
- 33614 homes for sale
- 33615 homes for sale
- 33616 homes for sale
- 33617 homes for sale
- 33618 homes for sale
- 33619 homes for sale
- 33629 homes for sale
- 33634 homes for sale
- 33637 homes for sale
Counties near Downtown Tampa, Tampa, FL
- Charlotte County homes for sale
- Citrus County homes for sale
- DeSoto County homes for sale
- Hardee County homes for sale
- Hernando County homes for sale
- Highlands County homes for sale
- Hillsborough County homes for sale
- Lake County homes for sale
- Levy County homes for sale
- Manatee County homes for sale
- Marion County homes for sale
- Orange County homes for sale
- Osceola County homes for sale
- Pasco County homes for sale
- Pinellas County homes for sale
- Polk County homes for sale
- Sarasota County homes for sale
- Seminole County homes for sale
- Sumter County homes for sale
Protect your home and budget from life's surprises with an Assurant Home Warranty, backed by a partner that supports you through every step of homeownership. Explore Plans.
©2026 Century 21 Real Estate LLC. All rights reserved. CENTURY 21®, the CENTURY 21 Logo and C21® are service marks owned by Century 21 Real Estate LLC. Century 21 Real Estate LLC fully supports the principles of the Fair Housing Act and the Equal Opportunity Act. Each office is independently owned and operated. Listing information is deemed reliable but not guaranteed accurate.