- Airpark, Oklahoma City homes for sale
- Arts District, Oklahoma City homes for sale
- Campbell Acres, Oklahoma City homes for sale
- Capitol Hill, Oklahoma City homes for sale
- Core to Shore District, Oklahoma City homes for sale
- Deep Deuce, Oklahoma City homes for sale
- Downtown, Oklahoma City homes for sale
- Hathaway Heights, Oklahoma City homes for sale
- Heronville, Oklahoma City homes for sale
- Highlander Community South, Oklahoma City homes for sale
- Jackson, Oklahoma City homes for sale
- Oklahoma National Stockyards, Oklahoma City homes for sale
- Pasadena Heights, Oklahoma City homes for sale
- Rancho Village, Oklahoma City homes for sale
- Shidler-Wheeler, Oklahoma City homes for sale
- Shields-Davis, Oklahoma City homes for sale
- Shields South, Oklahoma City homes for sale
- South Walker, Oklahoma City homes for sale
- Southern Hills, Oklahoma City homes for sale
- Southern Oaks, Oklahoma City homes for sale
Draper Park, Oklahoma City, OK - homes for sale
4 of 4 results displayed
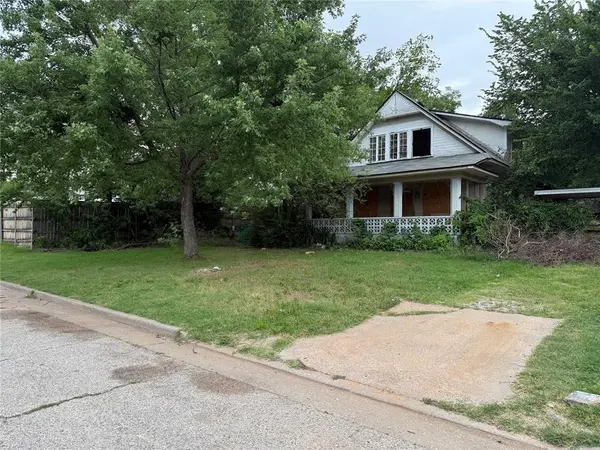 $97,000Active3 beds 2 baths1,704 sq. ft.
417 SW 40th Street, Oklahoma City, OK 73109
MLS# 1213797Listed by: KEEP REALTY, LLC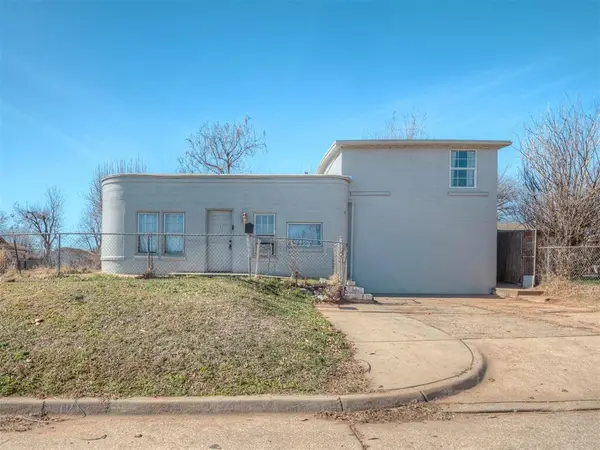 $125,000Active3 beds 1 baths1,411 sq. ft.
101 SW 41st Street, Oklahoma City, OK 73109
MLS# 1213330Listed by: METRO FIRST REALTY GROUP $12,000Active0.08 Acres
325 SW 40th Street, Oklahoma City, OK 73109
MLS# 1176023Listed by: PROVIDENCE REALTY $21,000Pending0.16 Acres
8 SW 41st Street, Oklahoma City, OK 73109
MLS# 1174725Listed by: PROVIDENCE REALTY
Local realty services provided by:CENTURY 21 Judge Fite Company
Popular neighborhoods near Draper Park, Oklahoma City, OK
Zip codes near Draper Park, Oklahoma City, OK
- 73102 homes for sale
- 73103 homes for sale
- 73104 homes for sale
- 73105 homes for sale
- 73106 homes for sale
- 73107 homes for sale
- 73108 homes for sale
- 73109 homes for sale
- 73111 homes for sale
- 73115 homes for sale
- 73117 homes for sale
- 73118 homes for sale
- 73119 homes for sale
- 73129 homes for sale
- 73135 homes for sale
- 73139 homes for sale
- 73149 homes for sale
- 73159 homes for sale
- 73160 homes for sale
- 73170 homes for sale
Counties near Draper Park, Oklahoma City, OK
- Blaine County homes for sale
- Caddo County homes for sale
- Canadian County homes for sale
- Cleveland County homes for sale
- Garfield County homes for sale
- Garvin County homes for sale
- Grady County homes for sale
- Kingfisher County homes for sale
- Lincoln County homes for sale
- Logan County homes for sale
- McClain County homes for sale
- Murray County homes for sale
- Noble County homes for sale
- Okfuskee County homes for sale
- Oklahoma County homes for sale
- Payne County homes for sale
- Pontotoc County homes for sale
- Pottawatomie County homes for sale
- Seminole County homes for sale
- Stephens County homes for sale
Protect your home and budget from life's surprises with an Assurant Home Warranty, backed by a partner that supports you through every step of homeownership. Explore Plans.
©2026 Century 21 Real Estate LLC. All rights reserved. CENTURY 21®, the CENTURY 21 Logo and C21® are service marks owned by Century 21 Real Estate LLC. Century 21 Real Estate LLC fully supports the principles of the Fair Housing Act and the Equal Opportunity Act. Each office is independently owned and operated. Listing information is deemed reliable but not guaranteed accurate.