- Basile homes for sale
- Dequincy homes for sale
- Dequincy homes for sale
- Deridder homes for sale
- Dry Creek homes for sale
- Elton homes for sale
- Gillis homes for sale
- Iowa homes for sale
- Iowa homes for sale
- Kinder homes for sale
- Longville homes for sale
- Moss Bluff homes for sale
- Oakdale homes for sale
- Oberlin homes for sale
- Pitkin homes for sale
- Ragley homes for sale
- Reeves homes for sale
- Rosepine homes for sale
- Singer homes for sale
- Sugartown homes for sale
70637, LA - homes for sale
9 of 9 results displayed
- New
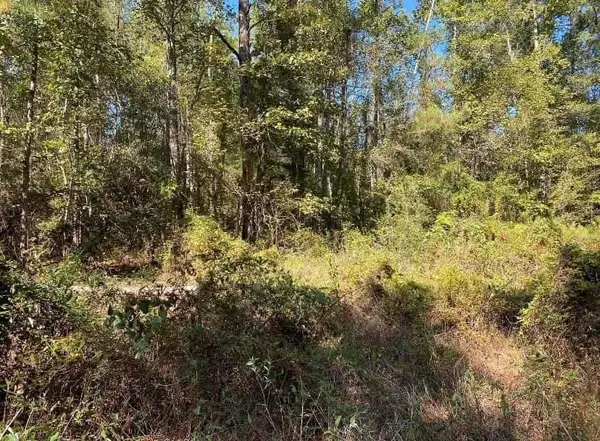 $280,000Active35 Acres
Longville Rd, Dry Creek, LA 70637
MLS# 57-146Listed by: DIAMOND REAL ESTATE - New
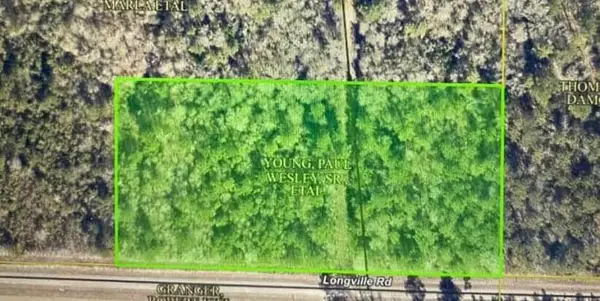 $45,000Active5 Acres
Longville Rd, Dry Creek, LA 70637
MLS# 57-147Listed by: DIAMOND REAL ESTATE - New
 $92,000Active8 Acres
10870 Hwy 113, Dry Creek, LA 70637
MLS# 26-5280Listed by: EXIT REAL ESTATE CONSULTANTS  $2,500,000Active3 beds 2 baths4,534 sq. ft.
364 Morrow Bridge Rd, Dry Creek, LA 70637
MLS# 26-5132Listed by: EXIT REAL ESTATE CONSULTANTS $199,000Active2 beds 1 baths1,064 sq. ft.
635 Jay Miller Rd, Dry Creek, LA 70637
MLS# 61-222Listed by: NEXTHOME BAYOU PINES $112,500Active30 Acres
0 Morrow Bridge Rd, Dry Creek, LA 70637
MLS# 44-171Listed by: EXIT REALTY SOUTHERN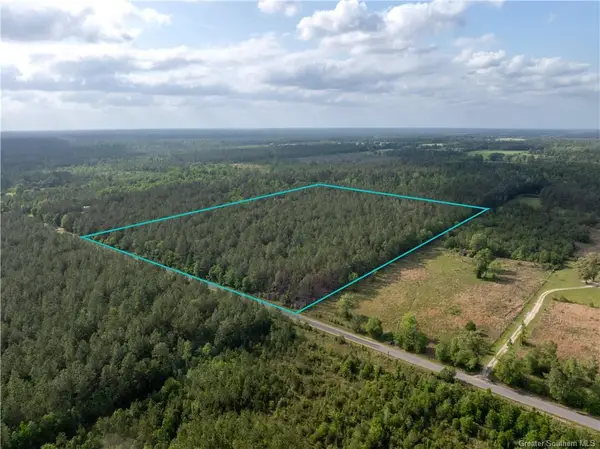 $105,000Active30 Acres
0 Morrow Bridge Road, Dry Creek, LA 70637
MLS# SWL25002320Listed by: EXIT REALTY SOUTHERN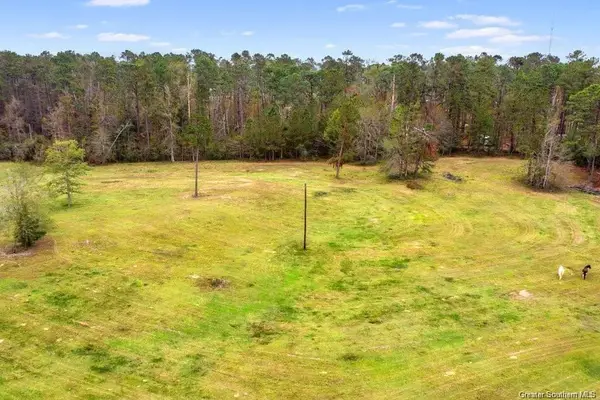 $49,000Active6.5 Acres
Hwy 113, Dry Creek, LA 70637
MLS# 15-5009Listed by: COLDWELL BANKER INGLE SAFARI REALTY $49,000Active6.5 Acres
0 Highway 113 Highway, Dry Creek, LA 70637
MLS# SWL25000920Listed by: COLDWELL BANKER INGLE SAFARI R
Local realty services provided by:CENTURY 21 Delia Realty Group
Popular searches near 70637
Popular neighborhoods near 70637
- Arnould Heights, Lafayette homes for sale
- Bendel Gardens, Lafayette homes for sale
- Beverly Hills, Sulphur homes for sale
- Cable, Beaumont homes for sale
- Charlton Pollard, Beaumont homes for sale
- College Corridor, Beaumont homes for sale
- Gold Hill, Beaumont homes for sale
- Graywood, Lake Charles homes for sale
- Magnolia Park, Lafayette homes for sale
- Maplewood, Sulphur homes for sale
- MLK, Beaumont homes for sale
- North End, Beaumont homes for sale
- Oaklawn Heights, Lafayette homes for sale
- Pinecrest, Beaumont homes for sale
- River Ranch, Lafayette homes for sale
- Souvenir Heights, Lafayette homes for sale
- Stonegate Manor, Port Arthur homes for sale
- Sugar Mill Pond, Youngsville homes for sale
- West End Heights West, Lafayette homes for sale
- Westwood, Westlake homes for sale
Counties near Dry Creek, 70637
- Acadia County homes for sale
- Allen County homes for sale
- Avoyelles County homes for sale
- Beauregard County homes for sale
- Calcasieu County homes for sale
- Cameron County homes for sale
- Evangeline County homes for sale
- Grant County homes for sale
- Jasper County homes for sale
- Jefferson Davis County homes for sale
- Lafayette County homes for sale
- Natchitoches County homes for sale
- Newton County homes for sale
- Orange County homes for sale
- Rapides County homes for sale
- Sabine County homes for sale
- Sabine County homes for sale
- St. Landry County homes for sale
- Vermilion County homes for sale
- Vernon County homes for sale
Protect your home and budget from life's surprises with an Assurant Home Warranty, backed by a partner that supports you through every step of homeownership. Explore Plans.
©2026 Century 21 Real Estate LLC. All rights reserved. CENTURY 21®, the CENTURY 21 Logo and C21® are service marks owned by Century 21 Real Estate LLC. Century 21 Real Estate LLC fully supports the principles of the Fair Housing Act and the Equal Opportunity Act. Each office is independently owned and operated. Listing information is deemed reliable but not guaranteed accurate.