- Appalachia homes for sale
- Big Stone Gap homes for sale
- Bloomingdale homes for sale
- Bristol homes for sale
- Castlewood homes for sale
- Coeburn homes for sale
- Duffield homes for sale
- Dungannon homes for sale
- Fort Blackmore homes for sale
- Gate City homes for sale
- Hiltons homes for sale
- Kenady homes for sale
- Mendota homes for sale
- Nickelsville homes for sale
- Norton homes for sale
- Norton homes for sale
- Riverview homes for sale
- St Paul homes for sale
- Weber City homes for sale
- Wise homes for sale
24245, VA - homes for sale
8 of 8 results displayed
- New
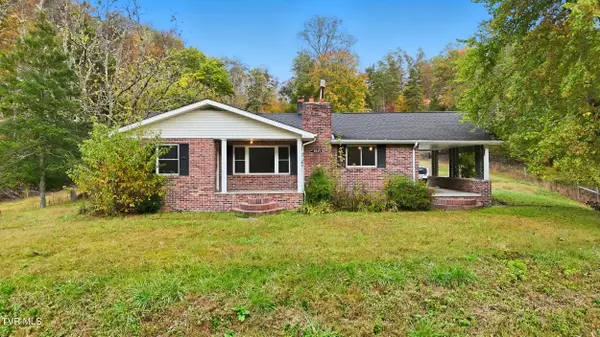 $249,999Active3 beds 1 baths1,500 sq. ft.
4849 Sinking Creek Highway, Dungannon, VA 24245
MLS# 9993043Listed by: PATH REAL ESTATE LLC  $189,900Active32 Acres
2595 Sinking Creek Highway, Dungannon, VA 24245
MLS# 9990582Listed by: BLUE RIDGE PROPERTIES $129,000Active1 beds 1 baths379 sq. ft.
282 Siesta Lodge Drive, Coeburn, VA 24230
MLS# 9988866Listed by: J F JOHNSON REAL ESTATE SERVICES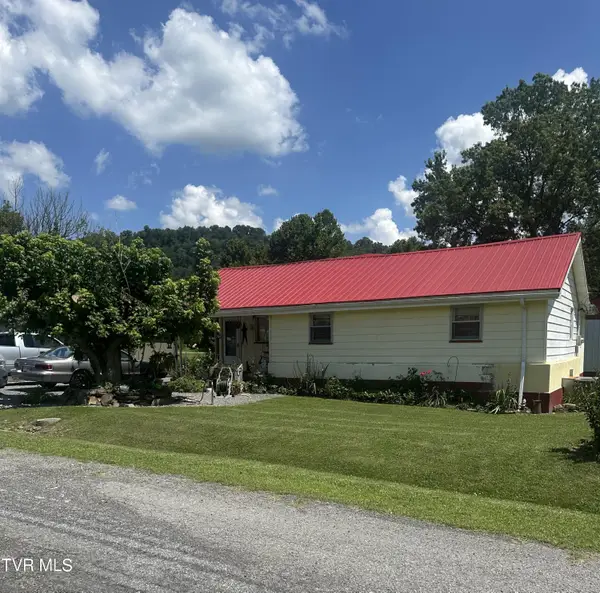 $80,000Pending2 beds 1 baths1,328 sq. ft.
244 2nd Avenue, Dungannon, VA 24245
MLS# 9983089Listed by: HOLSTON REALTY, INC.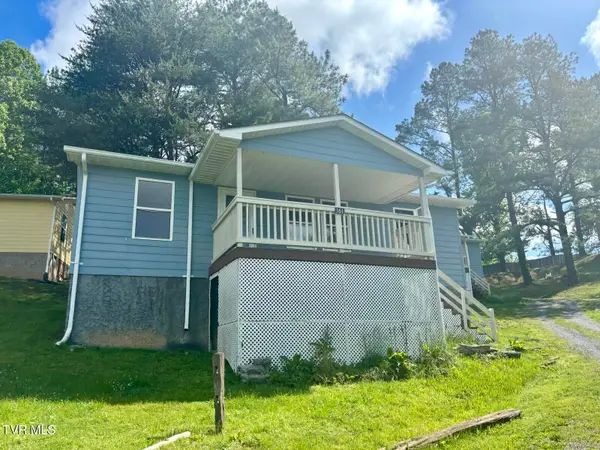 $88,000Pending3 beds 1 baths864 sq. ft.
161 Jack Rival Way, Dungannon, VA 24245
MLS# 9980441Listed by: COPPER KEY PROPERTIES $88,000Pending3 beds 1 baths864 sq. ft.
138 Jack Rival Way, Dungannon, VA 24245
MLS# 9978588Listed by: COPPER KEY PROPERTIES $73,000Active2 beds 1 baths720 sq. ft.
126 Jack Rival Way, Dungannon, VA 24245
MLS# 9978577Listed by: COPPER KEY PROPERTIES $325,000Active182 Acres
0 Osborne Ridge Road, Dungannon, VA 24245
MLS# 9937907Listed by: MATT SMITH REALTY
Local realty services provided by:CENTURY 21 Legacy
Popular searches near 24245
Popular neighborhoods near 24245
- Appalachian Ski Mountain, Blowing Rock homes for sale
- Blue Ridge Mountain Club, Elk homes for sale
- Burke Mountains, Morganton homes for sale
- English Mountain, Sevierville homes for sale
- Grace, Asheville homes for sale
- Headwaters, Elk Park homes for sale
- Hound Ears, Boone homes for sale
- Jefferson Landing on the New River, Jefferson homes for sale
- Lake James, Linville homes for sale
- Lakeview Park, Asheville homes for sale
- Laurel Ridge, Black Mountain homes for sale
- Linville Ridge, Linville homes for sale
- Montreat, Black Mountain homes for sale
- Norris Shores, Sharps Chapel homes for sale
- North Asheville, Asheville homes for sale
- Reynolds Mountain, Asheville homes for sale
- Sherwood Heights, Asheville homes for sale
- The Lodges at Eagles Nest, Banner Elk homes for sale
- Town Mountain Preserve, Asheville homes for sale
- Upper Creek, Morganton homes for sale
Counties near Dungannon, 24245
- Bristol city County homes for sale
- Buchanan County homes for sale
- Carter County homes for sale
- Dickenson County homes for sale
- Hancock County homes for sale
- Harlan County homes for sale
- Hawkins County homes for sale
- Johnson County homes for sale
- Knott County homes for sale
- Lee County homes for sale
- Letcher County homes for sale
- Norton city County homes for sale
- Perry County homes for sale
- Pike County homes for sale
- Russell County homes for sale
- Scott County homes for sale
- Sullivan County homes for sale
- Washington County homes for sale
- Washington County homes for sale
- Wise County homes for sale
Protect your home and budget from life's surprises with an Assurant Home Warranty, backed by a partner that supports you through every step of homeownership. Explore Plans.
©2026 Century 21 Real Estate LLC. All rights reserved. CENTURY 21®, the CENTURY 21 Logo and C21® are service marks owned by Century 21 Real Estate LLC. Century 21 Real Estate LLC fully supports the principles of the Fair Housing Act and the Equal Opportunity Act. Each office is independently owned and operated. Listing information is deemed reliable but not guaranteed accurate.