- Big River homes for sale
- Blythe homes for sale
- Bouse homes for sale
- Chuckwalla Valley homes for sale
- Earp homes for sale
- Golden Shores homes for sale
- La Paz Valley homes for sale
- Lake Havasu City homes for sale
- Mesa Verde homes for sale
- Needles homes for sale
- Palo Verde homes for sale
- Parker Dam homes for sale
- Quartzsite homes for sale
- Ripley homes for sale
- Salome homes for sale
- Utting homes for sale
- Vicksburg homes for sale
- Wenden homes for sale
- Wikieup homes for sale
- Yucca homes for sale
92242, CA - homes for sale
35 of 35 results displayed
- New
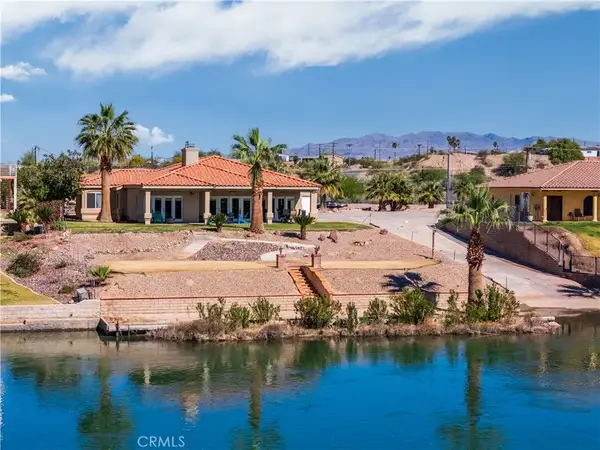 $499,900Active4 beds 3 baths2,403 sq. ft.
7515 Rio Vista, Big River, CA 92242
MLS# OC26064089Listed by: ANVIL REAL ESTATE - New
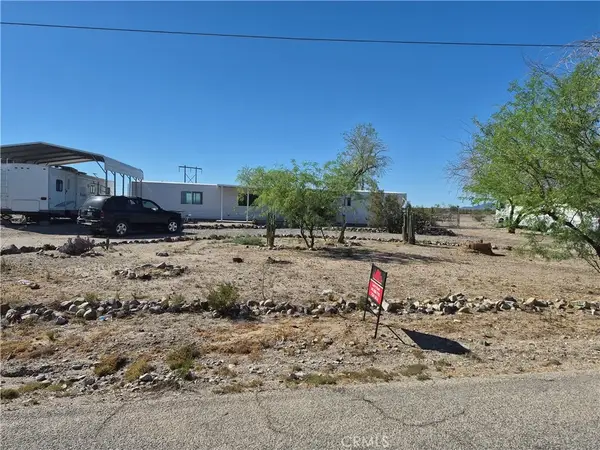
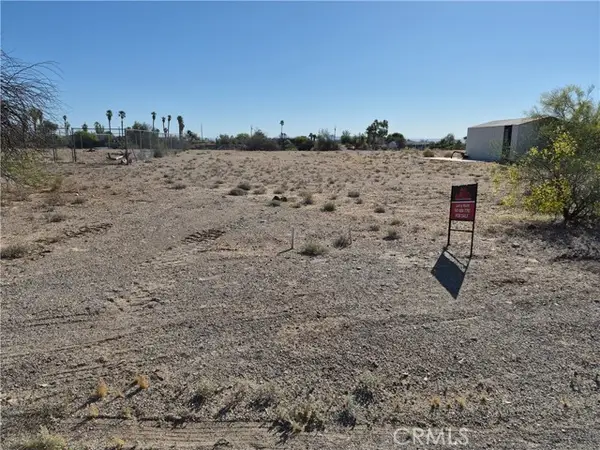 $20,000Active0.41 Acres
7373 Oneida, Big River, CA 92242
MLS# CRHD26064529Listed by: BIG RIVER REALTY - New
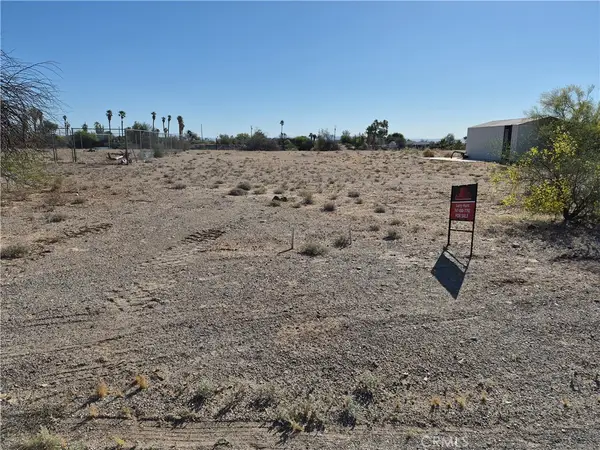 $20,000Active0.41 Acres
7373 Oneida, Big River, CA 92242
MLS# HD26064529Listed by: BIG RIVER REALTY - New
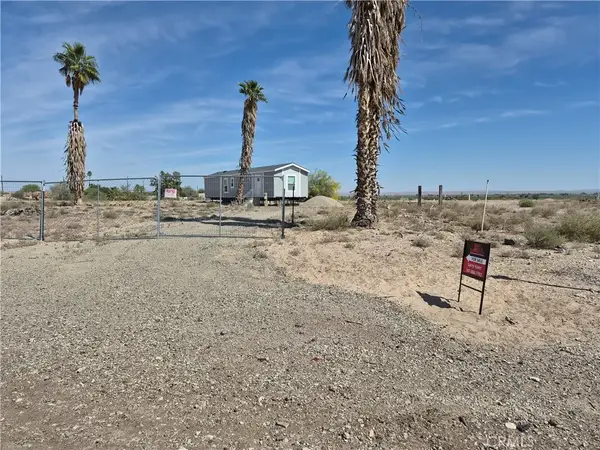 $145,000Active2 beds 2 baths672 sq. ft.
7389 Onieda, Big River, CA 92242
MLS# HD26062946Listed by: BIG RIVER REALTY - New
 $85,000Active1 beds 2 baths900 sq. ft.
7348 Chocco Road, Big River, CA 92242
MLS# HD26059804Listed by: BIG RIVER REALTY  $15,000Active0 Acres
149665 Lakota, Big River, CA 92242
MLS# HD26052099Listed by: BIG RIVER REALTY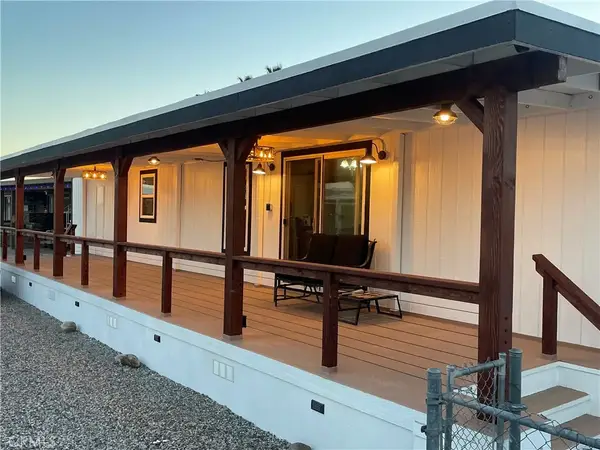 $225,000Active3 beds 2 baths925 sq. ft.
50918 Parker Dam #121, Parker, CA 92242
MLS# CV26038919Listed by: EXCELLENCE RE REAL ESTATE $540,000Active4 beds 2 baths1,203 sq. ft.
151429 Rio Vista, Big River, CA 92242
MLS# OC26037369Listed by: ANVIL REAL ESTATE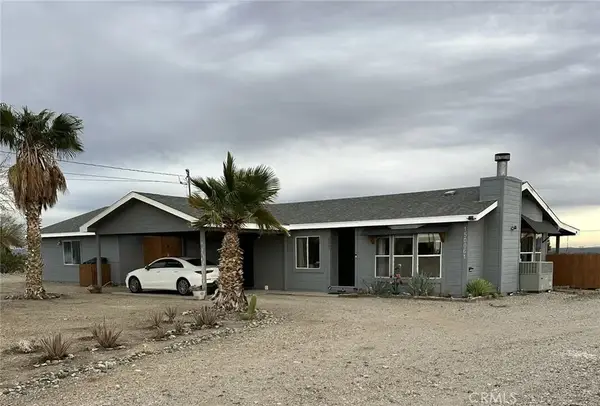 $195,999Active2 beds 2 baths1,144 sq. ft.
150061 Seminole Trail, Big River, CA 92242
MLS# PW26032091Listed by: FIRST TEAM REAL ESTATE $375,000Active3 beds 2 baths1,714 sq. ft.
50761 Parker Dam Rd. #71 #71, Big River, CA 92242
MLS# CV26013242Listed by: AMERICAN CREDIT MORTGAGE, INC. $995,000Active8 beds 5 baths6,099 sq. ft.
7645 Rio Vista, Big River, CA 92242
MLS# OC25272159Listed by: REAL BROKER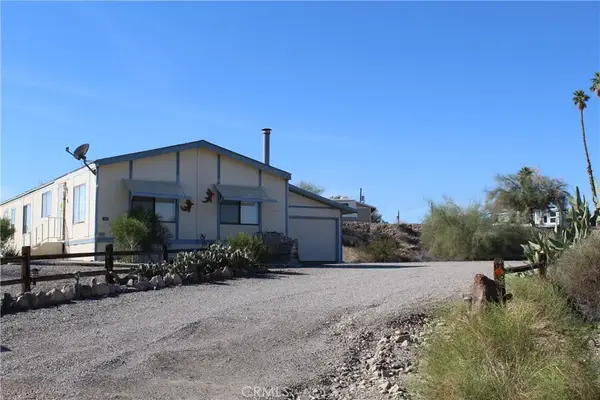 $119,999Active2 beds 2 baths1,344 sq. ft.
7434 Oneida Trail, Big River, CA 92242
MLS# PW25269627Listed by: FIRST TEAM REAL ESTATE $249,900Active3 beds 2 baths2,434 sq. ft.
5800 Modoc Trail, Big River, CA 92242
MLS# HD25266322Listed by: COLDWELL BANKER HOME SOURCE $125,000Active3 beds 2 baths1,250 sq. ft.
149565 Del Rey, Big River, CA 92242
MLS# HD25265275Listed by: BIG RIVER REALTY $59,000Active0 Acres
0 Street, Big River, CA 92242
MLS# IG25265583Listed by: EXP REALTY OF SOUTHERN CALIFORNIA $999,999Active9 beds 6 baths5,350 sq. ft.
7899 Rio Vista, Big River, CA 92242
MLS# OC25262569Listed by: ANVIL REAL ESTATE $79,800Active2 beds 1 baths672 sq. ft.
1451 Parker Dam #48, Parker, CA 92242
MLS# TR25254441Listed by: EXP REALTY OF CALIFORNIA INC $525,000Active4 beds 3 baths2,081 sq. ft.
7449 Rio Vista, Big River, CA 92242
MLS# CROC25256652Listed by: ANVIL REAL ESTATE $599,900Active3 beds 2 baths1,604 sq. ft.
151993 Rio Vista, Big River, CA 92242
MLS# CROC25256500Listed by: ANVIL REAL ESTATE $75,000Pending2 beds 2 baths960 sq. ft.
5704 Modoc, Big River, CA 92242
MLS# HD25245787Listed by: BIG RIVER REALTY $4,000Active0 Acres
0 Main, Big River, CA 92242
MLS# HD25242330Listed by: BIG RIVER REALTY $375,000Active3 beds 3 baths2,846 sq. ft.
6509 Salulu, Big River, CA 92242
MLS# OC25239884Listed by: ANVIL REAL ESTATE $8,388Active0 Acres
16303 Main (fka Old Parker), Big River, CA 92280
MLS# OC25206439Listed by: SMOKETREE COMMERCIAL $3,000Active0 Acres
5568 Modoc, Big River, CA 92242
MLS# HD25198884Listed by: BIG RIVER REALTY $285,000Active4 beds 4 baths2,722 sq. ft.
150578 Arizona Street, Big River, CA 92242
MLS# HD25199591Listed by: BIG RIVER REALTY $245,000Active1 beds 1 baths
45 Havasu Palms, Parker Dam, Ca 92267, Parker, CA 92267
MLS# HD25186005Listed by: ALLYN ROSETTA, BROKER $200,000Active5 beds 3 baths2,550 sq. ft.
150443 Del Rey Drive, Big River, CA 92242
MLS# IG25142046Listed by: TOP PRODUCERS REALTY, RYJEN GROUP $25,000Active0 Acres
0 Old Parker Rd, Vidal, CA 92242
MLS# IG25143611Listed by: TOP PRODUCERS REALTY, RYJEN GROUP $65,000Active2 beds 2 baths1,800 sq. ft.
149825 Pahaska Court, Big River, CA 92242
MLS# HD25127443Listed by: BIG RIVER REALTY $139,999Pending3 beds 2 baths2,090 sq. ft.
7554 Acoma Trail #277, Big River, CA 92242
MLS# PW25116179Listed by: FIRST TEAM REAL ESTATE $3,000Active0 Acres
0 Chumash, Big River, CA 92242
MLS# HD25093434Listed by: BIG RIVER REALTY $3,000Active0 Acres
149906 Seminole, Big River, CA 92242
MLS# HD25056065Listed by: BIG RIVER REALTY $3,500Active0 Acres
0 Acoma, Big River, CA 92242
MLS# RW24230809Listed by: BIG RIVER REALTY $109,999Pending0 Acres
7825 Rio Vista, Big River, CA 92242
MLS# PW24211652Listed by: FIRST TEAM REAL ESTATE $7,000Active0 Acres
0 Main St, Big River, CA 92242
MLS# JT26029638Listed by: EXP REALTY OF SOUTHERN CALIFORNIA, INC.
Local realty services provided by:CENTURY 21 Affiliated, CENTURY 21 Sierra Properties, CENTURY 21 Valley Properties
This information is deemed reliable but not guaranteed. You should rely on this information only to decide whether or not to further investigate a particular property. BEFORE MAKING ANY OTHER DECISION, YOU SHOULD PERSONALLY INVESTIGATE THE FACTS (e.g. square footage and lot size) with the assistance of an appropriate professional. You may use this information only to identify properties you may be interested in investigating further. All uses except for personal, non-commercial use in accordance with the foregoing purpose are prohibited. Redistribution or copying of this information, any photographs or video tours is strictly prohibited. This information is derived from the Internet Data Exchange (IDX) service provided by San Diego MLS®. Displayed property listings may be held by a brokerage firm other than the broker and/or agent responsible for this display. The information and any photographs and video tours and the compilation from which they are derived is protected by copyright. Compilation © 2020 San Diego MLS®, Inc.
The information being provided by California Regional MLS (Southern California) is for the consumer's personal, non-commercial use and may not be used for any purpose other than to identify prospective properties consumer may be interested in purchasing. Any information relating to real estate for sale referenced on this web site comes from the Internet Data Exchange (IDX) program of the California Regional MLS (Southern California). CENTURY 21 Valley Properties is not a Multiple Listing Service (MLS), nor does it offer MLS access. This website is a service of CENTURY 21 Valley Properties, a broker participant of California Regional MLS (Southern California). This web site may reference real estate listing(s) held by a brokerage firm other than the broker and/or agent who owns this web site.
The accuracy of all information, regardless of source, including but not limited to open house information, square footages and lot sizes, is deemed reliable but not guaranteed and should be personally verified through personal inspection by and/or with the appropriate professionals. The data contained herein is copyrighted by California Regional MLS (Southern California) and is protected by all applicable copyright laws. Any unauthorized dissemination of this information is in violation of copyright laws and is strictly prohibited.
Copyright 2021 California Regional MLS (Southern California). All rights reserved.
Popular searches near 92242
Popular neighborhoods near 92242
Protect your home and budget from life's surprises with an Assurant Home Warranty, backed by a partner that supports you through every step of homeownership. Explore Plans.
©2026 Century 21 Real Estate LLC. All rights reserved. CENTURY 21®, the CENTURY 21 Logo and C21® are service marks owned by Century 21 Real Estate LLC. Century 21 Real Estate LLC fully supports the principles of the Fair Housing Act and the Equal Opportunity Act. Each office is independently owned and operated. Listing information is deemed reliable but not guaranteed accurate.