- Cutchogue properties for sale
- East Marion properties for sale
- Greenport properties for sale
- Greenport West properties for sale
- North Haven properties for sale
- Northwest Harbor properties for sale
- Noyack properties for sale
- Old Saybrook properties for sale
- Old Saybrook Center properties for sale
- Orient properties for sale
- Peconic properties for sale
- Sag Harbor properties for sale
- Saybrook Manor properties for sale
- Shelter Island properties for sale
- Shelter Island Heights properties for sale
- Shelter Island town properties for sale
- Southold properties for sale
- Southold town properties for sale
- Springs properties for sale
- Westbrook Center properties for sale
11939, NY - homes for sale
12 of 12 results displayed
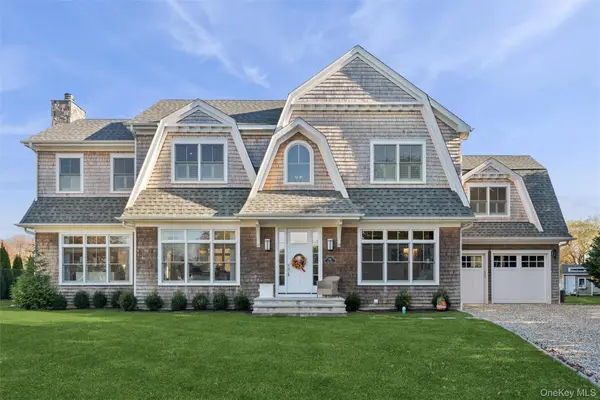 $2,595,000Active5 beds 5 baths3,400 sq. ft.
605 Gus Drive, East Marion, NY 11939
MLS# 934884Listed by: DOUGLAS ELLIMAN REAL ESTATE $999,999Pending3 beds 2 baths1,250 sq. ft.
455 West Lane, East Marion, NY 11939
MLS# 933636Listed by: DOUGLAS ELLIMAN REAL ESTATE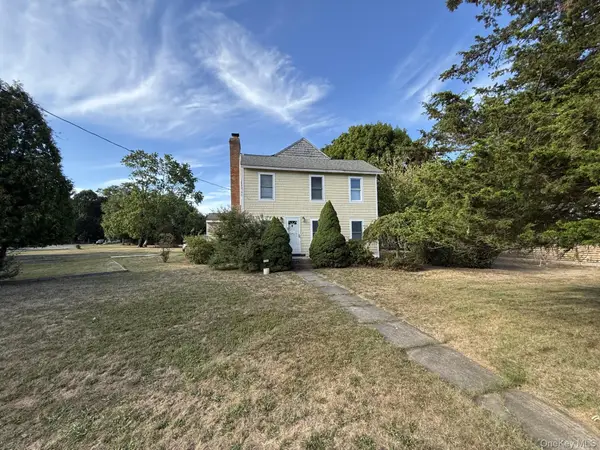 $749,900Active5 beds 3 baths2,000 sq. ft.
11005 Main Road, East Marion, NY 11939
MLS# 903269Listed by: WILLIAM RAVEIS NEW YORK LLC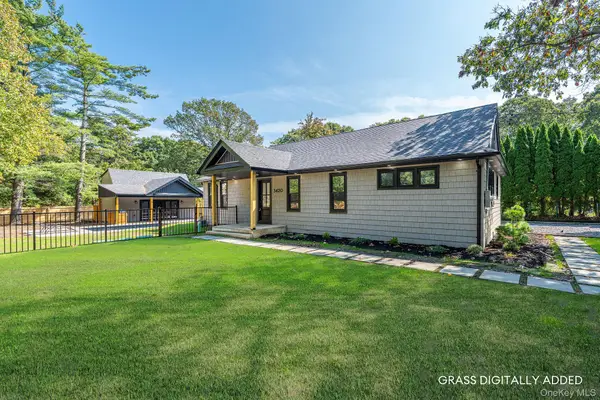 $1,299,000Active3 beds 3 baths1,400 sq. ft.
3420 Rocky Point Road, East Marion, NY 11939
MLS# 916674Listed by: DOUGLAS ELLIMAN REAL ESTATE $1,895,000Active4 beds 4 baths2,857 sq. ft.
1900 Gillette Drive, East Marion, NY 11939
MLS# 909423Listed by: CORCORAN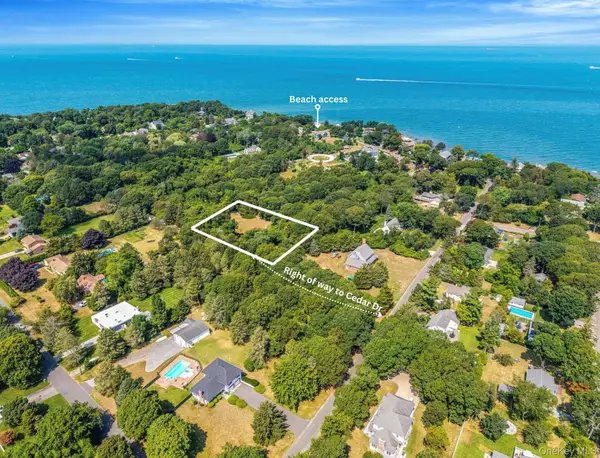 $645,000Active1.02 Acres
702 Cedar Drive, East Marion, NY 11939
MLS# 906109Listed by: REALTY CONNECT USA L I INC $1,875,000Active5 beds 5 baths3,200 sq. ft.
2060 Shipyard Lane, East Marion, NY 11939
MLS# 889608Listed by: COMPASS GREATER NY LLC $595,000Pending0.48 Acres
345 The Strand, East Marion, NY 11939
MLS# 885013Listed by: REALTY CONNECT USA L I INC- Open Sat, 1 to 2:30pm
 $2,049,000Active3 beds 3 baths1,923 sq. ft.
12910 Main Road, East Marion, NY 11939
MLS# 878494Listed by: DOUGLAS ELLIMAN REAL ESTATE  $1,650,000Active4 beds 3 baths2,700 sq. ft.
2655 Rocky Point Road, East Marion, NY 11939
MLS# 855923Listed by: KELLER WILLIAMS LANDMARK II $650,000Active0.96 Acres
11100 Main Road, East Marion, NY 11939
MLS# 909575Listed by: WILLIAM RAVEIS NEW YORK LLC- Open Sat, 11:30am to 12:30pm
 $850,000Active3 beds 4 baths2,000 sq. ft.
235 Cemetery Road, East Marion, NY 11939
MLS# 849430Listed by: DOUGLAS ELLIMAN REAL ESTATE
Local realty services provided by:CENTURY 21 Hire Realty
Popular searches near 11939
Popular neighborhoods near 11939
- Amagansett, Amagansett properties for sale
- Bridgehampton, Bridgehampton properties for sale
- Cutchogue, Cutchogue properties for sale
- East Hampton North, East Hampton properties for sale
- East Marion, East Marion properties for sale
- Greenport West, Greenport properties for sale
- Laurel, Laurel properties for sale
- Mattituck, Mattituck properties for sale
- North Sea, Southampton properties for sale
- Northwest Harbor, East Hampton properties for sale
- Noyack, Sag Harbor properties for sale
- Orient, Orient properties for sale
- Peconic, Peconic properties for sale
- Shelter Island, Shelter Island properties for sale
- Shelter Island Heights, Shelter Island Heights properties for sale
- Southold, Southold properties for sale
- Springs, East Hampton properties for sale
- Tuckahoe, Southampton properties for sale
- Wainscott, East Hampton properties for sale
- Water Mill, Water Mill properties for sale
Counties near East Marion, 11939
- Bristol County properties for sale
- Bristol County properties for sale
- Bronx County properties for sale
- Fairfield County properties for sale
- Hampden County properties for sale
- Hartford County properties for sale
- Kent County properties for sale
- Litchfield County properties for sale
- Middlesex County properties for sale
- Nassau County properties for sale
- New Haven County properties for sale
- New London County properties for sale
- Newport County properties for sale
- Providence County properties for sale
- Putnam County properties for sale
- Suffolk County properties for sale
- Tolland County properties for sale
- Washington County properties for sale
- Westchester County properties for sale
- Windham County properties for sale
©2025 Century 21 Real Estate LLC. All rights reserved. CENTURY 21®, the CENTURY 21 Logo and C21® are service marks owned by Century 21 Real Estate LLC. Century 21 Real Estate LLC fully supports the principles of the Fair Housing Act and the Equal Opportunity Act. Each office is independently owned and operated. Listing information is deemed reliable but not guaranteed accurate.
©2025 Century 21 Real Estate LLC. All rights reserved. CENTURY 21®, the CENTURY 21 Logo and C21® are service marks owned by Century 21 Real Estate LLC. Century 21 Real Estate LLC fully supports the principles of the Fair Housing Act and the Equal Opportunity Act. Each office is independently owned and operated. Listing information is deemed reliable but not guaranteed accurate.