- Blackridge, Pittsburgh properties for sale
- East Liberty, Pittsburgh properties for sale
- Greenfield, Pittsburgh properties for sale
- Hazelwood, Pittsburgh properties for sale
- Homewood, Pittsburgh properties for sale
- Homewood North, Pittsburgh properties for sale
- Laketon, Pittsburgh properties for sale
- Lincoln-Lemington-Belmar, Pittsburgh properties for sale
- Lincoln Place, Pittsburgh properties for sale
- New Homestead, Homestead properties for sale
- Park Triangle, Pittsburgh properties for sale
- Point Breeze, Pittsburgh properties for sale
- Point Breeze North, Pittsburgh properties for sale
- Shadyside, Pittsburgh properties for sale
- South Oakland, Pittsburgh properties for sale
- South Side Flats, Pittsburgh properties for sale
- Squirrel Hill, Pittsburgh properties for sale
- Squirrel Hill North, Pittsburgh properties for sale
- Squirrel Hill South, Pittsburgh properties for sale
- Swisshelm Park, Pittsburgh properties for sale
East Pittsburgh, PA - homes for sale
10 of 10 results displayed
 $99,900Pending2 beds 1 baths1,081 sq. ft.
548 Ridge Ave, E Pittsburgh, PA 15112
MLS# 1732659Listed by: HOWARD HANNA REAL ESTATE SERVICES
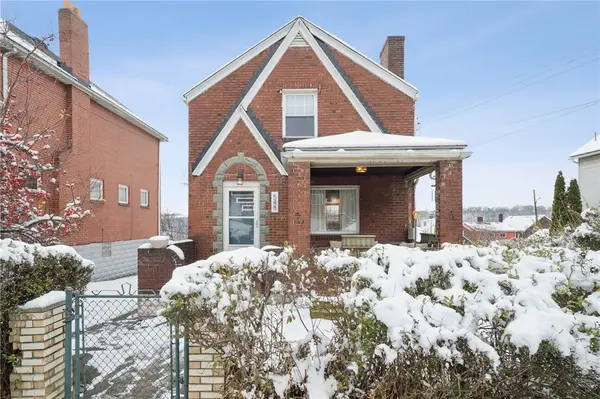
 $150,000Active3 beds 2 baths1,294 sq. ft.
406 Ridge Ave, E Pittsburgh, PA 15112
MLS# 1729888Listed by: BERKSHIRE HATHAWAY THE PREFERRED REALTY $199,500Active4 beds 2 baths1,600 sq. ft.
328 Center St, E Pittsburgh, PA 15112
MLS# 1729845Listed by: RE/MAX SELECT REALTY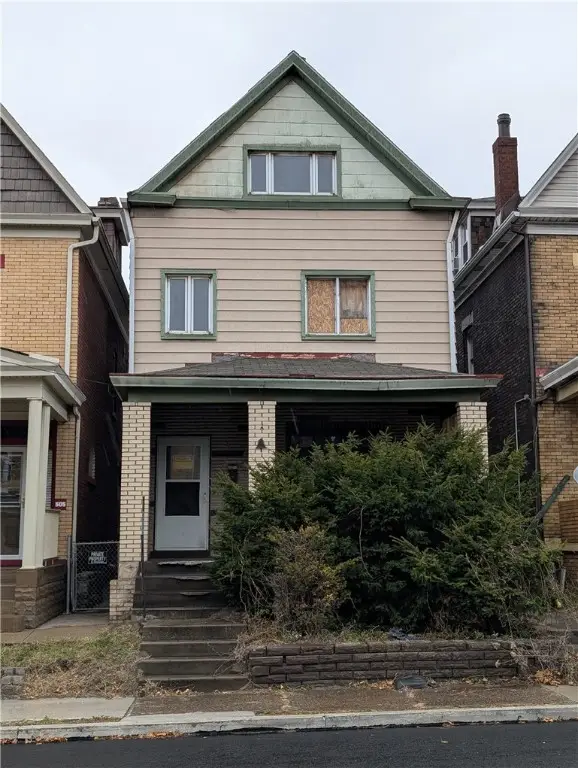 $59,200Active5 beds 3 baths2,400 sq. ft.
507 Center St, E Pittsburgh, PA 15112
MLS# 1729823Listed by: RE/MAX SELECT REALTY $60,000Pending-- beds -- baths
405 Center St, E Pittsburgh, PA 15112
MLS# 1722576Listed by: PARK PLACE REALTY GROUP LLC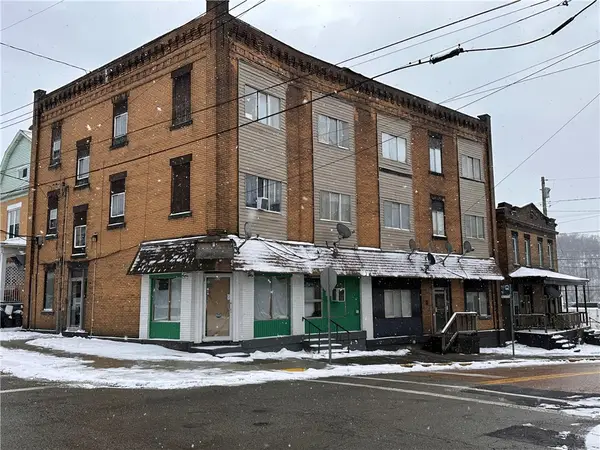 $450,000Pending-- beds -- baths
514 Main Street, E Pittsburgh, PA 15112
MLS# 1690844Listed by: REALTY ONE GROUP GOLD STANDARD $22,500Active3 beds 1 baths980 sq. ft.
505 South Park St, E Pittsburgh, PA 15112
MLS# 1690664Listed by: JANUS REALTY ADVISORS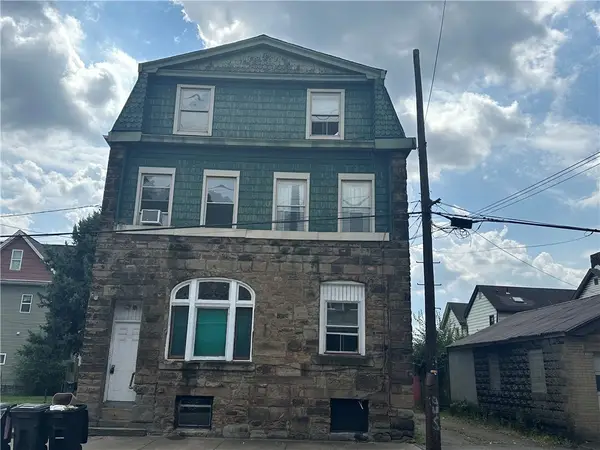 $175,000Pending-- beds -- baths
308 Bessemer Ave, E Pittsburgh, PA 15112
MLS# 1711372Listed by: ENGEL & VOLKERS SEWICKLEY $75,000Active2 beds 1 baths884 sq. ft.
110 Center St, E Pittsburgh, PA 15112
MLS# 1711383Listed by: ENGEL & VOLKERS SEWICKLEY $2,500Active-- beds -- baths
0 Glosser, E Pittsburgh, PA 15112
MLS# 1712886Listed by: DUCK HOLLOW REALTY LLC
Local realty services provided by:CENTURY 21 Frontier Realty
Last Updated December 17, 2025. Information deemed reliable but not guaranteed. Information is provided exclusively for consumers' personal, non-commercial use and may not be used for any purpose other than to identify prospective properties consumers may be interested in purchasing.
Neighborhoods near East Pittsburgh, PA
Zip codes near East Pittsburgh, PA
- 15034 properties for sale
- 15035 properties for sale
- 15104 properties for sale
- 15110 properties for sale
- 15112 properties for sale
- 15120 properties for sale
- 15122 properties for sale
- 15132 properties for sale
- 15133 properties for sale
- 15137 properties for sale
- 15140 properties for sale
- 15145 properties for sale
- 15146 properties for sale
- 15148 properties for sale
- 15207 properties for sale
- 15208 properties for sale
- 15217 properties for sale
- 15218 properties for sale
- 15221 properties for sale
- 15235 properties for sale
Popular searches near East Pittsburgh, PA
- Braddock properties for sale
- Braddock Hills properties for sale
- Chalfant properties for sale
- Churchill properties for sale
- Duquesne properties for sale
- East McKeesport properties for sale
- Edgewood properties for sale
- Forest Hills properties for sale
- McKeesport properties for sale
- Munhall properties for sale
- North Braddock properties for sale
- North Versailles properties for sale
- Pitcairn properties for sale
- Rankin properties for sale
- Swissvale properties for sale
- Turtle Creek properties for sale
- Whitaker properties for sale
- Wilkins Township properties for sale
- Wilkinsburg properties for sale
- Wilmerding properties for sale
©2025 Century 21 Real Estate LLC. All rights reserved. CENTURY 21®, the CENTURY 21 Logo and C21® are service marks owned by Century 21 Real Estate LLC. Century 21 Real Estate LLC fully supports the principles of the Fair Housing Act and the Equal Opportunity Act. Each office is independently owned and operated. Listing information is deemed reliable but not guaranteed accurate.
©2025 Century 21 Real Estate LLC. All rights reserved. CENTURY 21®, the CENTURY 21 Logo and C21® are service marks owned by Century 21 Real Estate LLC. Century 21 Real Estate LLC fully supports the principles of the Fair Housing Act and the Equal Opportunity Act. Each office is independently owned and operated. Listing information is deemed reliable but not guaranteed accurate.