- Aberdeen, Pueblo homes for sale
- Belmont, Pueblo homes for sale
- Bessemer, Pueblo homes for sale
- City Hall Place, Pueblo homes for sale
- Colorado State University - Pueblo, Pueblo homes for sale
- Country Club, Pueblo homes for sale
- Dillon, Pueblo homes for sale
- Downtown, Pueblo homes for sale
- East Pueblo Heights, Pueblo homes for sale
- Eastwood Heights, Pueblo homes for sale
- Fairmount Park, Pueblo homes for sale
- Heritage, Pueblo homes for sale
- Hyde Park, Pueblo homes for sale
- Lakeview, Pueblo homes for sale
- Lower East Side, Pueblo homes for sale
- Mesa Junction, Pueblo homes for sale
- North Vista, Pueblo homes for sale
- Northside, Pueblo homes for sale
- Skyview, Pueblo homes for sale
- University, Pueblo homes for sale
East Side, Pueblo, CO - homes for sale
69 of 69 results displayed
- New
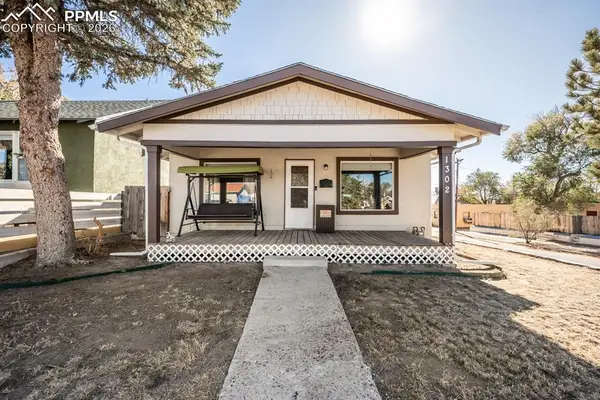 $205,000Active3 beds 1 baths1,370 sq. ft.
1302 E 10th Street, Pueblo, CO 81001
MLS# 3748385Listed by: KELLER WILLIAMS PERFORMANCE REALTY
- New
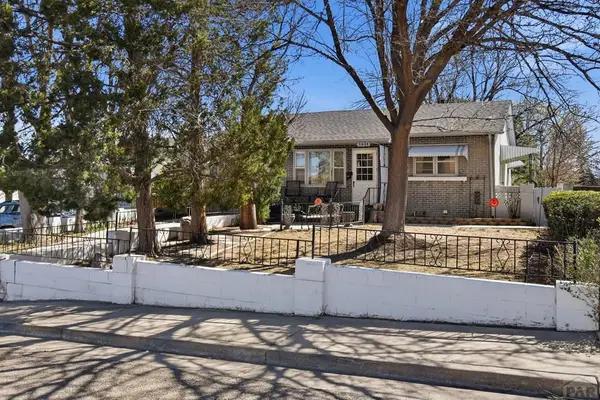
 $265,000Active5 beds 2 baths1,872 sq. ft.
1729 E 16th St, Pueblo, CO 81001
MLS# 238864Listed by: SORELLA REAL ESTATE - New
 $350,000Active4 beds 2 baths1,816 sq. ft.
1624 E 15th St, Pueblo, CO 81001
MLS# 238847Listed by: SORELLA REAL ESTATE - New
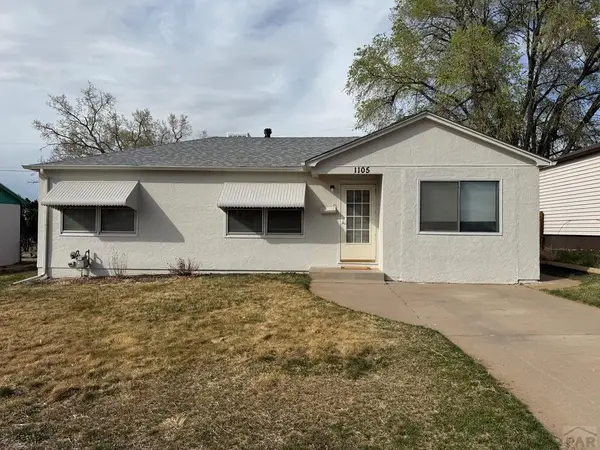 $229,000Active3 beds 2 baths1,058 sq. ft.
1105 Maudslay Ave, Pueblo, CO 81001
MLS# 238824Listed by: RE/MAX ASSOCIATES - New
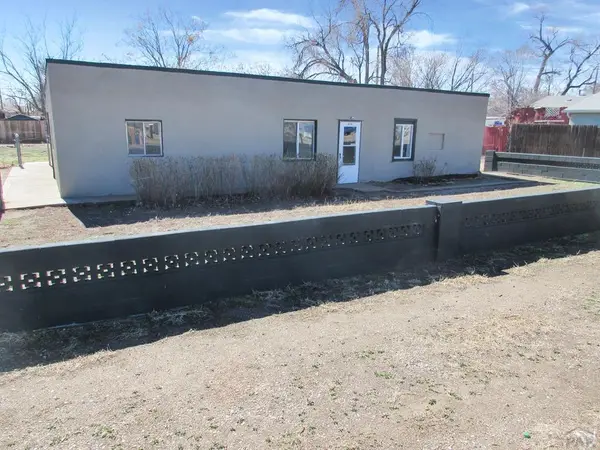 $109,000Active4 beds 2 baths1,540 sq. ft.
2106 E 8th St, Pueblo, CO 81001
MLS# 238817Listed by: SCHWABE REAL ESTATE INC - New
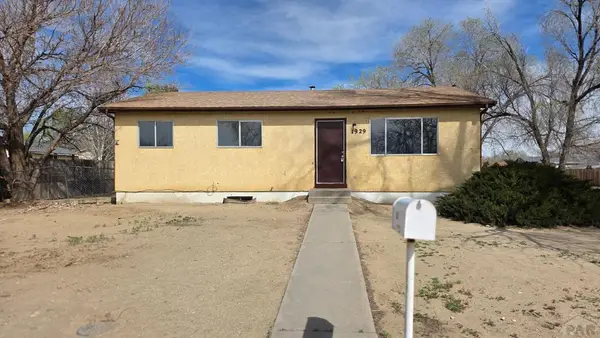 $167,500Active4 beds 2 baths1,824 sq. ft.
1929 E 12th St, Pueblo, CO 81001
MLS# 238811Listed by: RE/MAX ASSOCIATES - New
 $250,000Active4 beds 2 baths1,120 sq. ft.
2039 E 8th Street, Pueblo, CO 81001
MLS# 7510115Listed by: COLDWELL BANKER REALTY  $139,900Active2 beds 1 baths1,059 sq. ft.
1336 E 13th St, Pueblo, CO 81001
MLS# 238633Listed by: PALOMAR PROPERTIES $115,000Active2 beds 1 baths1,054 sq. ft.
909 E 11th Street, Pueblo, CO 81001
MLS# 2515312Listed by: KELLER WILLIAMS PREMIER REALTY $249,500Active5 beds 3 baths2,132 sq. ft.
927 E 11th St, Pueblo, CO 81001
MLS# 238560Listed by: RE/MAX OF PUEBLO INC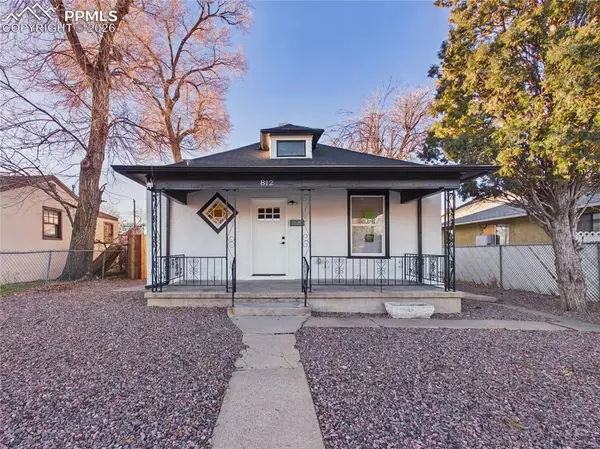 $175,000Active2 beds 1 baths950 sq. ft.
812 E 6th Street, Pueblo, CO 81001
MLS# 3761880Listed by: KELLER WILLIAMS PERFORMANCE REALTY $199,900Active3 beds 1 baths1,008 sq. ft.
902 E 11th St, Pueblo, CO 81001
MLS# 237345Listed by: SCHWABE REAL ESTATE INC $185,900Active3 beds 1 baths1,463 sq. ft.
918 E 8th St, Pueblo, CO 81001
MLS# 237321Listed by: PASTERNAK PROPERTIES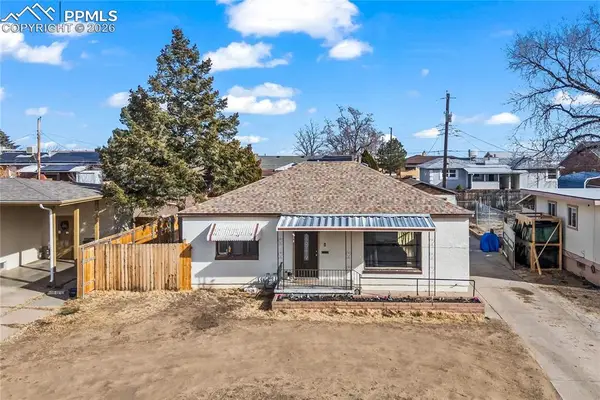 $118,000Pending2 beds 1 baths1,008 sq. ft.
1620 N Ogden Avenue, Pueblo, CO 81001
MLS# 3886985Listed by: HOME AT 6035 LLC $23,000Active0.14 Acres
2028 E 11th St, Pueblo, CO 81001
MLS# 237281Listed by: ROCKY MOUNTAIN REALTY $279,900Active3 beds 2 baths2,646 sq. ft.
1910 E 8th St, Pueblo, CO 81001
MLS# 237248Listed by: RE/MAX OF PUEBLO INC $299,999Active4 beds 2 baths1,976 sq. ft.
1817 E 18th St, Pueblo, CO 81001
MLS# 237226Listed by: HOMESMART PREFERRED REALTY $66,800Active2 beds 1 baths810 sq. ft.
2604 E 6th Street, Pueblo, CO 81001
MLS# 7995346Listed by: REALHOME SERVICES & SOLUTIONS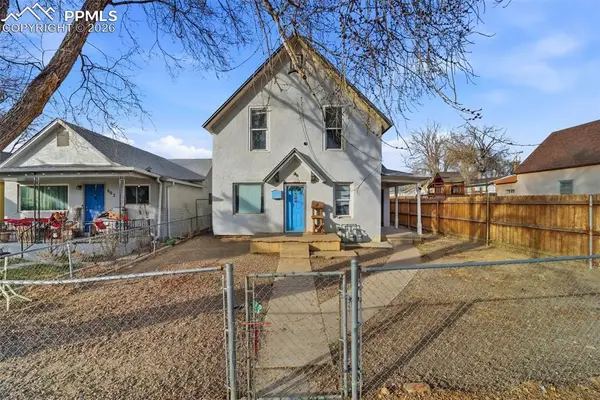 $220,000Active-- beds -- baths
805 E 7th Street, Pueblo, CO 81003
MLS# 4754393Listed by: REMAX PROPERTIES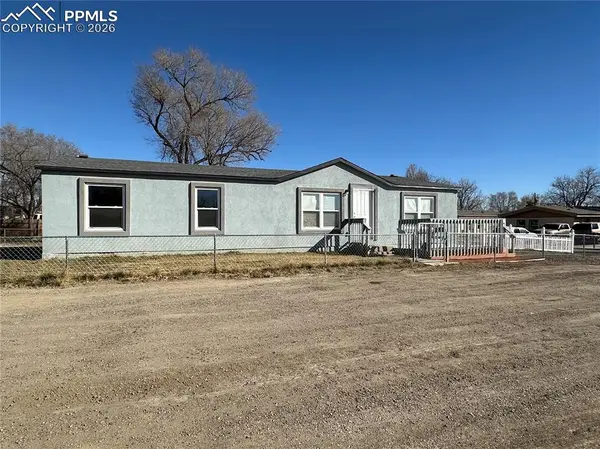 $220,000Active4 beds 2 baths1,456 sq. ft.
2501 9th Street, Pueblo, CO 81001
MLS# 5147745Listed by: KELLER WILLIAMS PERFORMANCE REALTY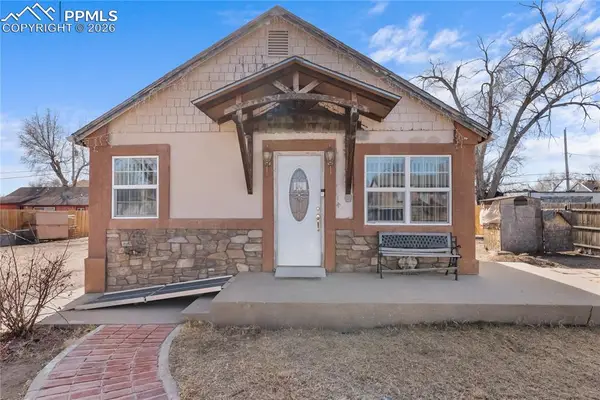 $190,000Active4 beds 1 baths1,397 sq. ft.
2034 E 11th Street, Pueblo, CO 81001
MLS# 2559446Listed by: NEXTHOME ELEVATION $305,000Active4 beds 3 baths1,900 sq. ft.
1829 N Queens Avenue, Pueblo, CO 81001
MLS# 6194982Listed by: THE CUTTING EDGE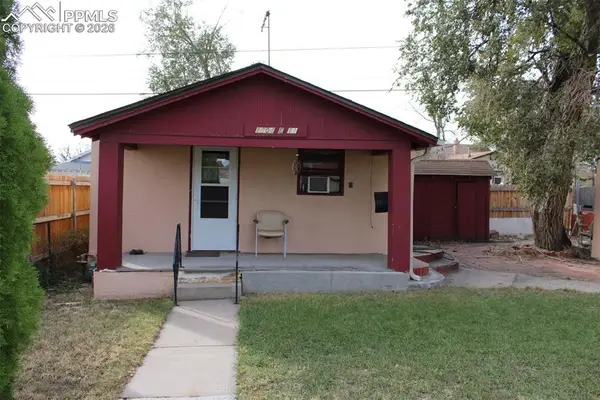 $95,000Active1 beds 1 baths400 sq. ft.
1804 E 11th Street, Pueblo, CO 81001
MLS# 1219799Listed by: RE/MAX OF PUEBLO INC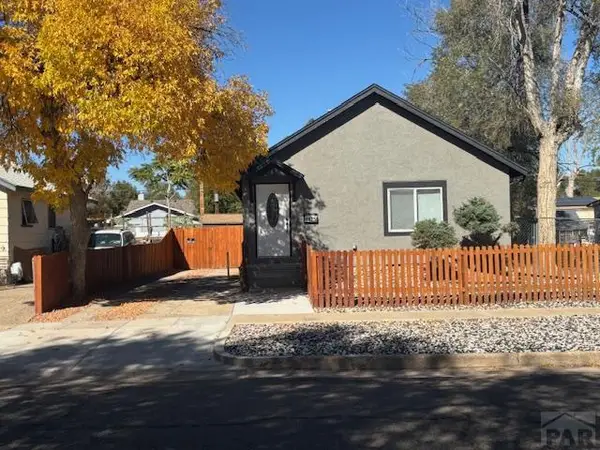 $199,900Active4 beds 1 baths1,290 sq. ft.
1925 E 9th St, Pueblo, CO 81001
MLS# 235464Listed by: ROCKY MOUNTAIN REALTY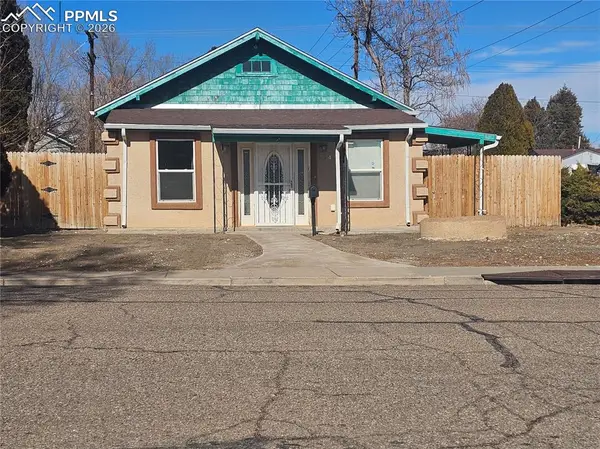 $215,000Active3 beds 2 baths1,562 sq. ft.
1641 E 13th Street, Pueblo, CO 81001
MLS# 8792655Listed by: EDEN VALLEY REAL ESTATE, LLC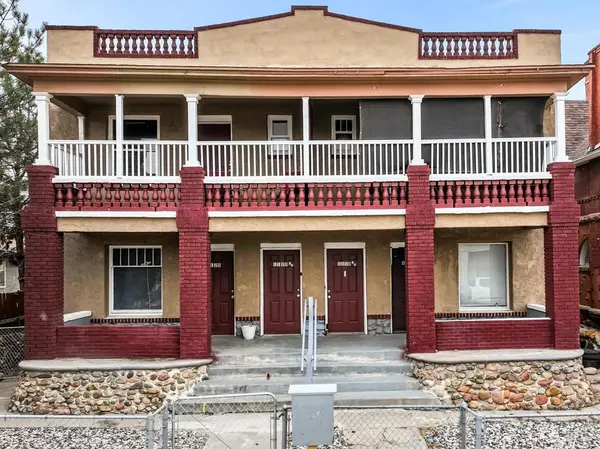 $415,000Active8 beds 4 baths4,000 sq. ft.
1118 E 6th St, Pueblo, CO 81001
MLS# 236816Listed by: ROCKY MOUNTAIN REALTY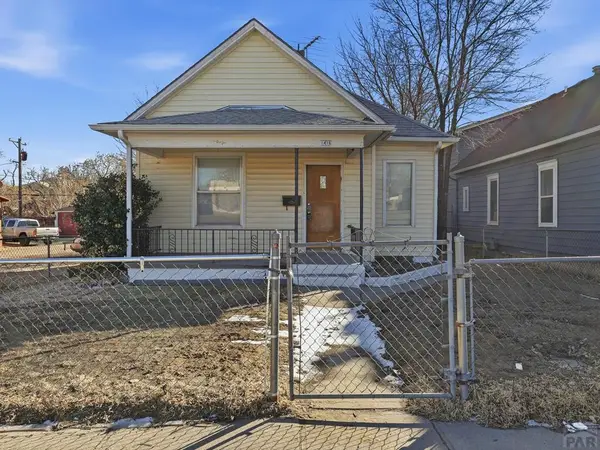 $125,000Active2 beds 1 baths964 sq. ft.
1416 E 8th St, Pueblo, CO 81001
MLS# 236799Listed by: PINK REALTY $129,900Active3 beds 2 baths1,141 sq. ft.
1023 E 6th St, Pueblo, CO 81001
MLS# 236698Listed by: ELITE HOME SALES & PROPERTY MANAGEMENT $159,900Active2 beds 1 baths736 sq. ft.
1905 E 8th Street, Pueblo, CO 81001
MLS# 4637492Listed by: KELLER WILLIAMS PREMIER REALTY $140,000Pending3 beds 1 baths1,122 sq. ft.
2201 E 8th Street, Pueblo, CO 81001
MLS# 3167506Listed by: KELLER WILLIAMS PARTNERS $227,500Active3 beds 1 baths1,410 sq. ft.
1513 E 4th Street, Pueblo, CO 81001
MLS# 8845364Listed by: GOCO CORP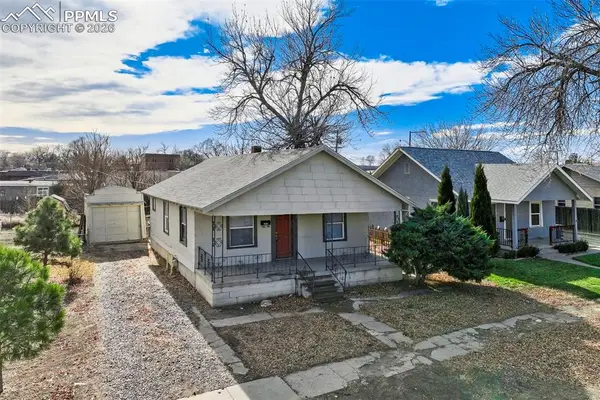 $150,000Active2 beds 1 baths1,768 sq. ft.
1912 E 5th Street, Pueblo, CO 81001
MLS# 3299103Listed by: MULDOON ASSOCIATES INC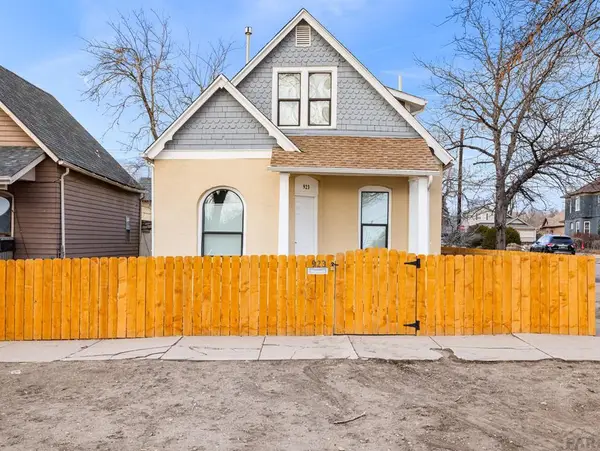 $199,900Active3 beds 2 baths1,317 sq. ft.
923 E 7th St, Pueblo, CO 81001
MLS# 236404Listed by: MALDONADO REAL ESTATE LLC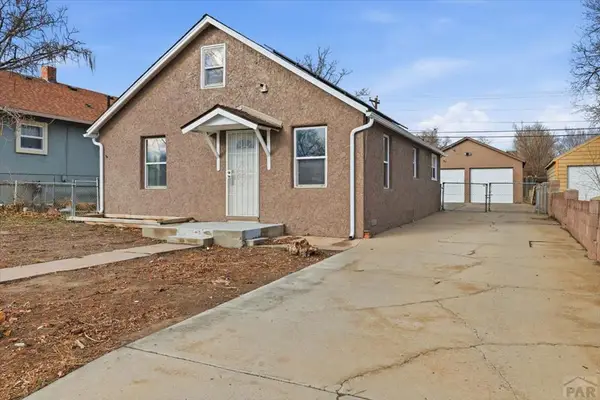 $205,000Active2 beds 1 baths1,175 sq. ft.
1833 E 13th St, Pueblo, CO 81001
MLS# 236396Listed by: PINK REALTY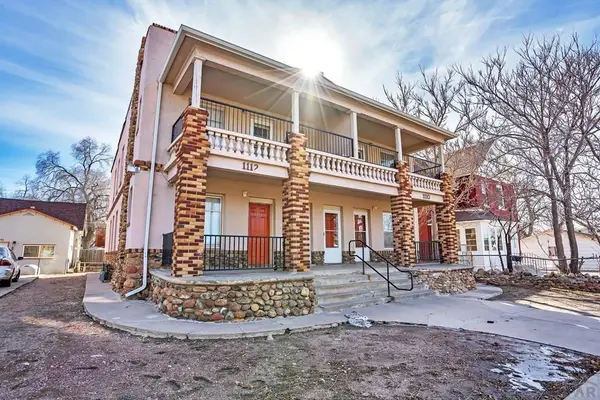 $348,596Active13 beds 9 baths4,000 sq. ft.
1110-1112 E 6th St, Pueblo, CO 81001
MLS# 236261Listed by: RE/MAX OF PUEBLO INC $235,000Active3 beds 1 baths1,048 sq. ft.
1530 N Norwood Ave, Pueblo, CO 81001
MLS# 235878Listed by: KELLER WILLIAMS PERFORMANCE REALTY $174,900Active2 beds 1 baths876 sq. ft.
1729 E 14th St, Pueblo, CO 81001
MLS# 235863Listed by: RE/MAX ASSOCIATES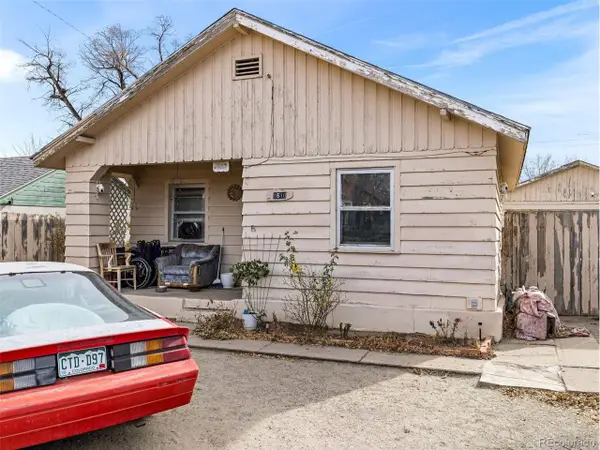 $70,000Pending2 beds 1 baths1,224 sq. ft.
1610 E 13th St, Pueblo, CO 81001
MLS# 5074627Listed by: HomeSmart $70,000Pending2 beds 1 baths1,224 sq. ft.
1610 E 13th Street, Pueblo, CO 81001
MLS# 9165079Listed by: HOMESMART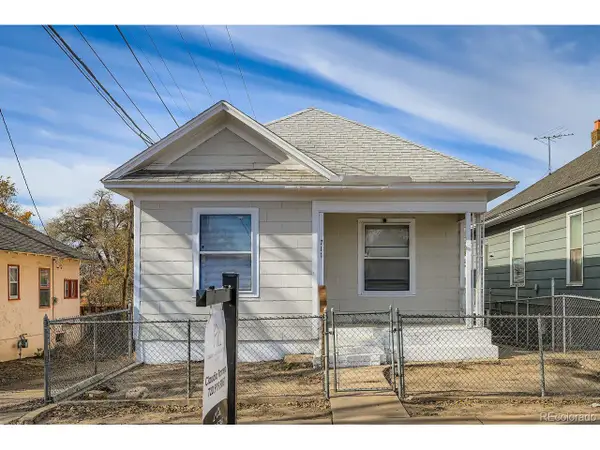 $255,000Active4 beds 2 baths1,616 sq. ft.
711 N Glendale Ave, Pueblo, CO 81001
MLS# 8598098Listed by: Megastar Realty $300,000Active7.52 Acres
2908 1/2 E 4th St, Pueblo, CO 81000
MLS# 235671Listed by: KELLER WILLIAMS PERFORMANCE REALTY $199,000Active3 beds 2 baths1,199 sq. ft.
1218 E 7th St, Pueblo, CO 81001
MLS# 235494Listed by: CORNERSTONE REAL ESTATE TEAM $179,000Active2 beds 1 baths1,204 sq. ft.
1026 E 9th St, Pueblo, CO 81001
MLS# 9463874Listed by: RE/MAX Associates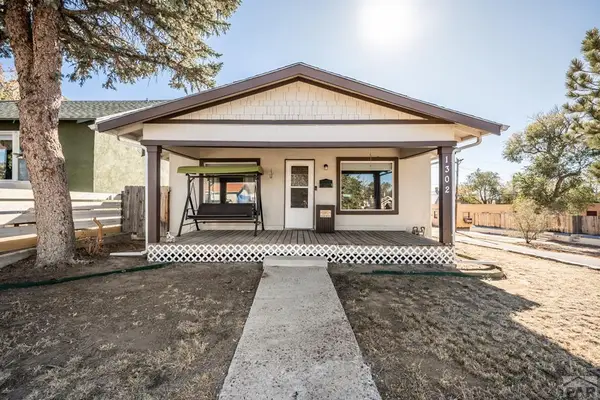 $205,000Active3 beds 1 baths1,046 sq. ft.
1302 E 10th St, Pueblo, CO 81001
MLS# 236778Listed by: KELLER WILLIAMS PERFORMANCE REALTY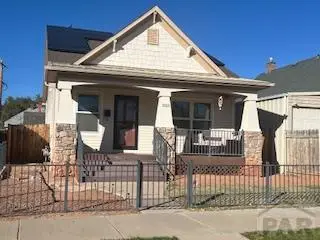 $219,900Active2 beds 1 baths966 sq. ft.
1015 E 7th St, Pueblo, CO 81001
MLS# 235427Listed by: RE/MAX OF PUEBLO INC $193,000Active4 beds 2 baths1,612 sq. ft.
908 E 9th St, Pueblo, CO 81001
MLS# 2071937Listed by: HomeSmart Preferred Realty $115,000Active2 beds 1 baths788 sq. ft.
912 E 6th Street, Pueblo, CO 81001
MLS# 9415154Listed by: EXP REALTY LLC $189,900Active2 beds 1 baths994 sq. ft.
1723 E 14th St, Pueblo, CO 81001
MLS# 235035Listed by: RE/MAX OF PUEBLO INC $210,000Pending3 beds 2 baths1,404 sq. ft.
1928 E 10th Street, Pueblo, CO 81001
MLS# 2591047Listed by: PAK HOME REALTY $205,000Active3 beds 2 baths1,050 sq. ft.
1221 Maudslay Ave, Pueblo, CO 81001
MLS# 234979Listed by: RE/MAX OF PUEBLO INC $239,900Active3 beds 1 baths950 sq. ft.
1506 N Ogden Ave, Pueblo, CO 81001
MLS# 5893608Listed by: The Block Inc $275,000Active4 beds 3 baths2,500 sq. ft.
1424 E 14th Street, Pueblo, CO 81001
MLS# 8991542Listed by: EXIT REALTY DTC, CHERRY CREEK, PIKES PEAK $215,000Active4 beds 2 baths1,505 sq. ft.
2018 E 16th St, Pueblo, CO 81001
MLS# 237229Listed by: RE/MAX OF PUEBLO INC $192,900Active3 beds 1 baths1,566 sq. ft.
1506 E 7th St, Pueblo, CO 81001
MLS# 234133Listed by: HOMESMART PREFERRED REALTY $29,000Active-- beds 1 baths764 sq. ft.
2008 E 10th St, Pueblo, CO 81001
MLS# 234076Listed by: RE/MAX ASSOCIATES $2,900,000Active48 beds 24 baths22,464 sq. ft.
2101-2111 N Queens Ave, Pueblo, CO 81001
MLS# 234031Listed by: CARLSSON REAL ESTATE, INC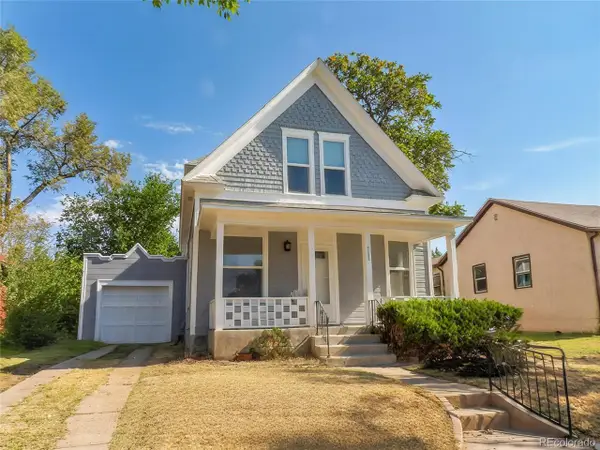 $199,900Active4 beds 1 baths1,120 sq. ft.
1505 E 6th St, Pueblo, CO 81001
MLS# 9235939Listed by: HomeSmart Preferred Realty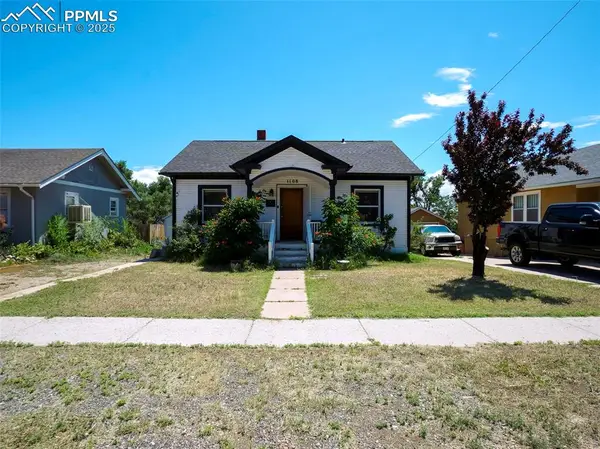 $129,000Pending2 beds 2 baths1,560 sq. ft.
1108 E 12th Street, Pueblo, CO 81001
MLS# 6993942Listed by: OLMSTED REALTY $144,900Active2 beds 1 baths746 sq. ft.
2114 E 12th St, Pueblo, CO 81001
MLS# 233629Listed by: KELLER WILLIAMS PERFORMANCE REALTY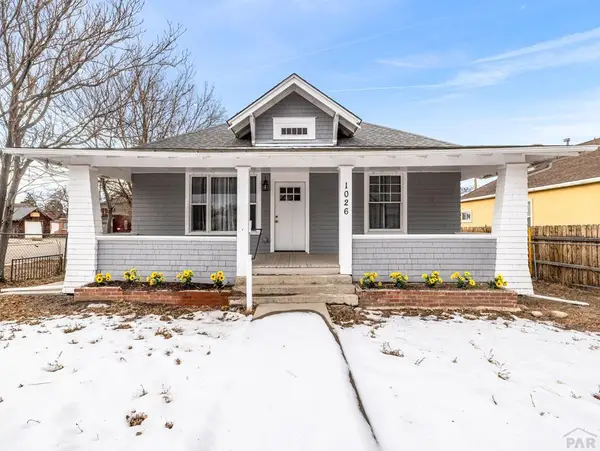 $179,000Active2 beds 1 baths1,204 sq. ft.
1026 E 9th St, Pueblo, CO 81001
MLS# 233615Listed by: RE/MAX ASSOCIATES $155,000Active3 beds 2 baths1,251 sq. ft.
1615 E 9th Street, Pueblo, CO 81001
MLS# 3644468Listed by: ABODE REAL ESTATE $195,000Pending3 beds 1 baths1,063 sq. ft.
1817 E 10th Street, Pueblo, CO 81001
MLS# 4520100Listed by: PAK HOME REALTY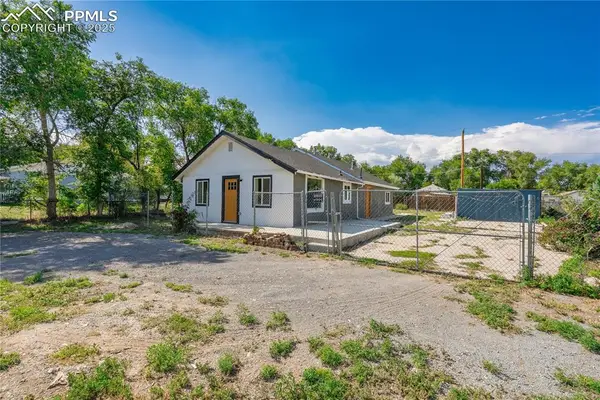 $299,900Active7 beds 4 baths1,446 sq. ft.
2027 E 14th Street, Pueblo, CO 81001
MLS# 2523437Listed by: VENTERRA REAL ESTATE LLC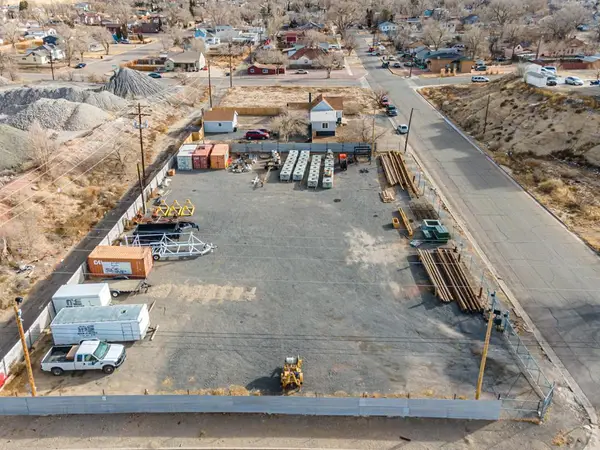 $100,000Active0.48 Acres
701 E 12th St, Pueblo, CO 81001
MLS# 238779Listed by: ROCKY MOUNTAIN REALTY $220,000Active5 beds 2 baths1,760 sq. ft.
1540 E 13th St, Pueblo, CO 81001
MLS# 232034Listed by: AKERS REALTY COMPANY LLC $225,000Pending3 beds 2 baths1,144 sq. ft.
1617 E 13th Street, Pueblo, CO 81001
MLS# 5673470Listed by: EXP REALTY LLC $199,000Active2 beds 1 baths731 sq. ft.
2006 E 14th Street, Pueblo, CO 81001
MLS# 8279403Listed by: KELLER WILLIAMS PERFORMANCE REALTY $159,900Pending3 beds 2 baths1,300 sq. ft.
1213 E 11th Street, Pueblo, CO 81001
MLS# 7633449Listed by: RE/MAX ASSOCIATES $220,000Active-- beds -- baths
1109 E 8th Street, Pueblo, CO 81001
MLS# 7367737Listed by: HOMESMART PREFERRED REALTY
Local realty services provided by:CENTURY 21 Top Dog Properties, CENTURY 21 Bear Facts Realty
The information being provided by Pikes Peak REALTOR® Services Corp. is for the consumer's personal, non-commercial use and may not be used for any purpose other than to identify prospective properties consumer may be interested in purchasing. Any information relating to real estate for sale referenced on this web site comes from the Internet Data Exchange (IDX) program of the Pikes Peak REALTOR® Services Corp.. CENTURY 21 Top Dog Properties is not a Multiple Listing Service (MLS), nor does it offer MLS access. This website is a service of CENTURY 21 Top Dog Properties, a broker participant of Pikes Peak REALTOR® Services Corp.. This web site may reference real estate listing(s) held by a brokerage firm other than the broker and/or agent who owns this web site.
The accuracy of all information, regardless of source, including but not limited to open house information, square footages and lot sizes, is deemed reliable but not guaranteed and should be personally verified through personal inspection by and/or with the appropriate professionals. The data contained herein is copyrighted by Pikes Peak REALTOR® Services Corp. and is protected by all applicable copyright laws. Any unauthorized dissemination of this information is in violation of copyright laws and is strictly prohibited.
The real estate listing information and related content displayed on this site is provided exclusively for consumers' personal, non-commercial use and may not be used for any purpose other than to identify prospective properties consumers may be interested in purchasing. This information and related content is deemed reliable but is not guaranteed accurate by the Pikes Peak REALTOR® Services Corp.
Copyright 2026 Pikes Peak REALTOR® Services Corp. All rights reserved.
All information deemed reliable but not guaranteed and should be independently verified. All properties are subject to prior sale, change or withdrawal. Neither listing broker(s) nor CENTURY 21 Top Dog Properties shall be responsible for any typographical errors, misinformation, misprints and shall be held totally harmless. Information being provided is for consumers' personal, non-commercial use and may not be used for any other purpose. The content relating to real estate for sale on this Web site comes in part from Pueblo Assocation of Realtors.
Based on information submitted to the MLS GRID as of March 19, 2026 09:45 PM. All data is obtained from various sources and may not have been verified by broker or MLS GRID. Supplied Open House information is subject to change without notice. All information should be independently reviewed and verified for accuracy. Properties may or may not be listed by the office/agent presenting the information.
The real estate listing information and related content displayed on this site is provided exclusively for consumer's personal, non-commercial use and may not be used for any purpose other than to identify prospective properties consumers may be interested in purchasing. This information and related content is deemed reliable but is not guaranteed accurate by Information and Real Estate Services, LLC.
Information source: Information and Real Estate Services, LLC. Provided for limited non-commercial use only under IRES Rules © Copyright IRES. The information being provided by Information and Real Estate Services is for the consumer's personal, non-commercial use and may not be used for any purpose other than to identify prospective properties consumer may be interested in purchasing. Any information relating to real estate for sale referenced on this web site comes from the Internet Data Exchange (IDX) program of the Information and Real Estate Services. This web site may reference real estate listing(s) held by a brokerage firm other than the broker and/or agent who owns this web site.
The accuracy of all information, regardless of source, including but not limited to open house information, square footages and lot sizes, is deemed reliable but not guaranteed and should be personally verified through personal inspection by and/or with the appropriate professionals. The data contained herein is copyrighted by Information and Real Estate Services and is protected by all applicable copyright laws. Any unauthorized dissemination of this information is in violation of copyright laws and is strictly prohibited.
Popular neighborhoods near East Side, Pueblo, CO
Zip codes near East Side, Pueblo, CO
- 80817 homes for sale
- 80911 homes for sale
- 80926 homes for sale
- 80928 homes for sale
- 81001 homes for sale
- 81003 homes for sale
- 81004 homes for sale
- 81005 homes for sale
- 81006 homes for sale
- 81007 homes for sale
- 81008 homes for sale
- 81019 homes for sale
- 81022 homes for sale
- 81023 homes for sale
- 81025 homes for sale
- 81062 homes for sale
- 81069 homes for sale
- 81226 homes for sale
- 81240 homes for sale
- 81253 homes for sale
Counties near East Side, Pueblo, CO
- Alamosa County homes for sale
- Arapahoe County homes for sale
- Bent County homes for sale
- Chaffee County homes for sale
- Costilla County homes for sale
- Crowley County homes for sale
- Custer County homes for sale
- Douglas County homes for sale
- El Paso County homes for sale
- Elbert County homes for sale
- Fremont County homes for sale
- Huerfano County homes for sale
- Jefferson County homes for sale
- Las Animas County homes for sale
- Lincoln County homes for sale
- Otero County homes for sale
- Park County homes for sale
- Pueblo County homes for sale
- Saguache County homes for sale
- Teller County homes for sale
Protect your home and budget from life's surprises with an Assurant Home Warranty, backed by a partner that supports you through every step of homeownership. Explore Plans.
©2026 Century 21 Real Estate LLC. All rights reserved. CENTURY 21®, the CENTURY 21 Logo and C21® are service marks owned by Century 21 Real Estate LLC. Century 21 Real Estate LLC fully supports the principles of the Fair Housing Act and the Equal Opportunity Act. Each office is independently owned and operated. Listing information is deemed reliable but not guaranteed accurate.