- Agua Dulce homes for sale
- Butterfield homes for sale
- Canutillo homes for sale
- Chaparral homes for sale
- Clint homes for sale
- El Paso homes for sale
- El Paso East homes for sale
- El Paso Northwest homes for sale
- Fabens homes for sale
- Homestead Meadows North homes for sale
- Homestead Meadows South homes for sale
- Horizon City homes for sale
- San Elizario homes for sale
- Santa Teresa homes for sale
- Socorro homes for sale
- Sparks homes for sale
- Sunland Park homes for sale
- Tornillo homes for sale
- Vinton homes for sale
- Westway homes for sale
79927, TX - homes for sale
210 of 210 results displayed
- New
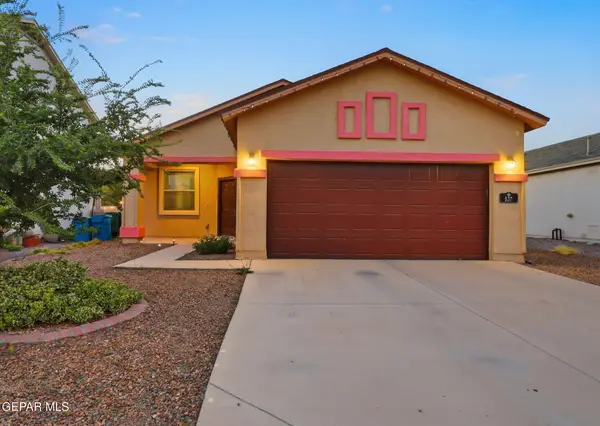
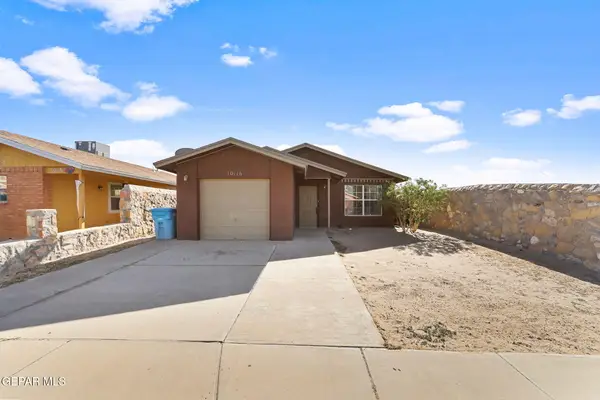
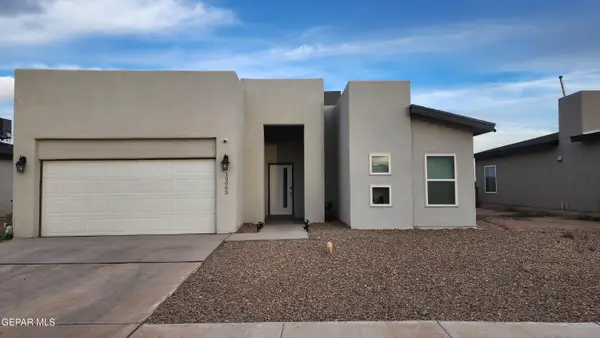
 $295,000Active4 beds 4 baths3,580 sq. ft.
10728 Regina Drive, Socorro, TX 79927
MLS# 941263Listed by: HOME PROS REAL ESTATE GROUP - New
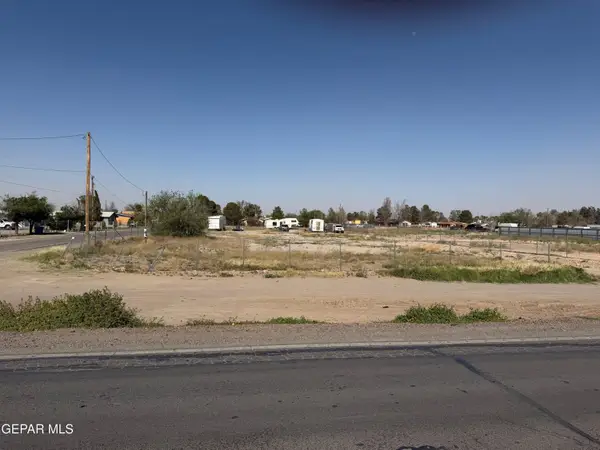 $290,000Active0.5 Acres
10811 Alameda Avenue, Socorro, TX 79927
MLS# 941257Listed by: REALTY ONE GROUP MENDEZ BURK - New
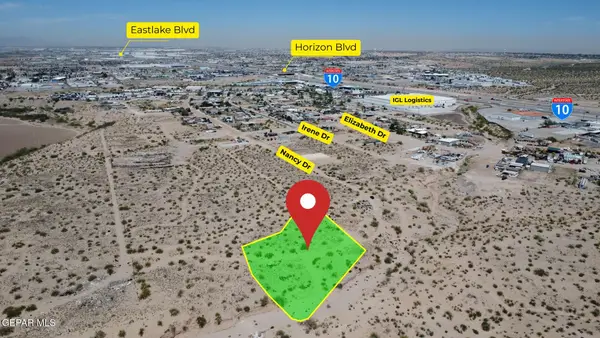 $45,000Active0.5 Acres
PN-270726 Panorama Village, El Paso, TX 79927
MLS# 941252Listed by: KELLER WILLIAMS REALTY - New
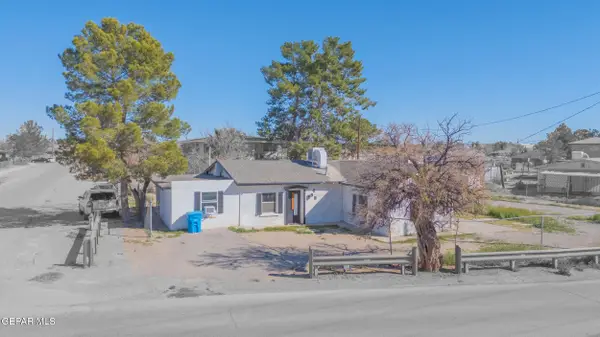 $199,950Active4 beds 2 baths1,412 sq. ft.
495 Buford Road, Socorro, TX 79927
MLS# 941255Listed by: REVOLVE REALTY, LLC - New
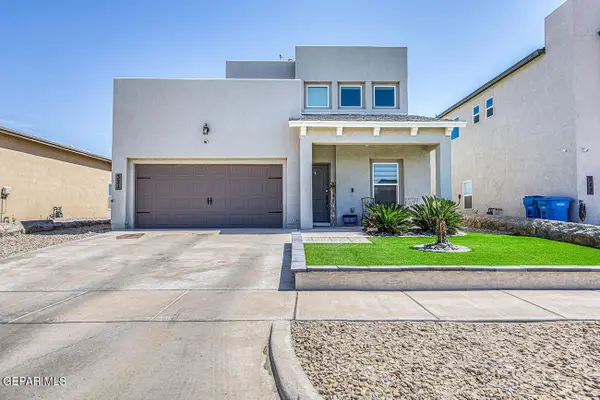 $309,950Active4 beds 3 baths2,450 sq. ft.
321 Fray Olguin Court, Socorro, TX 79927
MLS# 941195Listed by: DAN OLIVAS & ASSOCIATES - New
 $220,000Active3 beds 2 baths1,330 sq. ft.
537 Dusk View Street, Socorro, TX 79927
MLS# 941185Listed by: CLEARVIEW REALTY - New
 $333,950Active4 beds 3 baths2,142 sq. ft.
11872 Barrenkale Place, El Paso, TX 79934
MLS# 941142Listed by: BHGRE ELEVATE - New
 $298,950Active3 beds 2 baths1,723 sq. ft.
11844 Barrenkale Place, El Paso, TX 79934
MLS# 941136Listed by: BHGRE ELEVATE - New
 $296,950Active4 beds 3 baths1,788 sq. ft.
11852 Barrenkale Place, El Paso, TX 79934
MLS# 941138Listed by: BHGRE ELEVATE - New
 $285,950Active4 beds 2 baths1,635 sq. ft.
11864 Barrenkale Place, El Paso, TX 79934
MLS# 941141Listed by: BHGRE ELEVATE - New
 $329,950Active5 beds 3 baths2,526 sq. ft.
11505 Ellen Drive, Socorro, TX 79927
MLS# 941123Listed by: HOME PROS REAL ESTATE GROUP - New
 $130,000Active0.5 Acres
11740 Flor Del Rio Street, Socorro, TX 79927
MLS# 941090Listed by: CORNERSTONE REALTY - New
 $1,195,264Active0.98 Acres
820 Nuevo Hueco Tanks Road, El Paso, TX 79927
MLS# 941019Listed by: PRIORITY ONE PROPERTY MANAGEME - New
 $1,509,600Active1.08 Acres
825 Nuevo Hueco Tanks Road, Socorro, TX 79927
MLS# 941004Listed by: PRIORITY ONE PROPERTY MANAGEME - New
 $255,555Active3 beds 2 baths1,359 sq. ft.
11056 Gem Valley Road, Socorro, TX 79927
MLS# 940894Listed by: HOME PROS REAL ESTATE GROUP - New
 $179,999Active3 beds 3 baths1,076 sq. ft.
10116 Montreal Circle, Socorro, TX 79927
MLS# 940962Listed by: RE/MAX ASSOCIATES - New
 $214,999Active3 beds 2 baths1,308 sq. ft.
224 Flor Eucharis Drive, Socorro, TX 79927
MLS# 940943Listed by: CORNERSTONE REALTY - New
 $70,000Active0.22 Acres
665 Sudan Drive, Socorro, TX 79927
MLS# 940897Listed by: EXP REALTY LLC - New
 $260,000Active3 beds 2 baths1,709 sq. ft.
12061 Iron Hollow Street, Socorro, TX 79927
MLS# 940850Listed by: VAULT PROPERTY MANAGEMENT - New
 $248,900Active3 beds 2 baths1,469 sq. ft.
12053 Hidden Gardens Place, Socorro, TX 79927
MLS# 940874Listed by: SANDY MESSER AND ASSOCIATES - Open Sun, 5 to 7pmNew
 $220,000Active3 beds 2 baths1,691 sq. ft.
11513 Doris Road, Socorro, TX 79927
MLS# 940848Listed by: RE/MAX ASSOCIATES - New
 $295,000Active4 beds 2 baths1,623 sq. ft.
11720 Flor Preciosa, Socorro, TX 79927
MLS# 940734Listed by: 1ST CHOICE REALTY - New
 $189,900Active4 beds 2 baths1,327 sq. ft.
228 Caribe Circle, El Paso, TX 79927
MLS# 940719Listed by: THE REAL ESTATE POWER HOUSES 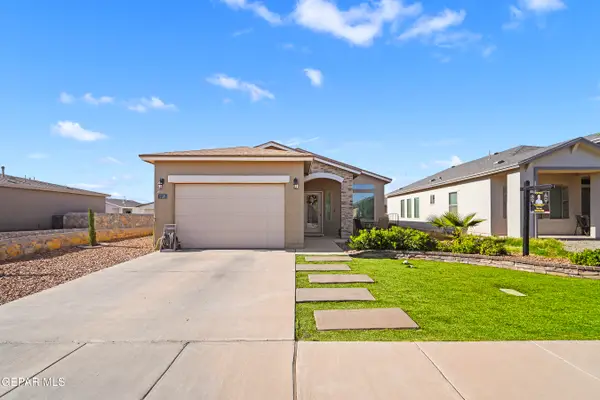 $229,400Pending3 beds 2 baths1,140 sq. ft.
2193 Yellow Valley Road, Socorro, TX 79927
MLS# 940595Listed by: SANDY MESSER AND ASSOCIATES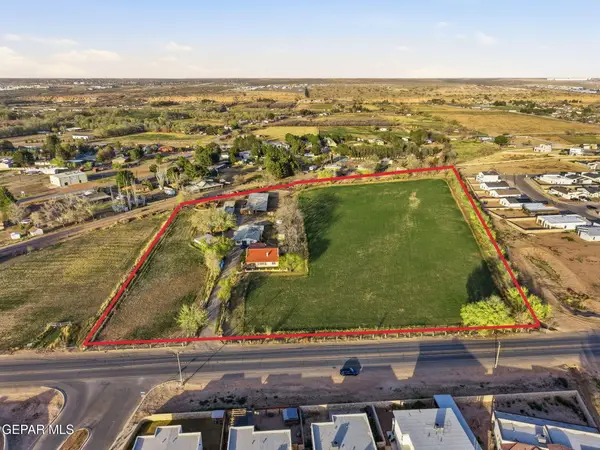 $1,200,000Active7.67 Acres
11897 N Loop Drive, Socorro, TX 79927
MLS# 940560Listed by: CLEARVIEW REALTY $182,500Pending3 beds 1 baths1,429 sq. ft.
9846 Gifford Drive, El Paso, TX 79927
MLS# 940518Listed by: MAJESTIC, REALTORS $240,000Active3 beds 2 baths2,734 sq. ft.
762 Delhi Drive, Socorro, TX 79927
MLS# 940526Listed by: CLEARVIEW REALTY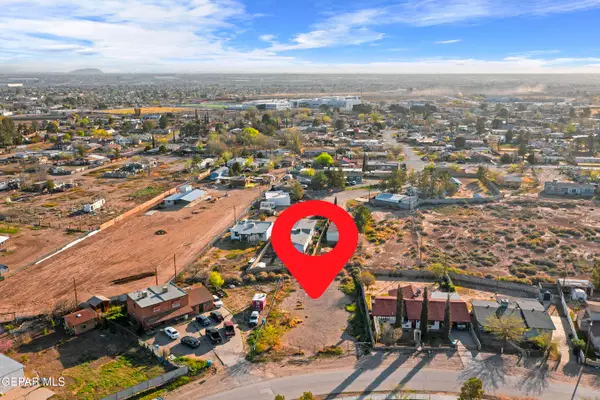 $100,000Active0.22 Acres
10213 Celedon Circle, Socorro, TX 79927
MLS# 940497Listed by: 24TH&HOME LLC $369,950Active4 beds 2 baths2,402 sq. ft.
10594 La Veranda Drive, Socorro, TX 79927
MLS# 940363Listed by: ERA SELLERS & BUYERS REAL ESTA $303,450Active4 beds 2 baths1,644 sq. ft.
9922 Marisabel Place, Socorro, TX 79927
MLS# 940360Listed by: EXP REALTY LLC $250,000Active3 beds 2 baths1,567 sq. ft.
560 Fray Olguin Court, Socorro, TX 79927
MLS# 940327Listed by: THE BROKER SPONSOR CORPORATION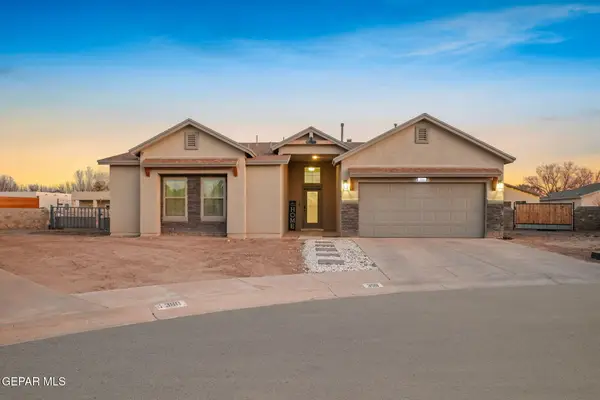 $284,950Active4 beds 2 baths1,794 sq. ft.
356 Plateau Drive, Socorro, TX 79927
MLS# 940268Listed by: REVOLVE REALTY, LLC $369,999Active4 beds 3 baths1,962 sq. ft.
12044 Hidden Garden Place, Socorro, TX 79927
MLS# 940234Listed by: BLISS HOME REALTY & RELOCATION GROUP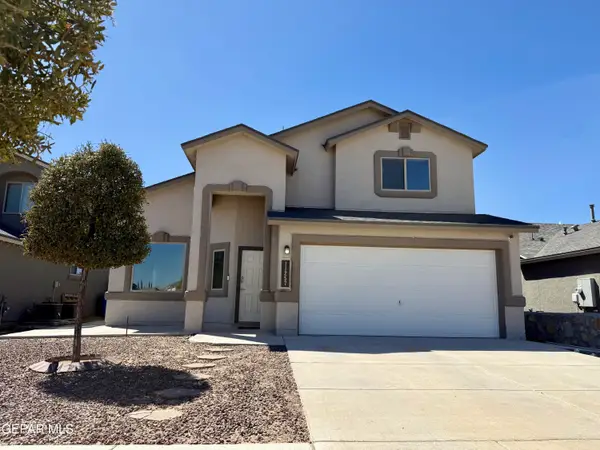
 $278,500Active4 beds 3 baths1,939 sq. ft.
11257 Cielo Mar Drive, Socorro, TX 79927
MLS# 940217Listed by: CENTURY 21 THE EDGE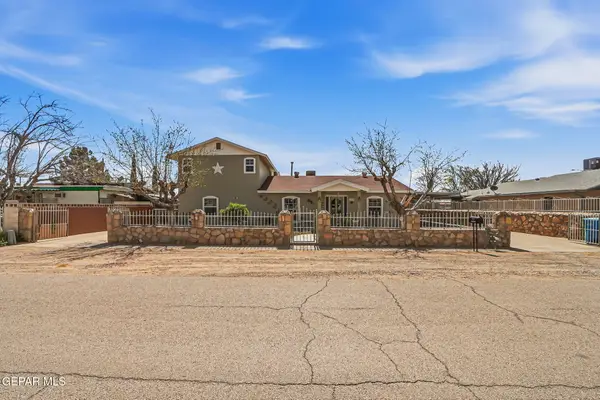 $250,000Active4 beds 3 baths2,150 sq. ft.
380 Innsbruck Avenue, Socorro, TX 79927
MLS# 940211Listed by: KELLER WILLIAMS REALTY $129,900Active0.89 Acres
681 Santa Gertrudes Drive, Socorro, TX 79927
MLS# 940139Listed by: KELLER WILLIAMS REALTY- Open Wed, 4 to 9pm
 $250,000Active5 beds 2 baths2,898 sq. ft.
10155 Aldrin Circle, Socorro, TX 79927
MLS# 940126Listed by: HOME PROS REAL ESTATE GROUP  $62,500Pending0.31 Acres
660 Stedham Circle, Socorro, TX 79927
MLS# 940129Listed by: HOME PROS REAL ESTATE GROUP $1,499,000Active5 beds 4 baths3,987 sq. ft.
636 Keagle Road, Socorro, TX 79927
MLS# 940093Listed by: BEST AGENTS REAL ESTATE CO LLC $12,000Active0.36 Acres
TBD Caribassett Drive Avenue, El Paso, TX 79928
MLS# 939961Listed by: SANDY MESSER AND ASSOCIATES $235,500Active4 beds 2 baths1,350 sq. ft.
440 Fray Olguin Court, Socorro, TX 79927
MLS# 940049Listed by: BUJANDA REAL ESTATE $310,000Active3 beds 3 baths2,410 sq. ft.
9872 Jericho Drive, El Paso, TX 79927
MLS# 940053Listed by: CLEARVIEW REALTY $4,247,000Active32.27 Acres
TBD N Moon Road, Socorro, TX 79927
MLS# 940022Listed by: GOLDEN REAL ESTATE $302,950Active4 beds 2 baths1,664 sq. ft.
9919 Marisabel Place, Socorro, TX 79927
MLS# 939858Listed by: EXIT ELITE REALTY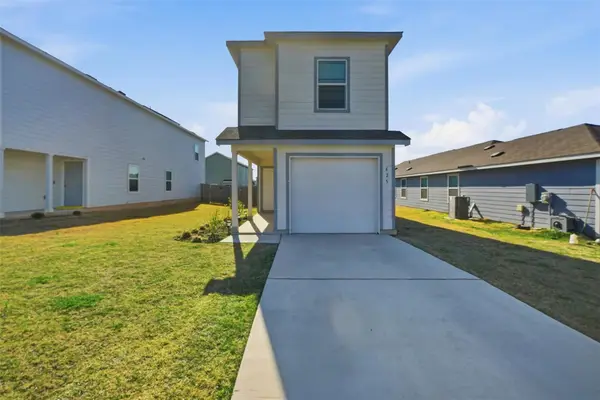 $206,000Active3 beds 3 baths1,287 sq. ft.
625 Marty Allen Loop, Jarrell, TX 76537
MLS# 1677172Listed by: EXP REALTY, LLC $105,000Active0.49 Acres
410 Valle Rojo Drive, Socorro, TX 79927
MLS# 939785Listed by: THE PURPLE HOUSE REAL ESTATE GROUP, LLC $351,950Active4 beds 3 baths2,044 sq. ft.
9909 Marisabel Place, Socorro, TX 79927
MLS# 939760Listed by: EXIT ELITE REALTY $99,000Active3 beds 1 baths1,198 sq. ft.
10184 Haynes Road, Socorro, TX 79927
MLS# 939652Listed by: KELLER WILLIAMS REALTY $195,000Active1.62 Acres
202 Passmore Road, Socorro, TX 79927
MLS# 939604Listed by: REALTY ONE GROUP MENDEZ BURK $239,950Pending5 beds 2 baths1,930 sq. ft.
351 Mosher Way, Socorro, TX 79927
MLS# 939500Listed by: HOME PROS REAL ESTATE GROUP $189,950Active4 beds 2 baths1,708 sq. ft.
445 Suzi Way, Socorro, TX 79927
MLS# 939487Listed by: HOME PROS REAL ESTATE GROUP $234,156Pending3 beds 2 baths1,648 sq. ft.
415 Valle Los Nogales Drive, Socorro, TX 79927
MLS# 21198099Listed by: MY CASTLE REALTY $100,000Active4.34 Acres
PN-270654 Tbd, Socorro, TX 79927
MLS# 939325Listed by: CLEARVIEW REALTY $124,750Active3 beds 1 baths1,440 sq. ft.
561 Buford Road, Socorro, TX 79927
MLS# 939314Listed by: HOME PROS REAL ESTATE GROUP $639,417Active16 Acres
PN-203375 Vineyard Rd, Socorro, TX 79927
MLS# 939318Listed by: CLEARVIEW REALTY $389,000Active3 beds 3 baths2,763 sq. ft.
687 Supima Drive, Socorro, TX 79927
MLS# 939167Listed by: SANDRA LUNA & ASSOCIATES $62,000Active0.21 Acres
11504 Nancy Drive, El Paso, TX 79927
MLS# 939287Listed by: CLEARVIEW REALTY $227,000Pending3 beds 2 baths1,439 sq. ft.
155 S Moon Road, Socorro, TX 79927
MLS# 939278Listed by: CENTURY 21 APD & ASSOCIATES $269,950Active3 beds 2 baths1,350 sq. ft.
9931 Edie Place, Socorro, TX 79927
MLS# 939201Listed by: TROPICANA REALTY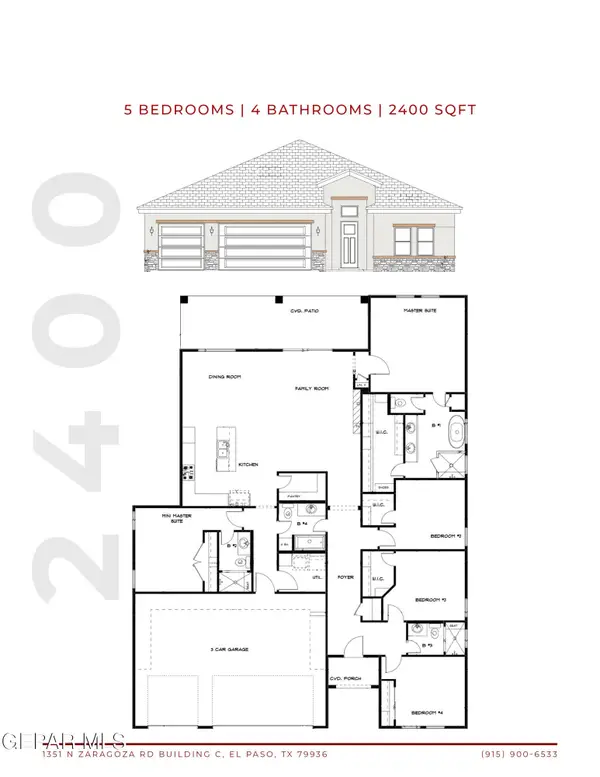 $575,000Active5 beds 4 baths2,400 sq. ft.
13208 Nacho Alvarado Drive, El Paso, TX 79927
MLS# 939184Listed by: MRG REALTY LLC $565,000Active5 beds 4 baths2,384 sq. ft.
13216 Nacho Alvarado Drive, El Paso, TX 79927
MLS# 939190Listed by: MRG REALTY LLC $283,000Active4 beds 2 baths1,946 sq. ft.
337 Fray Olguin Court, Socorro, TX 79927
MLS# 939155Listed by: SANDY MESSER AND ASSOCIATES $215,000Pending3 beds 2 baths1,150 sq. ft.
1093 Chris Forbes Circle, Socorro, TX 79927
MLS# 939083Listed by: REALTY ONE GROUP MENDEZ BURK $368,800Active3 beds 3 baths1,941 sq. ft.
12020 Hidden Gardens Place, Socorro, TX 79927
MLS# 939063Listed by: CLEARVIEW REALTY $369,950Active5 beds 3 baths2,240 sq. ft.
9911 Marisabel Place, Socorro, TX 79927
MLS# 939019Listed by: EXIT ELITE REALTY $244,000Active3 beds 2 baths1,363 sq. ft.
11352 Hidalgo Drive, Socorro, TX 79927
MLS# 938995Listed by: KELLER WILLIAMS REALTY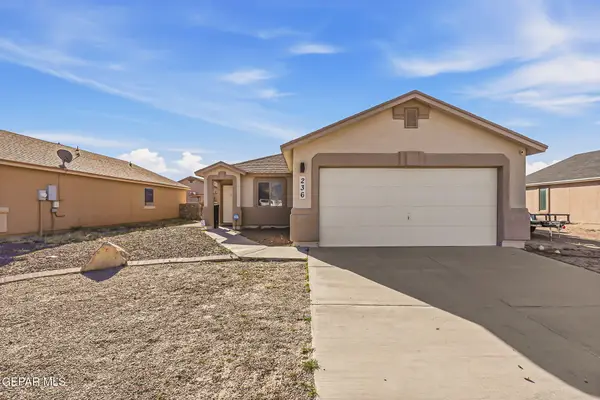 $199,999Pending3 beds 2 baths1,223 sq. ft.
236 Flor Azucena Drive, Socorro, TX 79927
MLS# 938970Listed by: EXP REALTY LLC $140,000Active5 beds 6 baths2,176 sq. ft.
924 Sheryl Circle, Socorro, TX 79927
MLS# 938925Listed by: HOME PROS REAL ESTATE GROUP $199,900Pending3 beds 2 baths1,584 sq. ft.
11640 Peters Road, Socorro, TX 79927
MLS# 938771Listed by: MEJORADO REALTY GROUP, INC. $249,000Pending5 beds 2 baths1,846 sq. ft.
10453 Valle Fertil Drive, Socorro, TX 79927
MLS# 938590Listed by: HOME PROS REAL ESTATE GROUP $334,950Active5 beds 4 baths2,664 sq. ft.
11361 Hidalgo Drive, Socorro, TX 79927
MLS# 938523Listed by: SANDY MESSER AND ASSOCIATES $132,000Pending3 beds 2 baths1,323 sq. ft.
10277 Valle Suave Drive, Socorro, TX 79927
MLS# 938431Listed by: ROMEWEST PROPERTIES $239,900Pending4 beds 3 baths1,729 sq. ft.
10093 Hueco Junction Road, Socorro, TX 79927
MLS# 938407Listed by: FUTURE CO., REALTORS $193,000Active3 beds 2 baths1,136 sq. ft.
11673 Flor Celosia, Socorro, TX 79927
MLS# 938399Listed by: HOME PROS REAL ESTATE GROUP $280,000Active4 beds 2 baths1,748 sq. ft.
11607 Valle Bonito Road, Socorro, TX 79927
MLS# 939006Listed by: THINK OF REALTY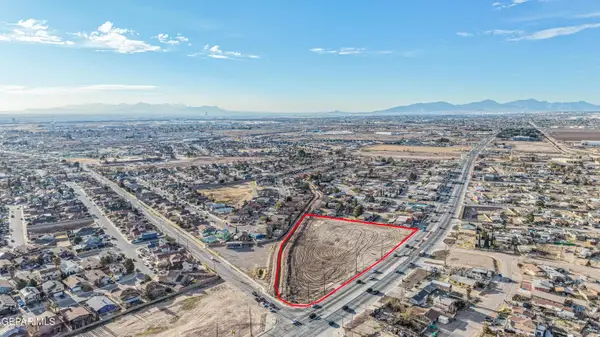 $2,800,000Active3.6 Acres
10220-232 N Loop Drive, Socorro, TX 79927
MLS# 938340Listed by: GOLDEN REAL ESTATE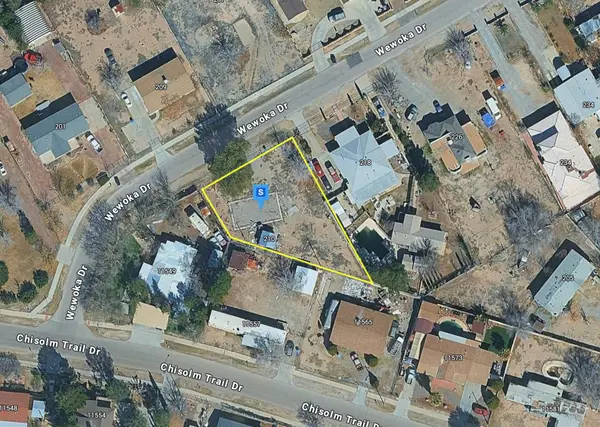 $74,999Active0.27 Acres
210 Wewoka Drive #A, Socorro, TX 79927
MLS# 21182503Listed by: PLATLABS, LLC $219,950Pending4 beds 2 baths1,350 sq. ft.
420 Gran Villa, Socorro, TX 79927
MLS# 938317Listed by: JPAR EP (869) $429,950Active5 beds 4 baths2,710 sq. ft.
9740 Calle Cancun Street, El Paso, TX 79927
MLS# 930074Listed by: MRG REALTY LLC $369,950Active4 beds 3 baths1,913 sq. ft.
9728 Calle Cancun Street, El Paso, TX 79927
MLS# 930077Listed by: MRG REALTY LLC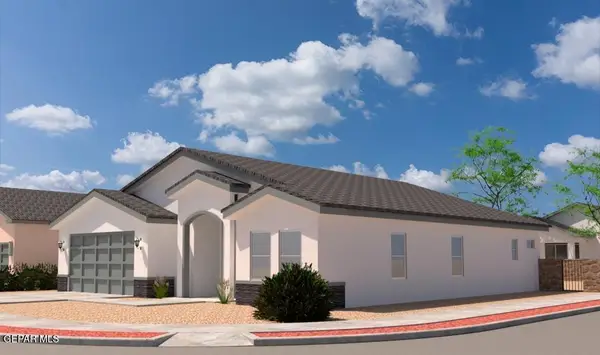 $379,950Active4 beds 3 baths2,107 sq. ft.
9732 Calle Cancun Street, El Paso, TX 79927
MLS# 938279Listed by: MRG REALTY LLC $439,950Active5 beds 4 baths2,800 sq. ft.
9736 Calle Cancun Street, El Paso, TX 79927
MLS# 938281Listed by: MRG REALTY LLC $379,950Active4 beds 3 baths2,107 sq. ft.
9744 Calle Cancun Street, El Paso, TX 79927
MLS# 938287Listed by: MRG REALTY LLC $439,950Active5 beds 4 baths2,800 sq. ft.
9748 Calle Cancun Street, El Paso, TX 79927
MLS# 938289Listed by: MRG REALTY LLC $379,950Active4 beds 3 baths2,107 sq. ft.
9720 Calle Cancun Street, El Paso, TX 79927
MLS# 930060Listed by: MRG REALTY LLC $369,950Active4 beds 3 baths1,913 sq. ft.
9716 Calle Cancun Street, El Paso, TX 79927
MLS# 930064Listed by: MRG REALTY LLC $439,950Active5 beds 4 baths2,800 sq. ft.
9724 Calle Cancun Street, El Paso, TX 79927
MLS# 938278Listed by: MRG REALTY LLC $439,950Active5 beds 4 baths2,800 sq. ft.
9712 Calle Cancun Street, El Paso, TX 79927
MLS# 930076Listed by: MRG REALTY LLC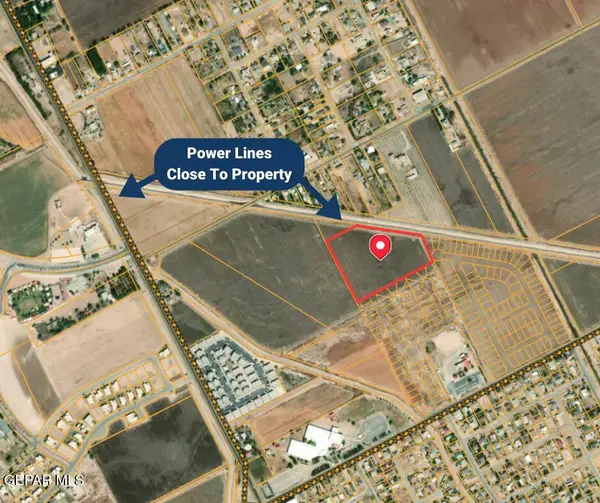 $238,603Pending8.56 Acres
PN-311665 13 Socorro Tr 19-a, Socorro, TX 79927
MLS# 938248Listed by: CLEARVIEW REALTY $381,146Pending13.67 Acres
PN-208192 26 Socorro Tr 1-a & Tr 1-b, Socorro, TX 79927
MLS# 938251Listed by: CLEARVIEW REALTY $379,950Active4 beds 3 baths2,107 sq. ft.
9708 Calle Cancun Street, El Paso, TX 79927
MLS# 930058Listed by: MRG REALTY LLC $232,000Active3 beds 3 baths1,871 sq. ft.
625 Harvest Grove Lane, Socorro, TX 79927
MLS# 938128Listed by: GUERRERO & ASSOCIATES- $199,999Pending3 beds 2 baths1,167 sq. ft.
803 Hc Gilbert Minjares Drive #B, Socorro, TX 79927
MLS# 938060Listed by: REVOLVE REALTY, LLC 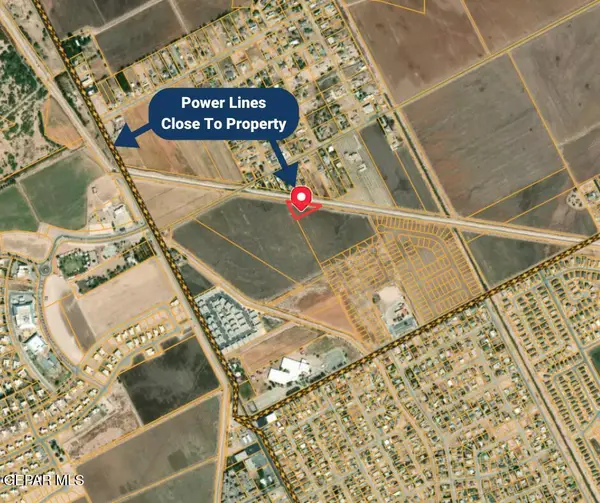 $23,140Pending0.83 Acres
PN-268834 13 Socorro Tr 18-b, Socorro, TX 79927
MLS# 938055Listed by: CLEARVIEW REALTY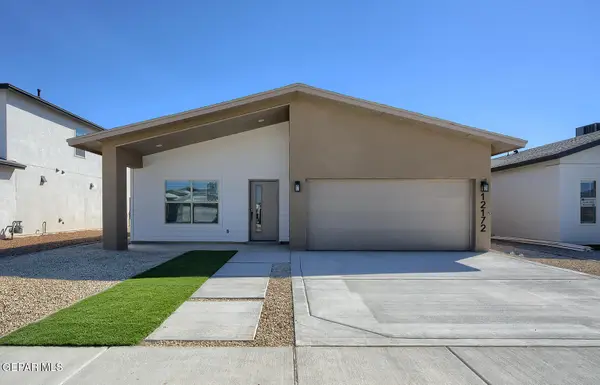 $304,950Active4 beds 2 baths1,644 sq. ft.
9915 Marisable Place, Socorro, TX 79927
MLS# 938033Listed by: EXIT ELITE REALTY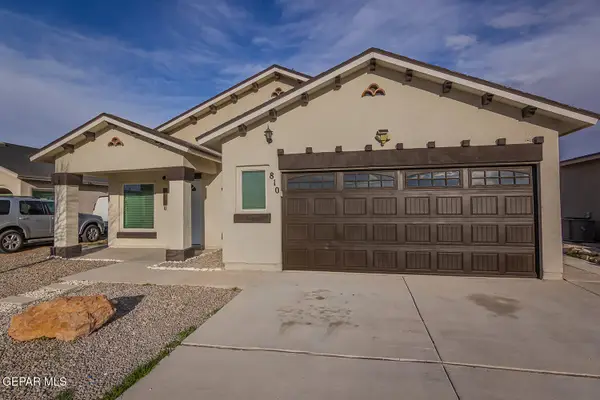 $195,900Pending4 beds 2 baths1,267 sq. ft.
810 Villas Del Sol Road, Socorro, TX 79927
MLS# 938025Listed by: BROKERS INC REAL ESTATE GROUP $180,000Active3 beds 1 baths988 sq. ft.
9700 Staubach Drive, El Paso, TX 79927
MLS# 937979Listed by: KELLER WILLIAMS REALTY $285,000Active4 beds 3 baths1,578 sq. ft.
401 Plateau Drive, Socorro, TX 79927
MLS# 937696Listed by: REVOLVE REALTY, LLC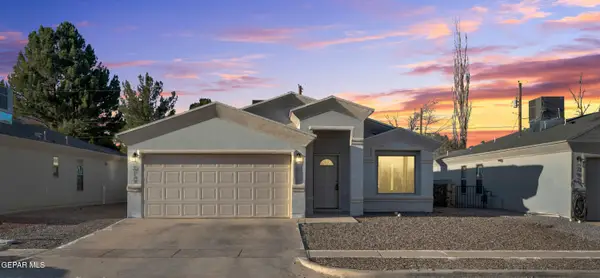 $234,999Active4 beds 2 baths1,504 sq. ft.
389 Plateau Drive, Socorro, TX 79927
MLS# 937624Listed by: CATALYST REAL ESTATE GROUP, EL PASO, LLC $308,950Active4 beds 3 baths1,700 sq. ft.
9917 Marisabel Place, Socorro, TX 79927
MLS# 937424Listed by: EXIT ELITE REALTY $215,000Pending4 beds 2 baths1,258 sq. ft.
11632 Flor Achillea, Socorro, TX 79927
MLS# 937426Listed by: CLEARVIEW REALTY $269,000Pending3 beds 2 baths1,691 sq. ft.
11965 Medalla Street, Socorro, TX 79927
MLS# 937320Listed by: THINK OF REALTY $140,000Pending4 beds 4 baths3,015 sq. ft.
625 Fray Vargas Road, Socorro, TX 79927
MLS# 937256Listed by: ERA SELLERS & BUYERS REAL ESTA $193,200Pending3 beds 2 baths1,121 sq. ft.
804 Hc Gilbert Minjares Drive #A, Socorro, TX 79927
MLS# 937229Listed by: REALTY ONE GROUP MENDEZ BURK $318,000Active5 beds 3 baths2,400 sq. ft.
270 Flor Amarilla Avenue, Socorro, TX 79927
MLS# 937182Listed by: MILLENNIUM 2000 REAL ESTATE SE $224,000Active3 beds 2 baths2,040 sq. ft.
9709 Vallarta Drive, El Paso, TX 79927
MLS# 937121Listed by: SANDRA LUNA & ASSOCIATES $254,900Active3 beds 2 baths1,491 sq. ft.
11425 Flor Liatris Drive, Socorro, TX 79927
MLS# 937115Listed by: RE/MAX ASSOCIATES $89,950Active0.34 Acres
10950 Alameda #j Avenue, Socorro, TX 79927
MLS# 937073Listed by: ERA SELLERS & BUYERS REAL ESTA $799,000Active5.13 Acres
PN312920 Place Road, Socorro, TX 79927
MLS# 936883Listed by: THE RIGHT MOVE REAL ESTATE GRO $325,000Active8 beds 4 baths3,710 sq. ft.
10540 Socorro Road, Socorro, TX 79927
MLS# 936753Listed by: THE REAL ESTATE POWER HOUSES $255,000Active4 beds 3 baths1,676 sq. ft.
429 Plateau Drive, Socorro, TX 79927
MLS# 936747Listed by: EL PASO TEAM RESULTS, PLLC $349,000Active4 beds 3 baths4,667 sq. ft.
11661 Socorro Road, Socorro, TX 79927
MLS# 936722Listed by: NEW BEGINNINGS REALTY-1964 $274,950Pending3 beds 2 baths1,509 sq. ft.
676 Artesano Road, Socorro, TX 79927
MLS# 936664Listed by: REVOLVE REALTY, LLC $1,330,000Pending5.29 Acres
1110 Robin Road, El Paso, TX 79927
MLS# 936453Listed by: TEAM JUAN URIBE $46,000Active0.18 Acres
32 Elizabeth Street, El Paso, TX 79927
MLS# 936427Listed by: KELLER WILLIAMS REALTY $385,950Pending4 beds 3 baths2,991 sq. ft.
9935 Rhiannon Place, Socorro, TX 79927
MLS# 936304Listed by: TROPICANA REALTY $229,000Pending3 beds 3 baths1,650 sq. ft.
11588 Flor Sereno Place, Socorro, TX 79927
MLS# 936163Listed by: GROW REAL ESTATE FIRM $314,950Active5 beds 3 baths2,485 sq. ft.
11365 Hidalgo Drive, Socorro, TX 79927
MLS# 936164Listed by: HOME PROS REAL ESTATE GROUP $100,000Pending4 beds 2 baths1,600 sq. ft.
11221 Nueva Mission Road, Socorro, TX 79927
MLS# 936120Listed by: HOME PROS REAL ESTATE GROUP $250,000Active4 beds 3 baths1,749 sq. ft.
11288 Santa Barbara, Socorro, TX 79927
MLS# 936079Listed by: DEW REAL ESTATE $209,000Active3 beds 3 baths1,508 sq. ft.
801 Hc Gillbert Minjares Drive #B, El Paso, TX 79927
MLS# 936033Listed by: TEXAS ALLY REAL ESTATE GROUP $284,999Active4 beds 2 baths1,740 sq. ft.
12033 Hidden Gardens Place, Socorro, TX 79927
MLS# 935743Listed by: REVOLVE REALTY, LLC $257,900Active3 beds 2 baths1,392 sq. ft.
434 Sylvia Court, El Paso, TX 79927
MLS# 935449Listed by: REVOLVE REALTY, LLC $250,000Active3 beds 2 baths1,369 sq. ft.
438 Sylvia Court, El Paso, TX 79927
MLS# 935450Listed by: REVOLVE REALTY, LLC $95,000Pending0.54 Acres
700 Rosa Blanca Drive, Socorro, TX 79927
MLS# 935410Listed by: REVOLVE REALTY, LLC $189,500Active3 beds 1 baths1,112 sq. ft.
9836 Isaac Drive, El Paso, TX 79927
MLS# 935379Listed by: MAJESTIC, REALTORS $299,950Active4 beds 3 baths2,322 sq. ft.
2041 Blue Valley Avenue, Socorro, TX 79927
MLS# 935315Listed by: CLEARVIEW REALTY $174,950Active3 beds 2 baths1,664 sq. ft.
11423 Philip Drive, Socorro, TX 79927
MLS# 935294Listed by: HOME PROS REAL ESTATE GROUP $120,000Active4 beds 2 baths2,887 sq. ft.
627 Milo Drive, El Paso, TX 79927
MLS# 935236Listed by: RODEO REALTY $395,500Pending6 beds 3 baths2,323 sq. ft.
10736 Donna Marie Drive, Socorro, TX 79927
MLS# 934982Listed by: NXT LEVEL REAL ESTATE $350,000Active2.56 Acres
PN-29466 Southside Road, El Paso, TX 79927
MLS# 934973Listed by: CLEARVIEW REALTY $345,000Active4 beds 2 baths1,900 sq. ft.
416 Plateau Drive, Socorro, TX 79927
MLS# 934843Listed by: THE RIGHT MOVE REAL ESTATE GRO $225,000Active3 beds 2 baths1,308 sq. ft.
11128 Ida Coldwell Lane, El Paso, TX 79927
MLS# 934685Listed by: GROW REAL ESTATE FIRM $220,000Pending3 beds 3 baths2,006 sq. ft.
10474 Bain Place, Socorro, TX 79927
MLS# 932795Listed by: WINTERBERG REALTY $308,950Pending4 beds 3 baths1,700 sq. ft.
9924 Marisabel Place, Socorro, TX 79927
MLS# 934441Listed by: EXIT ELITE REALTY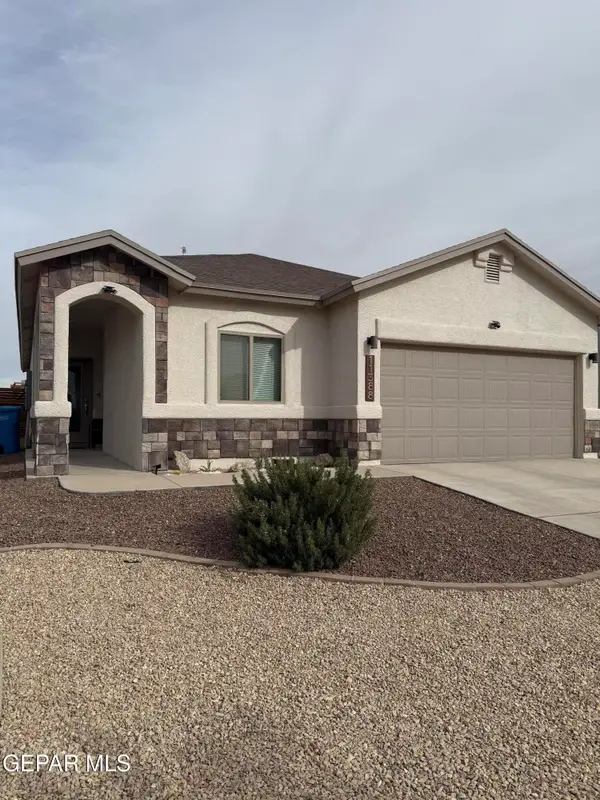 $252,900Active3 beds 2 baths1,507 sq. ft.
11388 Santa Barbara, Socorro, TX 79927
MLS# 933977Listed by: NEW BEGINNINGS REALTY-1964 $215,000Active3 beds 2 baths1,408 sq. ft.
9513 Martinique Drive, El Paso, TX 79927
MLS# 933934Listed by: INVESTORS - B. HADDAD & ASSOCI $220,950Pending4 beds 3 baths1,496 sq. ft.
11132 Catherine Slutter Lane, El Paso, TX 79927
MLS# 933837Listed by: LEON REALTY GROUP, LLC $380,000Active8 beds 6 baths2,862 sq. ft.
421 Panahi Road, Socorro, TX 79927
MLS# 933660Listed by: LEON REALTY GROUP, LLC $232,000Pending3 beds 3 baths1,759 sq. ft.
11420 Doris Road, Socorro, TX 79927
MLS# 933697Listed by: CLEARVIEW REALTY $230,000Pending-- beds -- baths1,608 sq. ft.
10530 Fuente Street, Socorro, TX 79927
MLS# 924899Listed by: RE/MAX ASSOCIATES $219,999Active4 beds 2 baths1,397 sq. ft.
416 Fray Olguin Court, Socorro, TX 79927
MLS# 933530Listed by: CORNERSTONE REALTY $64,995Active0.44 Acres
26 Trans Park Drive, El Paso, TX 79927
MLS# 933482Listed by: REALTY ONE GROUP MENDEZ BURK $45,000Active0.27 Acres
PN-224306 Tbd, El Paso, TX 79928
MLS# 933448Listed by: CLEARVIEW REALTY $329,950Active4 beds 3 baths2,000 sq. ft.
10188 Konya Place, Socorro, TX 79927
MLS# 933304Listed by: ERA SELLERS & BUYERS REAL ESTA $155,000Pending4 beds 2 baths1,150 sq. ft.
9979 Morocco Circle, Socorro, TX 79927
MLS# 932946Listed by: HOME PROS REAL ESTATE GROUP $8,500Active0.16 Acres
TBD 14 Rainbow Garden, Lot 26, El Paso, TX 79928
MLS# 932906Listed by: CORNERSTONE REALTY $8,500Active0.16 Acres
TBD 14 Rainbow Garden, Lot 25, El Paso, TX 79928
MLS# 932911Listed by: CORNERSTONE REALTY $8,500Active0.16 Acres
TBD 14 Rainbow Garden, Lot 24, El Paso, TX 79928
MLS# 932913Listed by: CORNERSTONE REALTY $293,950Active3 beds 3 baths1,783 sq. ft.
9947 Marie Ann Place, Socorro, TX 79927
MLS# 932860Listed by: TROPICANA REALTY $300,000Active4 beds 4 baths3,580 sq. ft.
10728 Regina Drive, Socorro, TX 79927
MLS# 932353Listed by: HOME PROS REAL ESTATE GROUP $189,900Pending3 beds 2 baths1,323 sq. ft.
10277 Valle Suave Drive, Socorro, TX 79927
MLS# 932350Listed by: ERA SELLERS & BUYERS REAL ESTA $399,950Pending4 beds 4 baths2,274 sq. ft.
10823 Patti Jo Drive, Socorro, TX 79927
MLS# 932111Listed by: ERA SELLERS & BUYERS REAL ESTA $315,000Active3 beds 2 baths1,502 sq. ft.
9928 Marisabel Place, Socorro, TX 79927
MLS# 931924Listed by: HOME PROS REAL ESTATE GROUP $299,000Active3 beds 2 baths1,993 sq. ft.
10719 Alameda Avenue, Socorro, TX 79927
MLS# 931892Listed by: KASASHOMES REAL ESTATE LLC $99,000Active3 beds 2 baths1,440 sq. ft.
9991 Melissa Circle, Socorro, TX 79927
MLS# 931848Listed by: REALTY ONE GROUP MENDEZ BURK $250,000Pending5 beds 3 baths2,048 sq. ft.
10400 Mackenzie Ann Place, Socorro, TX 79927
MLS# 931409Listed by: KELLER WILLIAMS REALTY $109,950Active2 beds 2 baths2,106 sq. ft.
169 Escudo Road, El Paso, TX 79927
MLS# 931345Listed by: CROWNED EAGLE REALTY $180,000Pending4 beds 2 baths1,328 sq. ft.
10424 Valle De Oro Drive, Socorro, TX 79927
MLS# 931282Listed by: KELLER WILLIAMS REALTY $241,500Active3 beds 2 baths1,536 sq. ft.
11600 Leonor Duran Street, Socorro, TX 79927
MLS# 931236Listed by: CENTURY 21 THE EDGE $230,000Active4 beds 4 baths3,420 sq. ft.
11500 La Poblana Drive, Socorro, TX 79927
MLS# 930801Listed by: CLEARVIEW REALTY $234,950Active4 beds 2 baths1,501 sq. ft.
11511 Leonor Duran Street, El Paso, TX 79927
MLS# 930669Listed by: GROW REAL ESTATE FIRM $293,950Active4 beds 3 baths1,645 sq. ft.
9931 Rhiannon Place, Socorro, TX 79927
MLS# 930664Listed by: TROPICANA REALTY $15,000Pending0.68 Acres
TBD Pid 315222, 308699, El Paso, TX 79928
MLS# 930394Listed by: THE WILLIAMS ADVANCED REALTY TEAM (THE WAR TEAM) $454,490Pending4 beds 3 baths2,398 sq. ft.
3804 Fix Place, El Paso, TX 79938
MLS# 930330Listed by: CLEARVIEW REALTY $339,950Active3 beds 3 baths1,968 sq. ft.
1031 Sidonia Place, Socorro, TX 79927
MLS# 930050Listed by: EXIT ELITE REALTY $1,250,000Active5 beds 7 baths9,871 sq. ft.
11 Via Placita, El Paso, TX 79927
MLS# 930022Listed by: CLEARVIEW REALTY $279,999Active3 beds 2 baths1,807 sq. ft.
9853 La Morenita Circle, El Paso, TX 79927
MLS# 930024Listed by: MRG REALTY LLC $208,000Pending3 beds 2 baths1,499 sq. ft.
10488 Ethyl Hart Street, Socorro, TX 79927
MLS# 929773Listed by: EL PASO HOMES REALTY $295,500Active4 beds 3 baths2,300 sq. ft.
503 Dusk View Street, Socorro, TX 79927
MLS# 929373Listed by: HOME PROS REAL ESTATE GROUP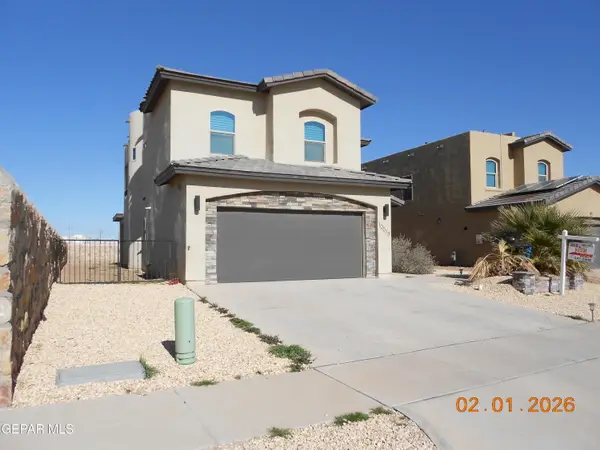 $330,000Active4 beds 3 baths2,379 sq. ft.
10013 Hueco Junction Road, Socorro, TX 79927
MLS# 936705Listed by: HIGH DESERT REALTY $255,000Pending3 beds 2 baths1,760 sq. ft.
912 Jimson Weed Drive, Socorro, TX 79927
MLS# 929227Listed by: CLEARVIEW REALTY $35,000Active0.27 Acres
TBD Janis Drive, El Paso, TX 79927
MLS# 929034Listed by: ERA SELLERS & BUYERS REAL ESTA $200,000Pending3 beds 2 baths1,121 sq. ft.
9996 Laurie Jo Lane, El Paso, TX 79927
MLS# 927956Listed by: GUERRERO & ASSOCIATES $140,000Active0.96 Acres
TBD Dindinger Road, Socorro, TX 79927
MLS# 927485Listed by: REALTY ONE GROUP MENDEZ BURK $227,750Pending4 beds 2 baths1,805 sq. ft.
361 Mercy Tellez, Socorro, TX 79927
MLS# 926887Listed by: ROMEWEST PROPERTIES $249,900Active4 beds 3 baths1,962 sq. ft.
9813 La Morenita Circle, El Paso, TX 79927
MLS# 939499Listed by: NORTH-AMERICAN REALTY $344,950Active4 beds 2 baths2,044 sq. ft.
9913 Marisabel, Socorro, TX 79927
MLS# 928820Listed by: EXIT ELITE REALTY $1,200,000Active5 Acres
10696 Stockyard Drive, Socorro, TX 79927
MLS# 923625Listed by: KELLER WILLIAMS REALTY $325,000Active3 beds 2 baths1,750 sq. ft.
12036 Cotton Cloud Way, Socorro, TX 79927
MLS# 923218Listed by: HOME PROS REAL ESTATE GROUP $310,000Active2.4 Acres
10719 Horn Circle, Socorro, TX 79927
MLS# 923063Listed by: TEAM JUAN URIBE $220,000Active0.51 Acres
331 Valle Lindo Drive, Socorro, TX 79927
MLS# 922994Listed by: REVOLVE REALTY, LLC $248,400Active4 beds 3 baths1,744 sq. ft.
10325 Valle Suave Drive, Socorro, TX 79927
MLS# 934122Listed by: JPAR $255,000Pending4 beds 2 baths1,450 sq. ft.
609 Harvest Grove Lane, Socorro, TX 79927
MLS# 921496Listed by: ERA SELLERS & BUYERS REAL ESTA $255,000Pending4 beds 2 baths1,450 sq. ft.
601 Harvest Grove Lane, Socorro, TX 79927
MLS# 935874Listed by: ERA SELLERS & BUYERS REAL ESTA $440,950Active5 beds 4 baths3,138 sq. ft.
985 Barbara Avenue, Socorro, TX 79927
MLS# 921163Listed by: TROPICANA REALTY $257,450Pending3 beds 3 baths1,465 sq. ft.
462 Sylvia Court, Socorro, TX 79927
MLS# 917820Listed by: THE RIGHT MOVE REAL ESTATE GRO $249,500Active2.5 Acres
10730 Regina Drive, Socorro, TX 79927
MLS# 920859Listed by: OPEN DOOR ASSETS $330,000Active5 beds 4 baths2,822 sq. ft.
352 Mercy Tellez Court, El Paso, TX 79927
MLS# 920547Listed by: KELLER WILLIAMS REALTY $290,500Active3 beds 2 baths1,660 sq. ft.
442 Sylvia Court, Socorro, TX 79927
MLS# 920433Listed by: EL PASO HOMES REALTY $79,385Pending0.24 Acres
367 Hodaka Way, Socorro, TX 79927
MLS# 919133Listed by: RE/MAX ASSOCIATES $2,300,000Active8.82 Acres
11690 North Loop Drive, Socorro, TX 79927
MLS# 918891Listed by: CLEARVIEW REALTY $269,950Pending3 beds 3 baths1,350 sq. ft.
12312 Jack Vowell Way, El Paso, TX 79934
MLS# 918426Listed by: ERA SELLERS & BUYERS REAL ESTA $95,000Active0.5 Acres
615 Fray Varga Road, Socorro, TX 79927
MLS# 918229Listed by: REALTY ONE GROUP MENDEZ BURK $339,950Pending4 beds 3 baths2,044 sq. ft.
996 Barbara, Socorro, TX 79927
MLS# 918199Listed by: EXIT ELITE REALTY- Open Thu, 5pm to 12am
 $295,950Active3 beds 2 baths1,575 sq. ft.
11468 Park Lane, Socorro, TX 79927
MLS# 928546Listed by: HOME PROS REAL ESTATE GROUP  $22,812,372Active52.37 Acres
TBD E Gateway Blvd, El Paso, TX 79927
MLS# 928341Listed by: ALPHA OMEGA REAL ESTATE GROUP LLC $163,000Pending3 beds 2 baths1,627 sq. ft.
10282 Pritam Drive, Socorro, TX 79927
MLS# 916341Listed by: VISION REALTY $275,000Pending4 beds 4 baths1,989 sq. ft.
10752 Mellward Road, Socorro, TX 79927
MLS# 936181Listed by: CENTER REAL ESTATE $1,428,900Pending1.09 Acres
9901 N Loop Drive, Socorro, TX 79927
MLS# 914463Listed by: TEAM JUAN URIBE $3,500Active9.33 Acres
12660 E Gateway Boulevard, El Paso, TX 79938
MLS# 912304Listed by: RES COMM REAL ESTATE $125,000Active3.5 Acres
995 Anderson Road, Socorro, TX 79927
MLS# 911918Listed by: TEAM JUAN URIBE $859,888Active5 beds 7 baths4,699 sq. ft.
18 Via Placita, El Paso, TX 79927
MLS# 911351Listed by: PPR-REAL ESTATE INVESTMENT SER $15,000Active0.32 Acres
TBD 20 Sunland Estates #7, Horizon City, TX 79928
MLS# 910098Listed by: HOME PROS REAL ESTATE GROUP $350,950Active4 beds 3 baths2,336 sq. ft.
9927 Marie Ann Place, Socorro, TX 79927
MLS# 922539Listed by: TROPICANA REALTY $239,950Pending4 beds 2 baths1,450 sq. ft.
12037 Iron Hollow Street, Socorro, TX 79927
MLS# 904465Listed by: KELLER WILLIAMS REALTY $369,000Active5 beds 3 baths3,181 sq. ft.
200 Saul Court, El Paso, TX 79927
MLS# 904416Listed by: SANDRA LUNA & ASSOCIATES $22,500Active0.19 Acres
11908 Michael Drive, El Paso, TX 79927
MLS# 831317Listed by: NEW BEGINNINGS REALTY-1964 $170,000Active3 beds 3 baths1,720 sq. ft.
9862 Lilly Drive, Socorro, TX 79927
MLS# 855799Listed by: NEW BEGINNINGS REALTY-1964 $20,000Active0.15 Acres
713 Corrine Drive, El Paso, TX 79927
MLS# 874041Listed by: NEW BEGINNINGS REALTY-1964
Local realty services provided by:CENTURY 21 APD Associates, CENTURY 21 North East, CENTURY 21 Elite
Information provided, in part, by North Texas Real Estate Information Systems, Inc. Last Updated March 31, 2026 Listings with the NTREIS logo are listed by brokerages other than CENTURY 21 Elite.
Popular searches near 79927
Popular neighborhoods near 79927
- Americas, El Paso homes for sale
- Capistrano Park, El Paso homes for sale
- Las Palmas, El Paso homes for sale
- Lomaland, El Paso homes for sale
- Marty Robbins North, El Paso homes for sale
- Marty Robbins South, El Paso homes for sale
- Mesa Vista, El Paso homes for sale
- Mission Valley, El Paso homes for sale
- Paseos Del Sol, El Paso homes for sale
- Pelican Grove, El Paso homes for sale
- Penrose, El Paso homes for sale
- Pleasant Valley, El Paso homes for sale
- Prado, El Paso homes for sale
- Pueblos Viejos, El Paso homes for sale
- Ranchos Del Sol, El Paso homes for sale
- Saint Vitus, El Paso homes for sale
- Santa Lucia, El Paso homes for sale
- Shawver Park, El Paso homes for sale
- Thomas Manor, El Paso homes for sale
- Ysleta, El Paso homes for sale
Protect your home and budget from life's surprises with an Assurant Home Warranty, backed by a partner that supports you through every step of homeownership. Explore Plans.
©2026 Century 21 Real Estate LLC. All rights reserved. CENTURY 21®, the CENTURY 21 Logo and C21® are service marks owned by Century 21 Real Estate LLC. Century 21 Real Estate LLC fully supports the principles of the Fair Housing Act and the Equal Opportunity Act. Each office is independently owned and operated. Listing information is deemed reliable but not guaranteed accurate.