- Alamo Placita, Denver homes for sale
- Baker, Denver homes for sale
- Broadway Terrace, Denver homes for sale
- Byers, Denver homes for sale
- Capitol Hill, Denver homes for sale
- Central Business District, Denver homes for sale
- Cheesman Park, Denver homes for sale
- Country Club, Denver homes for sale
- Golden Triangle, Denver homes for sale
- Governor's Park, Denver homes for sale
- Hunts, Denver homes for sale
- Kettles, Denver homes for sale
- Lincoln Park, Denver homes for sale
- North Capitol Hill, Denver homes for sale
- North Country Club, Denver homes for sale
- Shackelton Place, Denver homes for sale
- Speer, Denver homes for sale
- Summer's, Denver homes for sale
- Upper Downtown, Denver homes for sale
- Valverde, Denver homes for sale
Elmwood, Denver, CO - homes for sale
19 of 19 results displayed
- New
 $850,000Active2 beds 2 baths1,743 sq. ft.
710 Fox St, Denver, CO 80204
MLS# 1673260Listed by: Ed Prather Real Estate 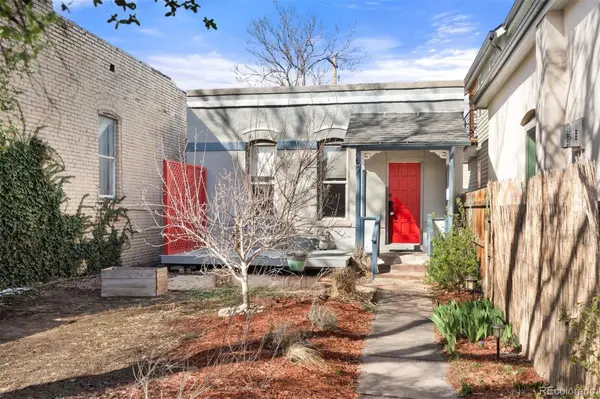 $400,000Active1 beds 1 baths1,068 sq. ft.
667 Elati Street, Denver, CO 80204
MLS# 7645701Listed by: LIV SOTHEBY'S INTERNATIONAL REALTY
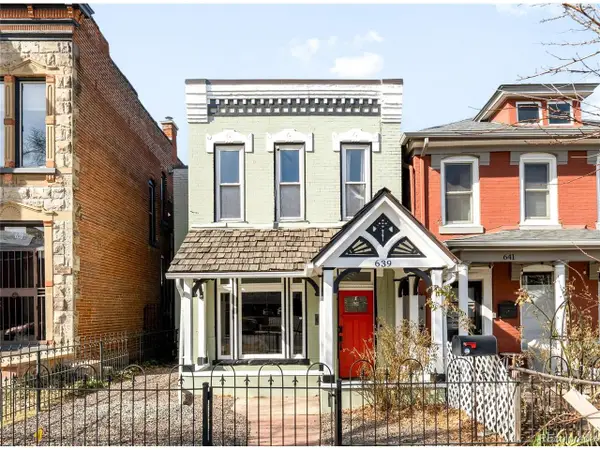 $875,000Active3 beds 2 baths1,696 sq. ft.
639 Galapago St, Denver, CO 80204
MLS# 8497737Listed by: Milehimodern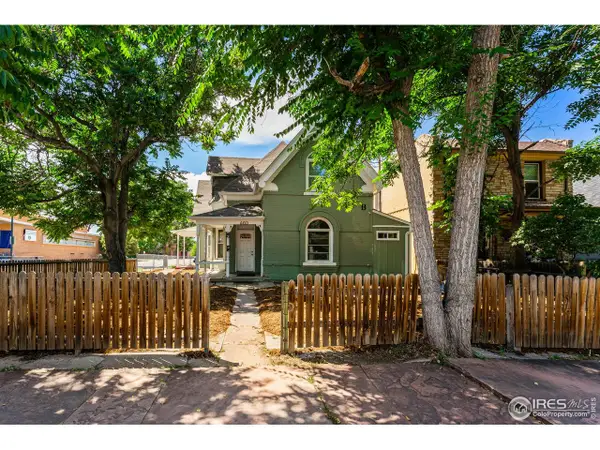 $800,000Active-- beds 4 baths2,787 sq. ft.
603 Elati St, Denver, CO 80204
MLS# 5473892Listed by: Compass - Denver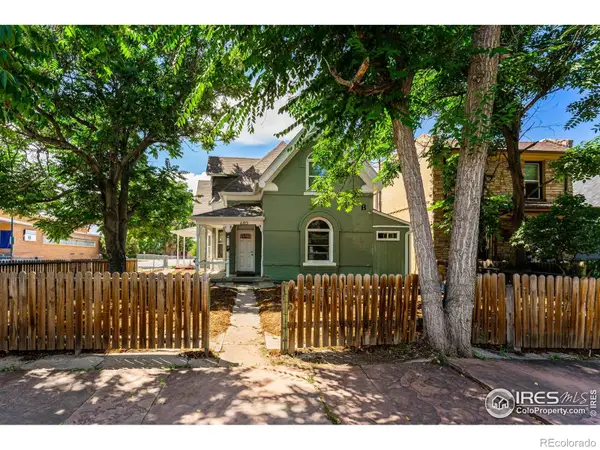 $800,000Active4 beds 4 baths5,166 sq. ft.
603 Elati Street, Denver, CO 80204
MLS# IR1051367Listed by: COMPASS-DENVER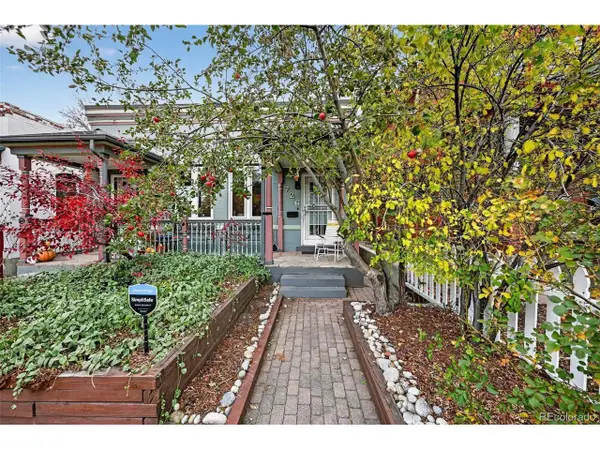 $465,000Active1 beds 2 baths943 sq. ft.
726 Fox St, Denver, CO 80204
MLS# 7945279Listed by: Trelora Realty, Inc. $159,900Active-- beds 1 baths331 sq. ft.
603 Inca Street #516, Denver, CO 80204
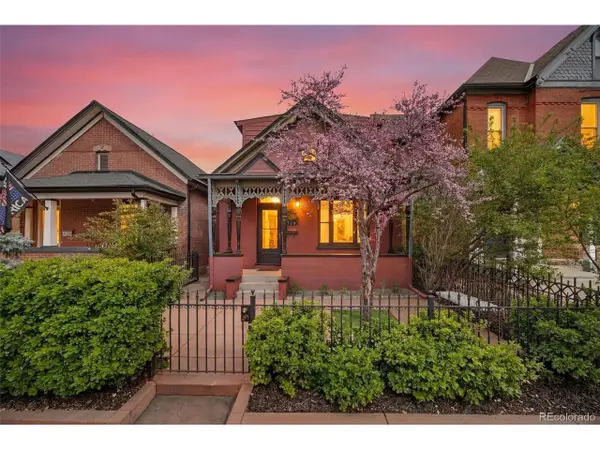
MLS# 5910713Listed by: COLDWELL BANKER REALTY 18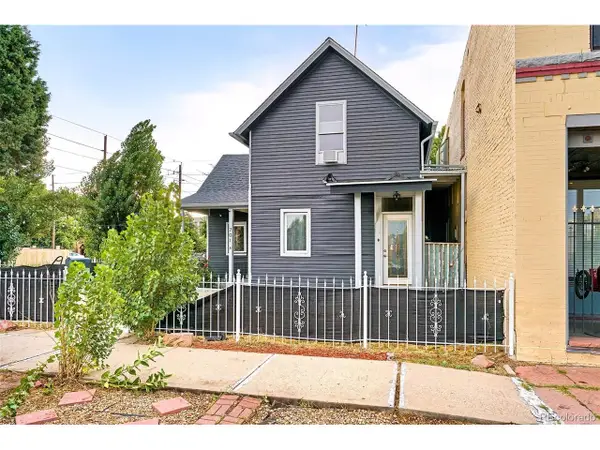 $1,050,000Active6 beds 4 baths3,198 sq. ft.
701 Galapago St, Denver, CO 80204
MLS# 2914933Listed by: Compass - Denver $625,000Active3 beds 1 baths1,142 sq. ft.
630 Elati Street, Denver, CO 80204
MLS# 8644628Listed by: MADISON & COMPANY PROPERTIES $155,000Pending-- beds 1 baths331 sq. ft.
Address Withheld By Seller, Denver, CO 80204
MLS# 7049364Listed by: Epique Realty $159,900Active-- beds 1 baths333 sq. ft.
603 Inca St #229, Denver, CO 80204
MLS# 6573552Listed by: Invalesco Real Estate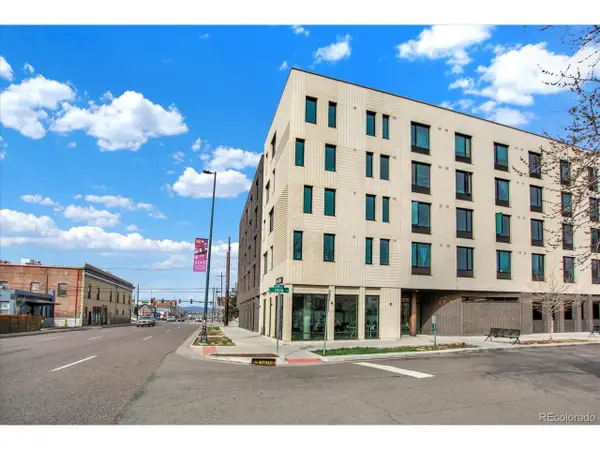 $156,000Active-- beds 1 baths333 sq. ft.
603 Inca St #423, Denver, CO 80204
MLS# 6237448Listed by: NAV Real Estate $150,000Active-- beds 1 baths331 sq. ft.
603 Inca St #216, Denver, CO 80204
MLS# 8068877Listed by: HomeSmart $159,900Active-- beds 1 baths338 sq. ft.
603 Inca St #313, Denver, CO 80204
MLS# 8760505Listed by: HomeSmart $158,000Active-- beds 1 baths331 sq. ft.
603 Inca St #301, Denver, CO 80204
MLS# 1902285Listed by: Keller Williams DTC $159,900Active-- beds 1 baths338 sq. ft.
603 Inca St #303, Denver, CO 80204
MLS# 3845453Listed by: Invalesco Real Estate $1,100,000Active3 beds 2 baths3,711 sq. ft.
701 W 6th Ave, Denver, CO 80204
MLS# 8163435Listed by: Compass - Denver $154,500Active-- beds 1 baths330 sq. ft.
603 Inca St #429, Denver, CO 80204
MLS# 5911291Listed by: Invalesco Real Estate- Open Fri, 5 to 8pm
 $825,000Active3 beds 2 baths2,630 sq. ft.
760 Santa Fe Dr #2, Denver, CO 80204
MLS# 5799570Listed by: Denver Property Team
Local realty services provided by:CENTURY 21 Top Dog Properties, CENTURY 21 Community First
The real estate listing information and related content displayed on this site is provided exclusively for consumer's personal, non-commercial use and may not be used for any purpose other than to identify prospective properties consumers may be interested in purchasing. This information and related content is deemed reliable but is not guaranteed accurate by Information and Real Estate Services, LLC.
Information source: Information and Real Estate Services, LLC. Provided for limited non-commercial use only under IRES Rules © Copyright IRES. The information being provided by Information and Real Estate Services is for the consumer's personal, non-commercial use and may not be used for any purpose other than to identify prospective properties consumer may be interested in purchasing. Any information relating to real estate for sale referenced on this web site comes from the Internet Data Exchange (IDX) program of the Information and Real Estate Services. This web site may reference real estate listing(s) held by a brokerage firm other than the broker and/or agent who owns this web site.
The accuracy of all information, regardless of source, including but not limited to open house information, square footages and lot sizes, is deemed reliable but not guaranteed and should be personally verified through personal inspection by and/or with the appropriate professionals. The data contained herein is copyrighted by Information and Real Estate Services and is protected by all applicable copyright laws. Any unauthorized dissemination of this information is in violation of copyright laws and is strictly prohibited.
Based on information submitted to the MLS GRID as of March 28, 2026 01:02 AM. All data is obtained from various sources and may not have been verified by broker or MLS GRID. Supplied Open House information is subject to change without notice. All information should be independently reviewed and verified for accuracy. Properties may or may not be listed by the office/agent presenting the information.
Popular neighborhoods near Elmwood, Denver, CO
Zip codes near Elmwood, Denver, CO
- 80202 homes for sale
- 80203 homes for sale
- 80204 homes for sale
- 80205 homes for sale
- 80206 homes for sale
- 80207 homes for sale
- 80209 homes for sale
- 80210 homes for sale
- 80211 homes for sale
- 80212 homes for sale
- 80214 homes for sale
- 80216 homes for sale
- 80218 homes for sale
- 80219 homes for sale
- 80220 homes for sale
- 80222 homes for sale
- 80223 homes for sale
- 80226 homes for sale
- 80230 homes for sale
- 80246 homes for sale
Counties near Elmwood, Denver, CO
- Adams County homes for sale
- Arapahoe County homes for sale
- Boulder County homes for sale
- Broomfield County homes for sale
- Clear Creek County homes for sale
- Denver County homes for sale
- Douglas County homes for sale
- Eagle County homes for sale
- El Paso County homes for sale
- Elbert County homes for sale
- Gilpin County homes for sale
- Grand County homes for sale
- Jefferson County homes for sale
- Lake County homes for sale
- Larimer County homes for sale
- Morgan County homes for sale
- Park County homes for sale
- Summit County homes for sale
- Teller County homes for sale
- Weld County homes for sale
Protect your home and budget from life's surprises with an Assurant Home Warranty, backed by a partner that supports you through every step of homeownership. Explore Plans.
©2026 Century 21 Real Estate LLC. All rights reserved. CENTURY 21®, the CENTURY 21 Logo and C21® are service marks owned by Century 21 Real Estate LLC. Century 21 Real Estate LLC fully supports the principles of the Fair Housing Act and the Equal Opportunity Act. Each office is independently owned and operated. Listing information is deemed reliable but not guaranteed accurate.