- Albany Park, Chicago homes for sale
- Andersonville Terrace, Chicago homes for sale
- Argyle Park, Chicago homes for sale
- Bowmanville, Chicago homes for sale
- Budlong Woods, Chicago homes for sale
- Clark Street, Chicago homes for sale
- Edgebrook, Chicago homes for sale
- Far North Side, Chicago homes for sale
- Forest Glen, Chicago homes for sale
- Kenilworth, Kenilworth homes for sale
- Lincoln Square, Chicago homes for sale
- Margate Park, Chicago homes for sale
- North Park, Chicago homes for sale
- Peterson Park, Chicago homes for sale
- Ravenswood, Chicago homes for sale
- Ravenswood Gardens, Chicago homes for sale
- Rogers Park, Chicago homes for sale
- Sauganash, Chicago homes for sale
- West Ridge, Chicago homes for sale
- Wildwood, Chicago homes for sale
Evanston, IL - homes for sale
90 of 90 results displayed
- New
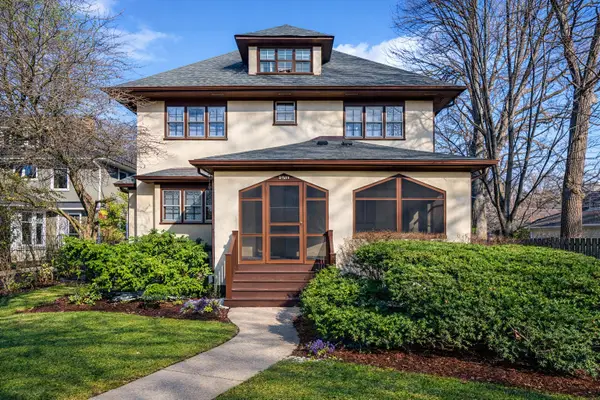 $999,999Active4 beds 3 baths2,039 sq. ft.
2509 Pioneer Road, Evanston, IL 60201
MLS# 12593384Listed by: BERKSHIRE HATHAWAY HOMESERVICES STARCK REAL ESTATE
- New
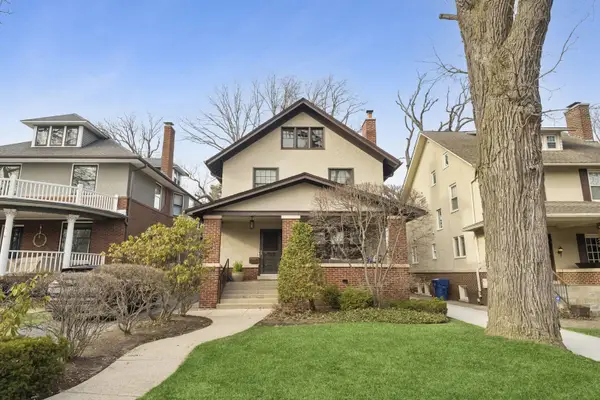 $1,489,000Active3 beds 3 baths2,830 sq. ft.
729 Lincoln Street, Evanston, IL 60201
MLS# 12599706Listed by: COLDWELL BANKER REALTY - New
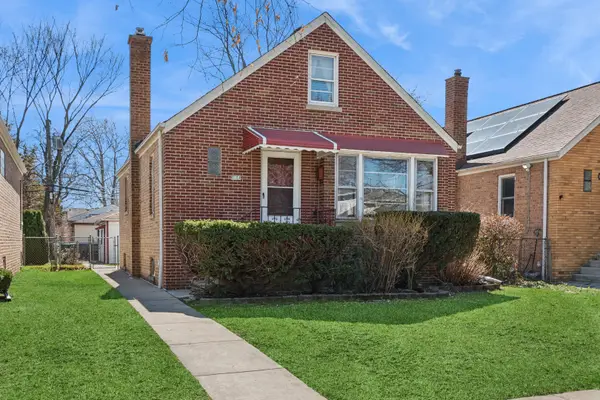 $485,000Active3 beds 2 baths1,414 sq. ft.
2124 Brummel Street, Evanston, IL 60202
MLS# 12573949Listed by: BAIRD & WARNER - New
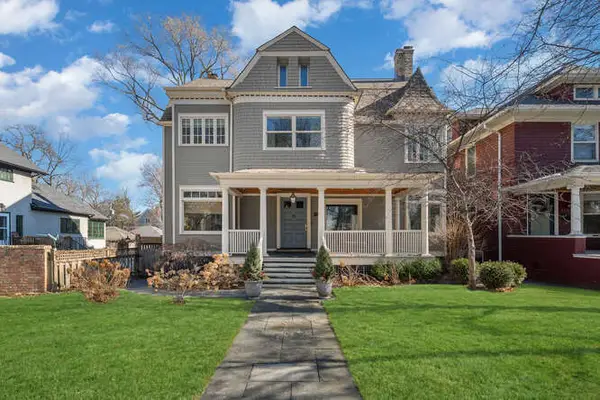 $2,295,000Active6 beds 4 baths5,714 sq. ft.
1211 Hinman Avenue, Evanston, IL 60202
MLS# 12599124Listed by: JAMESON SOTHEBY'S INTL REALTY - New
 $750,000Active4 beds 2 baths2,936 sq. ft.
1123 Main Street, Evanston, IL 60202
MLS# 12600959Listed by: BAIRD & WARNER - New
 $425,000Active4 beds 2 baths1,479 sq. ft.
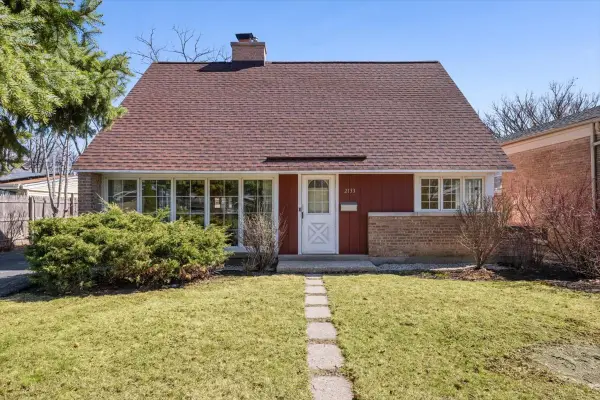
2133 Crawford Avenue, Evanston, IL 60201
MLS# 12597407Listed by: JAMESON SOTHEBY'S INTERNATIONAL REALTY 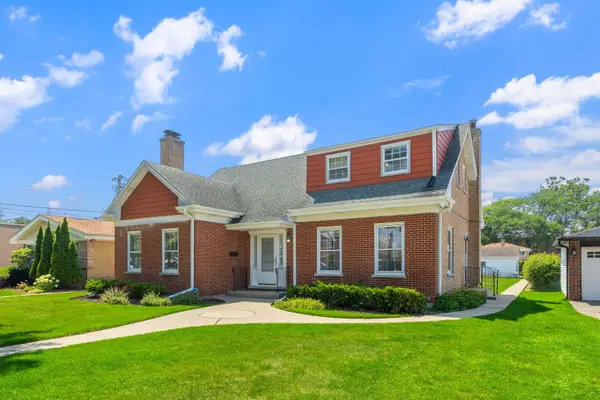 $600,000Pending3 beds 2 baths2,235 sq. ft.
8822 Central Park Avenue, Evanston, IL 60203
MLS# 12433994Listed by: GUIDANCE REALTY $1,250,000Pending5 beds 4 baths3,135 sq. ft.
2701 Noyes Street, Evanston, IL 60201
MLS# 12598493Listed by: MCSULLY PROPERTIES LLC $430,000Pending3 beds 2 baths950 sq. ft.
1822 Brown Avenue, Evanston, IL 60201
MLS# 12595090Listed by: COLDWELL BANKER REALTY- New
 $1,095,000Active4 beds 4 baths2,447 sq. ft.
1003 Wesley Avenue, Evanston, IL 60202
MLS# 12597942Listed by: REAL BROKER LLC 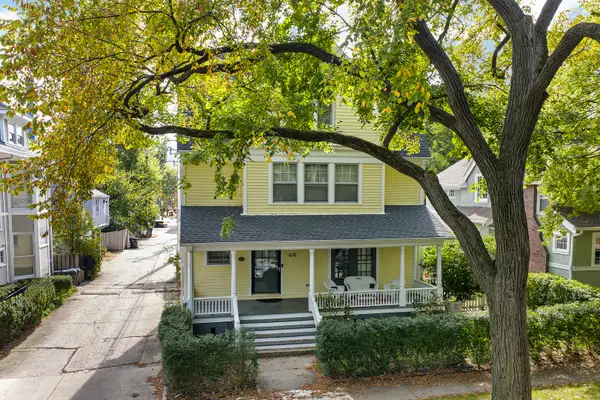 $1,300,000Pending4 beds 3 baths2,230 sq. ft.
416 Greenwood Street, Evanston, IL 60201
MLS# 12583230Listed by: COMPASS- New
 $749,000Active3 beds 2 baths1,584 sq. ft.
2437 Marcy Avenue, Evanston, IL 60201
MLS# 12594926Listed by: REDFIN CORPORATION  $575,000Pending3 beds 2 baths1,900 sq. ft.
538 Wesley Avenue, Evanston, IL 60202
MLS# 12590855Listed by: JAMESON SOTHEBY'S INTERNATIONAL REALTY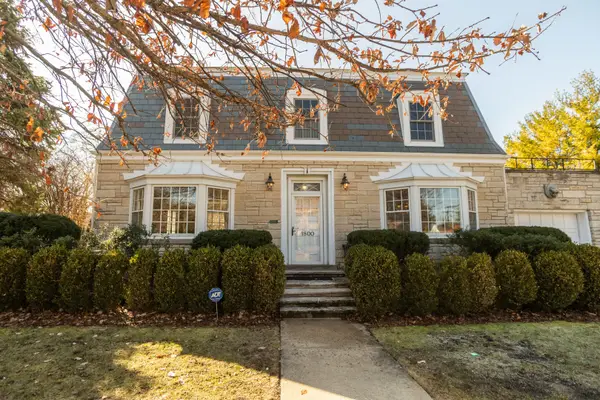 $650,000Pending3 beds 2 baths1,944 sq. ft.
1800 Kirk Street, Evanston, IL 60202
MLS# 12595113Listed by: JAMESON SOTHEBY'S INTERNATIONAL REALTY $389,000Pending3 beds 2 baths1,580 sq. ft.
1111 Darrow Avenue, Evanston, IL 60202
MLS# 12576179Listed by: BERKSHIRE HATHAWAY HOMESERVICES CHICAGO $790,000Pending3 beds 3 baths1,800 sq. ft.
1710 Lake Street, Evanston, IL 60201
MLS# 12353719Listed by: @PROPERTIES CHRISTIE'S INTERNATIONAL REAL ESTATE $625,000Pending3 beds 2 baths2,030 sq. ft.
9433 Crawford Avenue, Evanston, IL 60203
MLS# 12578297Listed by: @PROPERTIES CHRISTIE'S INTERNATIONAL REAL ESTATE $535,000Pending3 beds 2 baths1,181 sq. ft.
2109 Dobson Street, Evanston, IL 60202
MLS# 12581065Listed by: COMPASS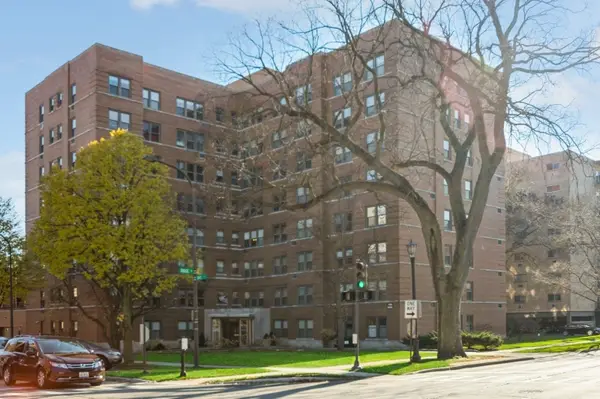 $189,900Active2 beds 1 baths1,100 sq. ft.
Address Withheld By Seller, Evanston, IL 60201
MLS# 12591971Listed by: KALE REALTY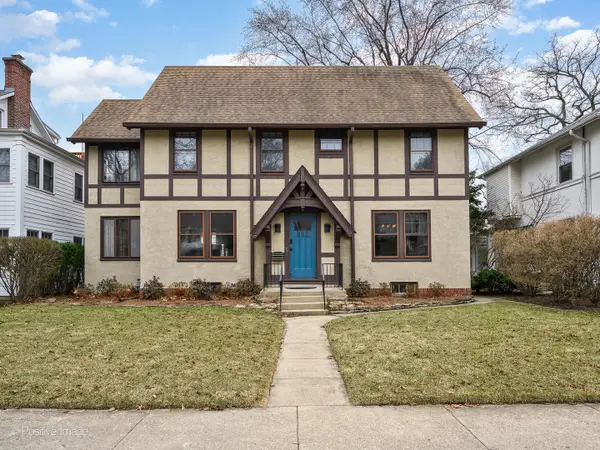 $1,350,000Pending5 beds 3 baths2,330 sq. ft.
802 Clinton Place, Evanston, IL 60201
MLS# 12583376Listed by: COMPASS $1,575,000Pending5 beds 4 baths3,570 sq. ft.
833 Lincoln Street, Evanston, IL 60201
MLS# 12587794Listed by: COMPASS $179,000Active2 beds 1 baths
1585 Ridge Avenue #502, Evanston, IL 60201
MLS# 12561146Listed by: BAIRD & WARNER $1,499,000Active5 beds 3 baths5,250 sq. ft.
9526 Lawndale Avenue, Evanston, IL 60203
MLS# 12579842Listed by: COLDWELL BANKER REALTY $749,000Pending3 beds 2 baths1,700 sq. ft.
2810 Simpson Street, Evanston, IL 60201
MLS# 12573370Listed by: @PROPERTIES CHRISTIE'S INTERNATIONAL REAL ESTATE $445,000Pending3 beds 2 baths1,286 sq. ft.
2437 Crawford Avenue, Evanston, IL 60201
MLS# 12588588Listed by: BAIRD & WARNER $1,200,000Pending5 beds 3 baths2,841 sq. ft.
2315 Park Place, Evanston, IL 60201
MLS# 12587027Listed by: JAMESON SOTHEBY'S INTERNATIONAL REALTY $1,950,000Active6 beds 5 baths6,253 sq. ft.
1218 Elmwood Avenue, Evanston, IL 60202
MLS# 12582151Listed by: @PROPERTIES CHRISTIE'S INTERNATIONAL REAL ESTATE $599,950Active4 beds 2 baths1,600 sq. ft.
Address Withheld By Seller, Evanston, IL 60202
MLS# 12585336Listed by: SKY HIGH REAL ESTATE INC. $499,000Pending4 beds 3 baths1,700 sq. ft.
1736 Keeney Street, Evanston, IL 60202
MLS# 12584944Listed by: COLDWELL BANKER REALTY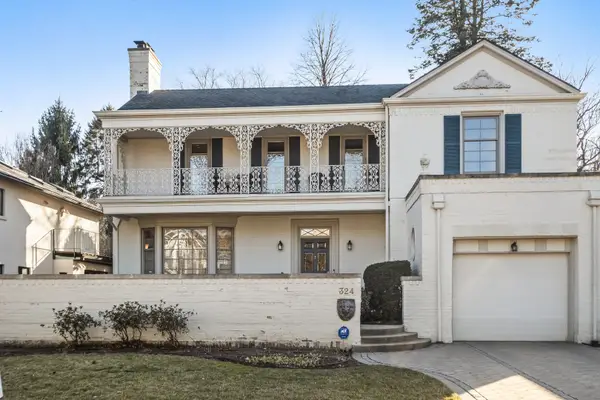 $1,600,000Pending4 beds 4 baths2,582 sq. ft.
324 Davis Street, Evanston, IL 60201
MLS# 12581311Listed by: JAMESON SOTHEBY'S INTERNATIONAL REALTY $1,349,000Pending5 beds 4 baths4,400 sq. ft.
9301 Drake Avenue, Evanston, IL 60203
MLS# 12583561Listed by: ILLINOIS DISCOUNT REALTY $725,000Pending3 beds 2 baths1,912 sq. ft.
921 Madison Street, Evanston, IL 60202
MLS# 12549370Listed by: @PROPERTIES CHRISTIE'S INTERNATIONAL REAL ESTATE $735,000Active3 beds 2 baths1,530 sq. ft.
3609 Central Street, Evanston, IL 60201
MLS# 12582890Listed by: EXP REALTY $799,900Pending3 beds 2 baths1,728 sq. ft.
2356 Ashland Avenue, Evanston, IL 60201
MLS# 12508633Listed by: BERKSHIRE HATHAWAY HOMESERVICES CHICAGO $969,000Pending3 beds 2 baths1,854 sq. ft.
3310 Hayes Street, Evanston, IL 60201
MLS# 12580526Listed by: COMPASS $1,100,000Pending5 beds 3 baths2,764 sq. ft.
1011 Maple Avenue, Evanston, IL 60202
MLS# 12525170Listed by: URBAN REALTY GROUP, INC. $1,200,000Pending3 beds 3 baths2,454 sq. ft.
2955 Colfax Street, Evanston, IL 60201
MLS# 12574246Listed by: JAMESON SOTHEBY'S INTERNATIONAL REALTY $849,000Pending5 beds 3 baths2,945 sq. ft.
1315 Main Street, Evanston, IL 60202
MLS# 12577278Listed by: COMPASS $600,000Pending3 beds 3 baths2,154 sq. ft.
9337 Lincolnwood Drive, Evanston, IL 60203
MLS# 12577624Listed by: JAMESON SOTHEBY'S INTERNATIONAL REALTY $550,000Pending4 beds 1 baths2,232 sq. ft.
517 Elmwood Avenue, Evanston, IL 60202
MLS# 12568351Listed by: BERKSHIRE HATHAWAY HOMESERVICES CHICAGO $800,000Pending5 beds 3 baths2,971 sq. ft.
3701 Foster Street, Evanston, IL 60203
MLS# 12558232Listed by: REAL BROKER LLC $899,000Pending4 beds 3 baths2,000 sq. ft.
2434 Sherman Avenue, Evanston, IL 60201
MLS# 12577312Listed by: COMPASS $899,000Pending4 beds 3 baths3,514 sq. ft.
323 Sherman Avenue, Evanston, IL 60202
MLS# 12578336Listed by: REDFIN CORPORATION $789,000Pending3 beds 3 baths1,452 sq. ft.
1460 Dewey Avenue, Evanston, IL 60201
MLS# 12574277Listed by: JAMESON SOTHEBY'S INTERNATIONAL REALTY $209,900Active2 beds 1 baths1,067 sq. ft.
1860 Sherman Avenue #5NW, Evanston, IL 60201
MLS# 12577388Listed by: COMPASS $699,000Pending4 beds 2 baths2,030 sq. ft.
2500 Thayer Street, Evanston, IL 60201
MLS# 12571351Listed by: @PROPERTIES CHRISTIE'S INTERNATIONAL REAL ESTATE $185,000Pending1 beds 1 baths1,100 sq. ft.
1585 Ridge Avenue #611, Evanston, IL 60201
MLS# 12574276Listed by: BAIRD & WARNER $299,000Pending2 beds 1 baths1,301 sq. ft.
Address Withheld By Seller, Evanston, IL 60202
MLS# 12549966Listed by: COMPASS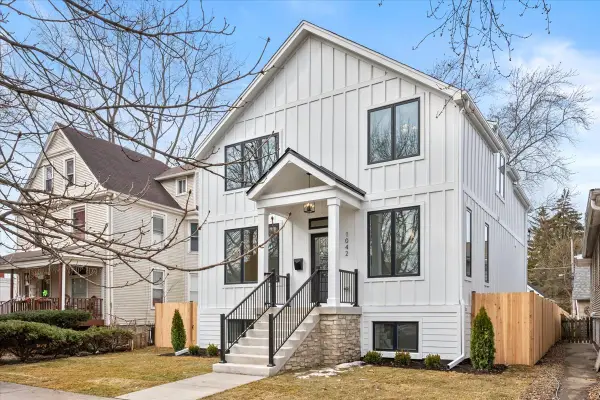 $1,195,000Pending5 beds 4 baths3,615 sq. ft.
1042 Dewey Avenue, Evanston, IL 60202
MLS# 12570173Listed by: ELITE REALTY EXPERTS, INC.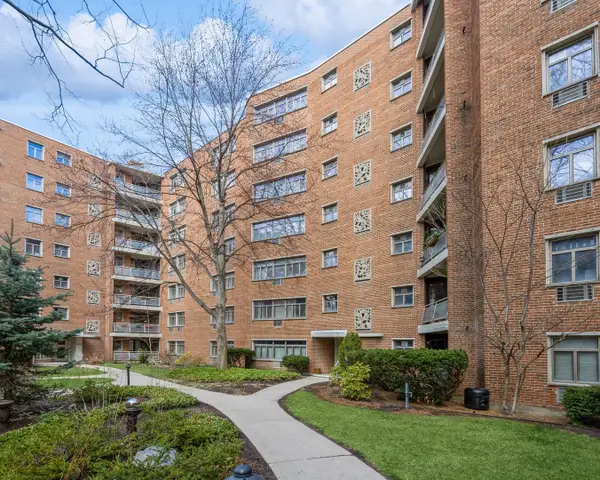 $170,000Pending2 beds 1 baths900 sq. ft.
1864 Sherman Avenue #5NW, Evanston, IL 60201
MLS# 12576699Listed by: BERKSHIRE HATHAWAY HOMESERVICES CHICAGO $950,000Pending4 beds 3 baths3,300 sq. ft.
2717 Harrison Street, Evanston, IL 60201
MLS# 12562112Listed by: JAMESON SOTHEBY'S INTERNATIONAL REALTY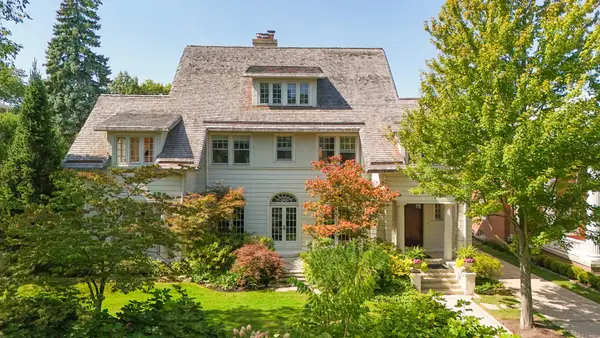 $2,750,000Pending6 beds 4 baths6,000 sq. ft.
1030 Sheridan Road, Evanston, IL 60202
MLS# 12564892Listed by: BAIRD & WARNER $700,000Pending3 beds 2 baths2,318 sq. ft.
1507 Cleveland Street, Evanston, IL 60202
MLS# 12566685Listed by: @PROPERTIES CHRISTIE'S INTERNATIONAL REAL ESTATE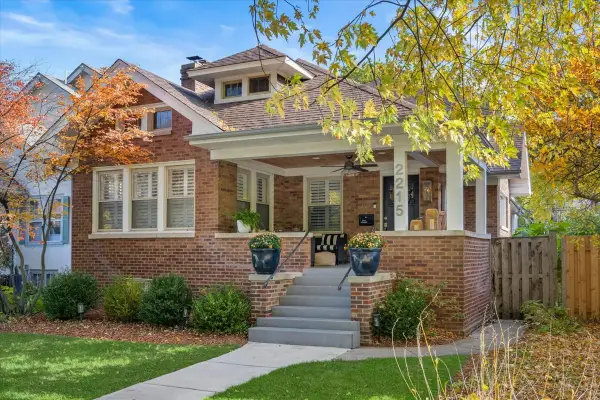 $1,295,000Pending4 beds 3 baths4,000 sq. ft.
2215 Wesley Avenue, Evanston, IL 60201
MLS# 12557025Listed by: @PROPERTIES CHRISTIE'S INTERNATIONAL REAL ESTATE $475,000Active3 beds 1 baths900 sq. ft.
2716 Ewing Avenue, Evanston, IL 60201
MLS# 12570345Listed by: JAMESON SOTHEBY'S INTL REALTY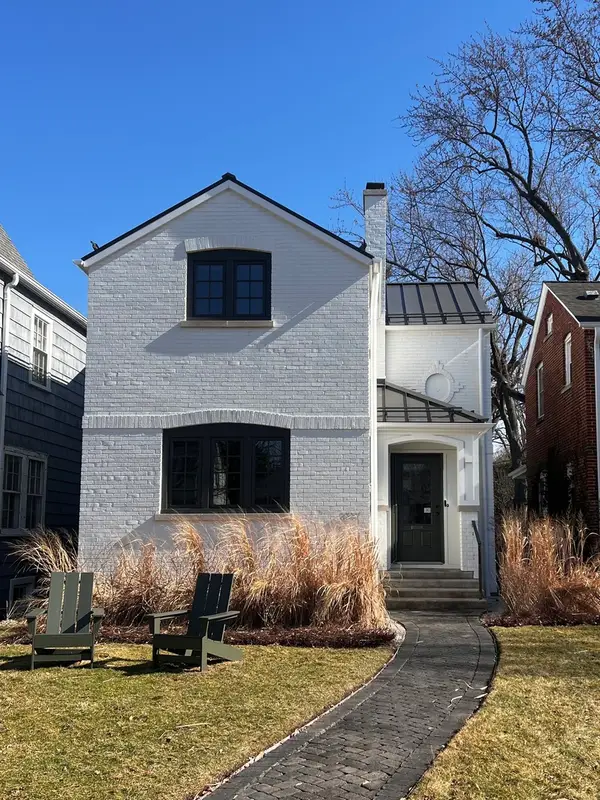 $989,000Pending3 beds 3 baths
2337 Ridgeway Avenue, Evanston, IL 60201
MLS# 11965453Listed by: COMPASS $1,449,000Active5 beds 4 baths3,898 sq. ft.
2236 Ridge Avenue, Evanston, IL 60201
MLS# 12569668Listed by: JAMESON SOTHEBY'S INTERNATIONAL REALTY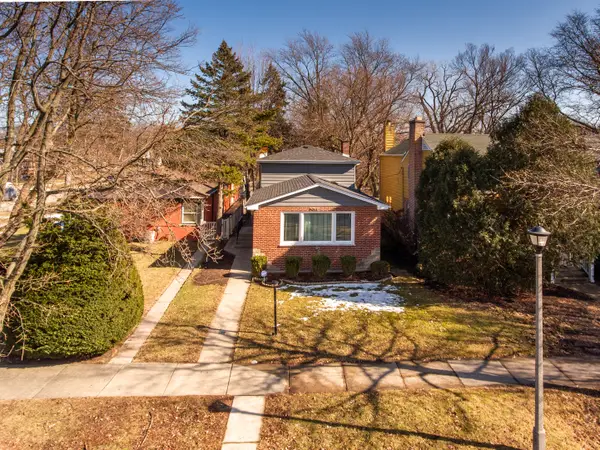 $510,000Active2 beds 2 baths1,406 sq. ft.
8953 Central Park Avenue, Evanston, IL 60203
MLS# 12569178Listed by: COLDWELL BANKER REALTY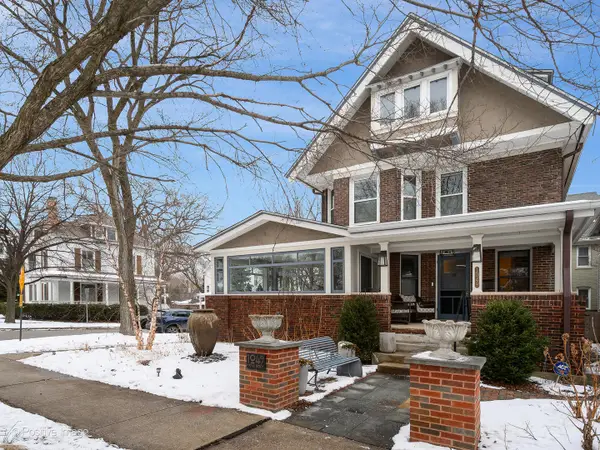 $1,250,000Pending5 beds 4 baths
1049 Hinman Avenue, Evanston, IL 60202
MLS# 12565031Listed by: COMPASS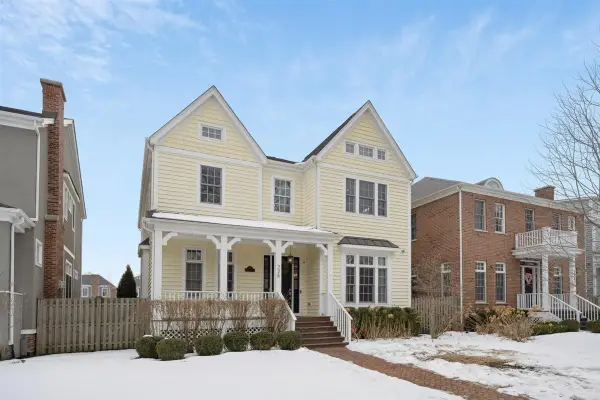 $2,200,000Pending6 beds 5 baths4,544 sq. ft.
726 Lincoln Street, Evanston, IL 60201
MLS# 12564522Listed by: @PROPERTIES CHRISTIE'S INTERNATIONAL REAL ESTATE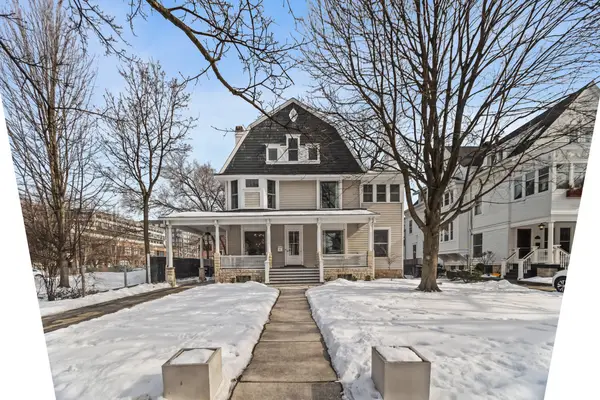 $1,925,000Active5 beds 5 baths5,295 sq. ft.
1735 Asbury Avenue, Evanston, IL 60201
MLS# 12564356Listed by: JAMESON SOTHEBY'S INTERNATIONAL REALTY $1,395,000Pending8 beds 5 baths5,700 sq. ft.
1235 Ridge Avenue, Evanston, IL 60202
MLS# 12557345Listed by: BAIRD & WARNER $989,000Pending4 beds 3 baths2,025 sq. ft.
2731 Park Place, Evanston, IL 60201
MLS# 12562072Listed by: JAMESON SOTHEBY'S INTERNATIONAL REALTY $659,000Active3 beds 2 baths2,299 sq. ft.
9532 Springfield Avenue, Evanston, IL 60203
MLS# 12565481Listed by: 4 SALE REALTY ADVANTAGE LLC $429,900Pending4 beds 2 baths1,633 sq. ft.
2508 Isabella Street, Evanston, IL 60201
MLS# 12565719Listed by: BERKSHIRE HATHAWAY HOMESERVICES CHICAGO $1,399,000Pending4 beds 3 baths3,700 sq. ft.
2951 Colfax Street, Evanston, IL 60201
MLS# 12565644Listed by: BERKSHIRE HATHAWAY HOMESERVICES CHICAGO $399,900Active3 beds 2 baths1,510 sq. ft.
1815 Cleveland Street, Evanston, IL 60202
MLS# 12562865Listed by: BERKSHIRE HATHAWAY HOMESERVICES STARCK REAL ESTATE $440,000Pending3 beds 2 baths1,303 sq. ft.
826 Brown Avenue, Evanston, IL 60202
MLS# 12532720Listed by: COLDWELL BANKER REALTY $1,225,000Pending5 beds 4 baths3,590 sq. ft.
2732 Lincolnwood Drive, Evanston, IL 60201
MLS# 12554204Listed by: COLDWELL BANKER REALTY $525,000Active5 beds 4 baths
1520 Washington Street, Evanston, IL 60202
MLS# 12560128Listed by: URB & BURB REALTY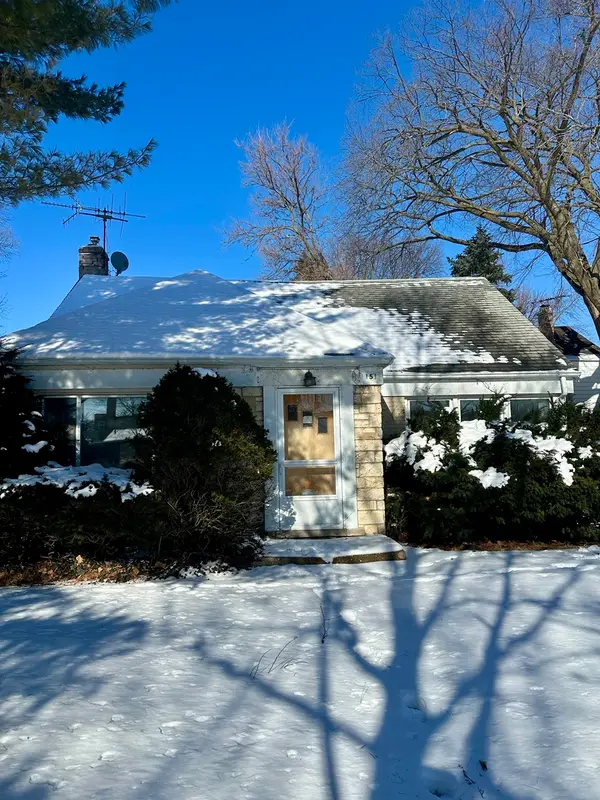 $389,900Pending3 beds 2 baths1,510 sq. ft.
1517 Dobson Street, Evanston, IL 60202
MLS# 12558960Listed by: BERKSHIRE HATHAWAY HOMESERVICES CHICAGO $599,900Pending3 beds 2 baths1,700 sq. ft.
1813 Lincoln Street, Evanston, IL 60201
MLS# 12557961Listed by: BAIRD & WARNER $625,000Pending5 beds 3 baths2,545 sq. ft.
1811 Hartrey Avenue, Evanston, IL 60201
MLS# 12570007Listed by: @PROPERTIES CHRISTIE'S INTERNATIONAL REAL ESTATE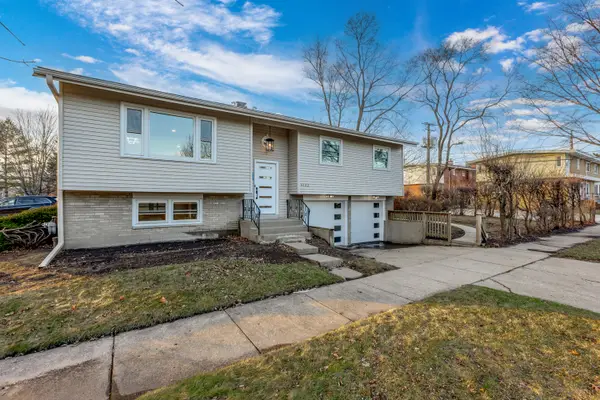 $747,700Active3 beds 3 baths2,400 sq. ft.
9132 Lincolnwood Drive, Evanston, IL 60203
MLS# 12590308Listed by: CHICAGOLAND BROKERS, INC. $799,000Pending4 beds 2 baths2,200 sq. ft.
1201 Noyes Street, Evanston, IL 60201
MLS# 12531651Listed by: COLDWELL BANKER $599,900Pending4 beds 3 baths2,200 sq. ft.
9200 Avers Avenue, Evanston, IL 60203
MLS# 12537477Listed by: HOMETOWN REAL ESTATE $1,225,000Pending5 beds 5 baths3,538 sq. ft.
9435 Central Park Avenue, Evanston, IL 60203
MLS# 12521491Listed by: @PROPERTIES CHRISTIE'S INTERNATIONAL REAL ESTATE $359,000Pending3 beds 2 baths1,400 sq. ft.
724 Noyes Street #F1, Evanston, IL 60201
MLS# 12527682Listed by: JAMESON SOTHEBY'S INTERNATIONAL REALTY $429,000Pending3 beds 1 baths1,500 sq. ft.
2321 Lee Street, Evanston, IL 60202
MLS# 12521016Listed by: COMPASS $2,000,000Active7 beds 4 baths6,000 sq. ft.
2528 Sheridan Road, Evanston, IL 60201
MLS# 12518289Listed by: JAMESON SOTHEBY'S INTERNATIONAL REALTY
 $529,900Pending2 beds 2 baths1,213 sq. ft.
9433 Lincolnwood Drive, Evanston, IL 60203
MLS# 12516841Listed by: CENTURY 21 CIRCLE $149,000Pending1 beds 1 baths800 sq. ft.
1585 Ridge Avenue #608, Evanston, IL 60201
MLS# 12510000Listed by: BERKSHIRE HATHAWAY HOMESERVICES CHICAGO $799,000Pending7 beds 5 baths2,600 sq. ft.
1037 Dodge Avenue, Evanston, IL 60202
MLS# 12499800Listed by: COMPASS $369,000Active2 beds 1 baths600 sq. ft.
1915 Grant Street, Evanston, IL 60201
MLS# 12472593Listed by: JAMESON SOTHEBY'S INTL REALTY- New
 $550,000Active5 beds 3 baths
Address Withheld By Seller, Evanston, IL 60201
MLS# 12597687Listed by: COLDWELL BANKER  $145,000Active1 beds 1 baths758 sq. ft.
1585 Ridge Avenue #506, Evanston, IL 60201
MLS# 12428262Listed by: JAMESON SOTHEBY'S INTERNATIONAL REALTY $2,095,000Active6 beds 6 baths5,416 sq. ft.
225 Hamilton Street, Evanston, IL 60202
MLS# 12592300Listed by: ENGEL & VOELKERS CHICAGO NORTH SHORE- New
 $3,275,000Active6 beds 6 baths7,700 sq. ft.
2855 Sheridan Place, Evanston, IL 60201
MLS# 12532967Listed by: COMPASS  $625,000Pending5 beds 3 baths2,500 sq. ft.
1025 Wesley Avenue, Evanston, IL 60202
MLS# 12388645Listed by: NEXTHOME ELITE $2,890,000Active11 beds 8 baths8,600 sq. ft.
1232 Ridge Avenue, Evanston, IL 60202
MLS# 12265463Listed by: JAMESON SOTHEBY'S INTL REALTY
Local realty services provided by:CENTURY 21 New Beginnings
Copyright 2026 Midwest Real Estate Data LLC. All rights reserved. The data relating to real estate for sale on this web site comes in part from the Broker Reciprocity Program of the Midwest Real Estate Data LLC. Listing information is deemed reliable but not guaranteed.
Neighborhoods near Evanston, IL
Zip codes near Evanston, IL
- 60043 homes for sale
- 60053 homes for sale
- 60076 homes for sale
- 60077 homes for sale
- 60091 homes for sale
- 60093 homes for sale
- 60201 homes for sale
- 60202 homes for sale
- 60203 homes for sale
- 60613 homes for sale
- 60625 homes for sale
- 60626 homes for sale
- 60630 homes for sale
- 60631 homes for sale
- 60640 homes for sale
- 60645 homes for sale
- 60646 homes for sale
- 60659 homes for sale
- 60660 homes for sale
- 60712 homes for sale
Popular searches near Evanston, IL
- Elmwood Park homes for sale
- Glencoe homes for sale
- Glenview homes for sale
- Harwood Heights homes for sale
- Kenilworth homes for sale
- Lincolnwood homes for sale
- Maine homes for sale
- Morton Grove homes for sale
- New Trier homes for sale
- Niles homes for sale
- Niles township homes for sale
- Norridge homes for sale
- Northbrook homes for sale
- Northfield homes for sale
- Northfield township homes for sale
- Norwood Park homes for sale
- Park Ridge homes for sale
- Skokie homes for sale
- Wilmette homes for sale
- Winnetka homes for sale
Protect your home and budget from life's surprises with an Assurant Home Warranty, backed by a partner that supports you through every step of homeownership. Explore Plans.
©2026 Century 21 Real Estate LLC. All rights reserved. CENTURY 21®, the CENTURY 21 Logo and C21® are service marks owned by Century 21 Real Estate LLC. Century 21 Real Estate LLC fully supports the principles of the Fair Housing Act and the Equal Opportunity Act. Each office is independently owned and operated. Listing information is deemed reliable but not guaranteed accurate.