- Bothell homes for sale
- Bothell East homes for sale
- Bunk Foss homes for sale
- Cathcart homes for sale
- Cavalero homes for sale
- Clearview homes for sale
- Eastmont homes for sale
- Everett homes for sale
- Fobes Hill homes for sale
- Lake Stickney homes for sale
- Larch Way homes for sale
- Martha Lake homes for sale
- Meadowdale homes for sale
- Mill Creek homes for sale
- Mill Creek East homes for sale
- Mukilteo homes for sale
- North Lynnwood homes for sale
- Picnic Point homes for sale
- Silver Firs homes for sale
- Snohomish homes for sale
98208, WA - homes for sale
124 of 124 results displayed
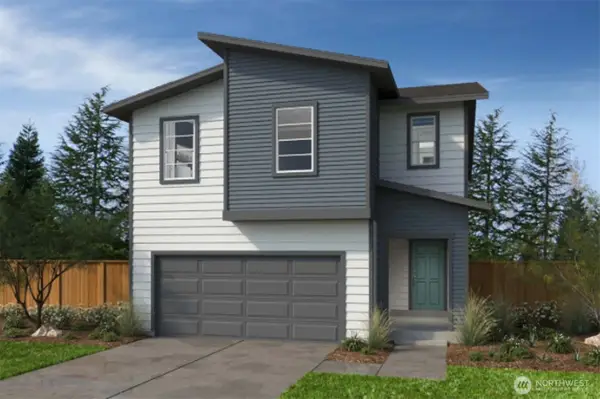
- Open Tue, 1:30 to 3:30pmNew
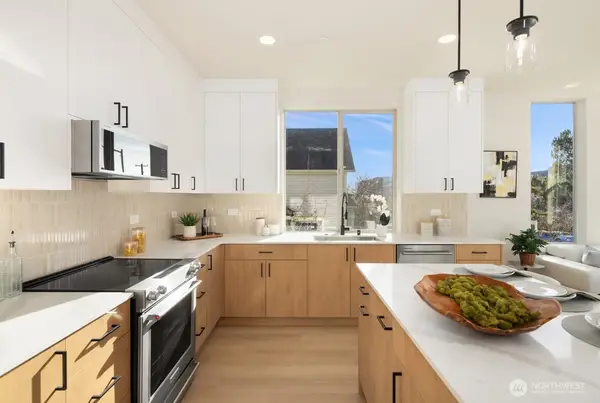
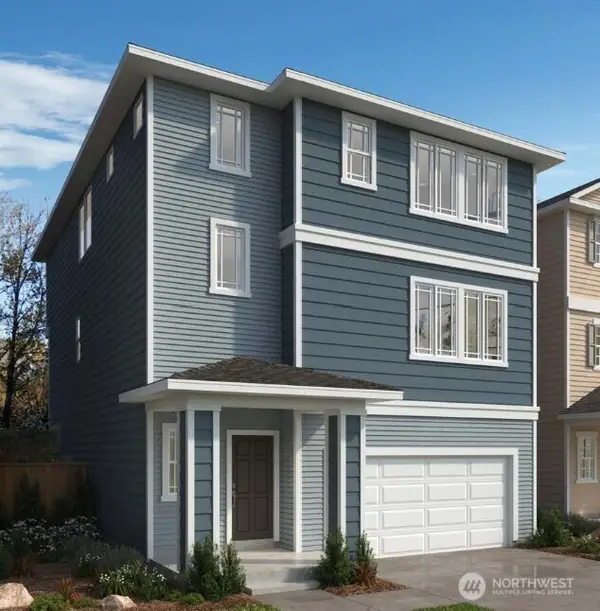
 $1,099,000Active5 beds 4 baths3,293 sq. ft.
3217 102nd Place Se, Everett, WA 98208
MLS# 2480664Listed by: WINDERMERE REAL ESTATE JS
- New
 $565,000Active3 beds 2 baths1,334 sq. ft.
3309 132nd Street Se #A202, Everett, WA 98208
MLS# 2483662Listed by: EXP REALTY - New
 $850,000Active3 beds 3 baths1,819 sq. ft.
5822 Lowell Larimer Street #B, Everett, WA 98208
MLS# 2483811Listed by: FIRST AND MAIN - New
 $1,068,500Active5 beds 3 baths3,113 sq. ft.
3613 130th Place Se, Everett, WA 98208
MLS# 2483024Listed by: JOHN L. SCOTT SNOHOMISH - New
 $185,000Active2 beds 2 baths1,152 sq. ft.
1415 84th Street Se #83, Everett, WA 98208
MLS# 2484684Listed by: RE/MAX NORTHWEST  $750,000Pending4 beds 3 baths1,922 sq. ft.
8705 Rivercrest Avenue, Everett, WA 98208
MLS# 2483200Listed by: WINDERMERE RE SKAGIT VALLEY $695,000Pending3 beds 2 baths1,452 sq. ft.
2311 96th Place Se, Everett, WA 98208
MLS# 2480858Listed by: KELLER WILLIAMS RLTY BELLEVUE $850,000Pending3 beds 3 baths1,819 sq. ft.
5822 Lowell Larimer Road #12, Everett, WA 98208
MLS# 2461566Listed by: FIRST AND MAIN $599,950Pending3 beds 2 baths1,584 sq. ft.
118 140th Street Sw, Everett, WA 98208
MLS# 2482356Listed by: COLDWELL BANKER DANFORTH- New
 $785,000Active4 beds 3 baths1,852 sq. ft.
4817 SE 147th Place, Everett, WA 98208
MLS# 2481893Listed by: GLOBENEX REALTY - New
 $975,000Active3 beds 3 baths2,598 sq. ft.
11404 SE 51st Ave Se, Everett, WA 98208
MLS# 2482032Listed by: KELLY RIGHT RE OF SEATTLE LLC - New
 $909,000Active4 beds 3 baths2,159 sq. ft.
4921 147th Place Se, Everett, WA 98208
MLS# 2478084Listed by: WINDERMERE R.E. MILL CREEK - New
 $1,325,000Active4 beds 3 baths2,892 sq. ft.
2622 123rd Place Se, Everett, WA 98208
MLS# 2481734Listed by: EVERY DOOR REAL ESTATE 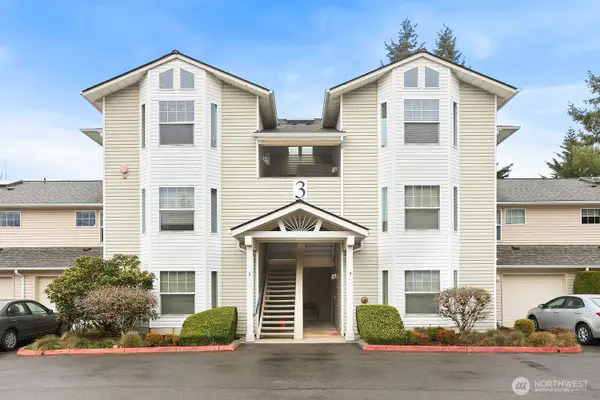 $389,000Pending2 beds 2 baths1,098 sq. ft.
2001 120th Place Se #3-304, Everett, WA 98208
MLS# 2481989Listed by: REDFIN $844,950Pending4 beds 3 baths1,788 sq. ft.
5811 153rd Place Se, Everett, WA 98208
MLS# 2482232Listed by: WILSON REALTY EXCHANGE, INC. $649,950Pending3 beds 2 baths1,288 sq. ft.
13520 51st Drive Se, Everett, WA 98208
MLS# 2482258Listed by: PICKET FENCE REAL ESTATE $725,000Pending3 beds 2 baths2,500 sq. ft.
9029 Eastview Avenue, Everett, WA 98208
MLS# 2480723Listed by: WINDERMERE REAL ESTATE/EAST- New
 $849,990Active4 beds 3 baths2,112 sq. ft.
9604 25th Drive Se, Everett, WA 98208
MLS# 2482028Listed by: WINDERMERE REAL ESTATE/M2, LLC - New
 $1,035,000Active3 beds 3 baths2,613 sq. ft.
3510 129th Place Se, Everett, WA 98208
MLS# 2481892Listed by: WINDERMERE WHIDBEY ISLAND  $850,000Pending4 beds 2 baths2,055 sq. ft.
8423 32nd Avenue Se, Everett, WA 98208
MLS# 2480978Listed by: COLDWELL BANKER DANFORTH $939,000Pending4 beds 3 baths2,569 sq. ft.
3933 119th Place Se, Everett, WA 98208
MLS# 2482178Listed by: DESIGNED REALTY- New
 $825,000Active3 beds 3 baths2,205 sq. ft.
5309 114th Street Se, Everett, WA 98208
MLS# 2477913Listed by: SKYLINE PROPERTIES, INC.  $799,950Pending3 beds 3 baths1,996 sq. ft.
14332 Cascadian Way, Everett, WA 98208
MLS# 2481373Listed by: JOHN L. SCOTT, INC. $609,990Active3 beds 3 baths1,617 sq. ft.
1206 100th Court Se #11, Everett, WA 98208
MLS# 2482152Listed by: WINDERMERE REAL ESTATE/M2, LLC $609,990Active3 beds 3 baths1,617 sq. ft.
1206 100th Court Se #11, Everett, WA 98208
MLS# 2481801Listed by: WINDERMERE REAL ESTATE/M2, LLC $80,000Active2 beds 2 baths1,424 sq. ft.
1415 84th Street Se #172, Everett, WA 98208
MLS# 2480126Listed by: EPIQUE REALTY $899,995Active3 beds 3 baths2,066 sq. ft.
9592 7th Avenue Se, Everett, WA 98208
MLS# 2481902Listed by: REAL BROKER LLC $899,995Active3 beds 3 baths2,066 sq. ft.
9592 7th Avenue Se, Everett, WA 98208
MLS# 2478562Listed by: REAL BROKER LLC $149,995Active2 beds 2 baths1,404 sq. ft.
620 112th Street Se #31, Everett, WA 98208
MLS# 2479494Listed by: RE/MAX ELITE $929,000Pending4 beds 3 baths2,617 sq. ft.
3324 112th Place Se, Everett, WA 98208
MLS# 2480081Listed by: RE/MAX METRO REALTY, INC. $520,000Active3 beds 2 baths1,519 sq. ft.
10829 19th Avenue Se #1D, Everett, WA 98208
MLS# 2479265Listed by: EXP REALTY $699,900Pending4 beds 4 baths2,086 sq. ft.
427 120th Street Se, Everett, WA 98208
MLS# 2478618Listed by: JOHN L. SCOTT SNOHOMISH $520,000Active3 beds 2 baths1,519 sq. ft.
10829 19th Ave Se #1D, Everett, WA 98208
MLS# 402758573Listed by: EXP REALTY LLC $1,100,000Active4 beds 3 baths2,780 sq. ft.
10922 39th Drive Se, Everett, WA 98208
MLS# 2479012Listed by: BERKSHIRE HATHAWAY HS NW $775,000Pending3 beds 2 baths1,525 sq. ft.
13823 54th Avenue Se, Everett, WA 98208
MLS# 2479208Listed by: RE/MAX NORTHWEST $774,950Pending3 beds 3 baths2,193 sq. ft.
11226 2nd Avenue Se, Everett, WA 98208
MLS# 2479497Listed by: REAL BROKER LLC $749,995Active3 beds 2 baths1,471 sq. ft.
13631 55th Drive Se, Everett, WA 98208
MLS# 2475311Listed by: REAL BROKER LLC $895,000Pending5 beds 3 baths2,339 sq. ft.
13004 25th Avenue Se, Everett, WA 98208
MLS# 2478197Listed by: WINDERMERE R.E. MILL CREEK $419,000Active3 beds 2 baths1,162 sq. ft.
115 124th St Se #B8, Everett, WA 98208
MLS# 2479288Listed by: PELLEGO, INC. $649,000Active3 beds 1 baths1,320 sq. ft.
13808 Cascadian Way, Everett, WA 98208
MLS# 2478322Listed by: COMPASS $750,000Active-- beds -- baths1,540 sq. ft.
8417 Gold Way, Everett, WA 98208
MLS# 2475731Listed by: JOHN L. SCOTT MILL CREEK $789,000Active3 beds 2 baths1,805 sq. ft.
12826 53rd Drive Se, Everett, WA 98208
MLS# 2477556Listed by: JOHN L. SCOTT SNOHOMISH $949,950Active4 beds 1 baths1,750 sq. ft.
219 Meadow Pl Sw, Everett, WA 98208
MLS# 2472472Listed by: KR BROKERS $125,000Active2 beds 2 baths1,056 sq. ft.
11622 Silver Lake Road #47, Everett, WA 98208
MLS# 2477417Listed by: WELAKESIDE $819,000Active3 beds 3 baths1,996 sq. ft.
12209 12th Drive Se, Everett, WA 98208
MLS# 2472123Listed by: AGENCYONE $124,998Active3 beds 2 baths1,404 sq. ft.
620 112th Street Se #23, Everett, WA 98208
MLS# 2477285Listed by: RE/MAX NORTHWEST $824,950Pending4 beds 3 baths1,690 sq. ft.
4824 147th Place Se, Everett, WA 98208
MLS# 2476049Listed by: KELLER WILLIAMS REALTY BOTHELL $275,000Pending2 beds 2 baths1,140 sq. ft.
8823 Holly Drive #D203, Everett, WA 98208
MLS# 2475040Listed by: REDFIN $760,000Pending4 beds 3 baths1,965 sq. ft.
2814 93rd Place Se, Everett, WA 98208
MLS# 2465515Listed by: AGENCYONE $700,000Pending4 beds 2 baths1,600 sq. ft.
5032 122nd Street Se, Everett, WA 98208
MLS# 2476233Listed by: NEXTHOME 365 REALTY $479,950Pending3 beds 3 baths1,258 sq. ft.
1600 121st Street Se #J101, Everett, WA 98208
MLS# 2477151Listed by: WINDERMERE REAL ESTATE/M2, LLC $850,000Active3 beds 3 baths2,598 sq. ft.
11408 51st Avenue Se, Everett, WA 98208
MLS# 2469824Listed by: REAL BROKER LLC $869,000Active3 beds 2 baths1,473 sq. ft.
2227 124th Street Se, Everett, WA 98208
MLS# 2472174Listed by: HOMESMART REAL ESTATE ASSOC $99,950Pending1 beds 1 baths700 sq. ft.
1415 84th Street Se #54, Everett, WA 98208
MLS# 2461347Listed by: WINDERMERE REAL ESTATE MIDTOWN $399,950Active3 beds 2 baths1,268 sq. ft.
11325 19th Avenue Se #C-211, Everett, WA 98208
MLS# 2470184Listed by: JOHN L. SCOTT, INC
 $735,000Active3 beds 3 baths2,256 sq. ft.
728 95th Court Se, Everett, WA 98208
MLS# 2471955Listed by: CENTURY 21 REAL ESTATE CENTER $499,997Pending2 beds 2 baths1,109 sq. ft.
11914 Nels Peters Road, Everett, WA 98208
MLS# 2467976Listed by: RE/MAX EQUITY GROUP $725,000Pending - Backup offer requested3 beds 2 baths2,076 sq. ft.
2428 Helena Lane, Everett, WA 98208
MLS# 2473462Listed by: WINDERMERE RE NORTH, INC. $1,165,000Pending4 beds 3 baths2,750 sq. ft.
4615 150th Place Se, Everett, WA 98208
MLS# 2472986Listed by: JOHN L. SCOTT SNOHOMISH $1,099,900Pending5 beds 4 baths4,300 sq. ft.
11629 54th Drive Se, Everett, WA 98208
MLS# 2473170Listed by: THE PREVIEW GROUP $840,000Pending3 beds 2 baths1,891 sq. ft.
1106 130th Street Se, Everett, WA 98208
MLS# 2472020Listed by: WINDERMERE REAL ESTATE/M2, LLC $600,000Pending3 beds 4 baths1,573 sq. ft.
1903 112th Place Se, Everett, WA 98208
MLS# 2472145Listed by: KW EVERETT $3,240,000Active3 beds 2 baths1,596 sq. ft.
12105 25th Avenue Se, Everett, WA 98208
MLS# 2472317Listed by: DAVE NELSON REAL ESTATE $3,240,000Active1.59 Acres
12105 25th Avenue Se, Everett, WA 98208
MLS# 2472443Listed by: DAVE NELSON REAL ESTATE $849,999Active5 beds 3 baths1,736 sq. ft.
2517 132nd St Se, Everett, WA 98208
MLS# 2472108Listed by: LOOKUP REALTY $1,975,000Active8 beds 5 baths2,835 sq. ft.
Address Withheld By Seller, Everett, WA 98208
MLS# 2471204Listed by: HOMESMART REAL ESTATE ASSOC $1,150,000Pending4 beds 3 baths2,300 sq. ft.
8807 Shadow Wood Drive, Everett, WA 98208
MLS# 2463941Listed by: REALOGICS SOTHEBY'S INT'L RLTY $120,000Active2 beds 2 baths1,148 sq. ft.
620 112th Street Se #207, Everett, WA 98208
MLS# 2461655Listed by: KELLER WILLIAMS REALTY BOTHELL- Open Mon, 10am to 5pm
 $1,040,255Active4 beds 4 baths2,198 sq. ft.
2415 128th St Se #35, Everett, WA 98208
MLS# 2467615Listed by: KB HOME SALES - Open Mon, 10am to 5pm
 $1,076,885Active4 beds 3 baths2,746 sq. ft.
2414 128th St Se #04, Everett, WA 98208
MLS# 2467561Listed by: KB HOME SALES - Open Mon, 10am to 5pm
 $1,054,885Active3 beds 3 baths2,570 sq. ft.
2426 128th St Se #01, Everett, WA 98208
MLS# 2464940Listed by: KB HOME SALES  $69,250Active2 beds 1 baths784 sq. ft.
11622 Silver Lake Road #SP 93, Everett, WA 98208
MLS# 2463155Listed by: THE PREVIEW GROUP $118,000Active2 beds 2 baths1,152 sq. ft.
11622 Silver Lake Road #55, Everett, WA 98208
MLS# 2467035Listed by: JOHN L. SCOTT EVERETT $85,000Active2 beds 2 baths1,242 sq. ft.
1415 84th Street Se #104, Everett, WA 98208
MLS# 2466305Listed by: HALLMARK HOMES NW, LLC $285,000Active2 beds 2 baths860 sq. ft.
1009 112th Street Se #B203, Everett, WA 98208
MLS# 2466617Listed by: RE/MAX NORTHWEST $220,000Active1 beds 1 baths542 sq. ft.
8911 Holly Drive #104, Everett, WA 98208
MLS# 2465791Listed by: WINDERMERE R.E. MILL CREEK $185,000Active2 beds 2 baths1,152 sq. ft.
1415 84th Street Se #36, Everett, WA 98208
MLS# 2465151Listed by: KW EVERETT $370,000Pending2 beds 2 baths930 sq. ft.
115 124th Street Se #J7, Everett, WA 98208
MLS# 2464039Listed by: ELINK REALTY- Open Mon, 10am to 5pm
 $984,950Active3 beds 3 baths2,070 sq. ft.
2305 128th St Se #19, Everett, WA 98208
MLS# 2464898Listed by: KB HOME SALES - Open Mon, 10am to 5pm
 $1,068,475Active3 beds 3 baths2,746 sq. ft.
2422 128th Place Se #02, Everett, WA 98208
MLS# 2454315Listed by: KB HOME SALES  $799,950Active5 beds 3 baths1,744 sq. ft.
4624 150th Place Se, Everett, WA 98208
MLS# 2463766Listed by: REDFIN $1,120,000Active4 beds 4 baths2,679 sq. ft.
5822 Lowell Larimer Road, Everett, WA 98208
MLS# 2461567Listed by: FIRST AND MAIN $75,000Active2 beds 1 baths840 sq. ft.
1415 84th Street Se, Everett, WA 98208
MLS# 2459581Listed by: KW NORTH SOUND $275,000Pending2 beds 2 baths1,140 sq. ft.
8823 Holly Drive #H204, Everett, WA 98208
MLS# 2457150Listed by: CORCORAN LIFESTYLE PROPERTIES $925,000Active3 beds 3 baths1,926 sq. ft.
14116 60th Avenue Se, Everett, WA 98208
MLS# 2458807Listed by: PELLEGO, INC. $291,000Active2 beds 2 baths1,533 sq. ft.
620 112th Street Se #154, Everett, WA 98208
MLS# 2456680Listed by: RE/MAX NORTHWEST $1,078,000Pending5 beds 3 baths2,625 sq. ft.
4620 151st Place Se, Everett, WA 98208
MLS# 2457702Listed by: FIRST AND MAIN $1,089,000Active4 beds 4 baths2,337 sq. ft.
2223 124th Street Se, Everett, WA 98208
MLS# 2457477Listed by: HOMESMART REAL ESTATE ASSOC $124,950Pending2 beds 2 baths1,536 sq. ft.
620 112th Street Se #323, Everett, WA 98208
MLS# 2455509Listed by: LPT REALTY LLC- Open Mon, 10am to 5pm
 $1,114,805Active4 beds 3 baths2,330 sq. ft.
2302 128th Place Se #15, Everett, WA 98208
MLS# 2455275Listed by: KB HOME SALES - Open Mon, 10am to 5pm
 $1,039,950Active4 beds 3 baths2,330 sq. ft.
2301 128th Street Se #18, Everett, WA 98208
MLS# 2455292Listed by: KB HOME SALES  $97,000Active2 beds 2 baths1,244 sq. ft.
620 112th Street Se #205, Everett, WA 98208
MLS# 2453735Listed by: JOHN L. SCOTT SNOHOMISH- Open Mon, 10am to 5pm
 $1,049,475Active3 beds 3 baths2,570 sq. ft.
2418 128th Place Se #03, Everett, WA 98208
MLS# 2454317Listed by: KB HOME SALES - Open Mon, 10am to 5pm
 $1,135,035Active5 beds 4 baths3,155 sq. ft.
2423 128th Place Se #37, Everett, WA 98208
MLS# 2454323Listed by: KB HOME SALES - Open Mon, 10am to 5pm
 $1,107,885Active4 beds 4 baths2,761 sq. ft.
2419 128th Place Se #36, Everett, WA 98208
MLS# 2454310Listed by: KB HOME SALES - Open Mon, 10am to 5pm
 $1,034,255Active4 beds 4 baths2,198 sq. ft.
2427 128th Place Se #38, Everett, WA 98208
MLS# 2454292Listed by: KB HOME SALES  $97,000Active2 beds 2 baths960 sq. ft.
11622 Silver Lake Road #71, Everett, WA 98208
MLS# 2452812Listed by: RE/MAX ELITE $424,950Pending3 beds 3 baths1,314 sq. ft.
2001 120th Place Se #2-105, Everett, WA 98208
MLS# 2448537Listed by: JOHN L. SCOTT, INC. $145,000Active2 beds 2 baths1,272 sq. ft.
1415 84th Street Se #61, Everett, WA 98208
MLS# 2439014Listed by: RE/MAX NORTHWEST $650,000Pending4 beds 3 baths2,099 sq. ft.
10002 13th Avenue Se, Everett, WA 98208
MLS# 2439898Listed by: JOHN L SCOTT MADRONA GROUP $925,000Pending4 beds 3 baths2,380 sq. ft.
2525 113th Place Se, Everett, WA 98208
MLS# 2440569Listed by: WINDERMERE R.E. MILL CREEK $649,970Pending3 beds 2 baths1,582 sq. ft.
10107 Meridian Avenue, Everett, WA 98208
MLS# 2484999Listed by: BEST CHOICE REALTY LLC $379,900Active2 beds 2 baths1,076 sq. ft.
2001 120th Place Se #4-304, Everett, WA 98208
MLS# 2481296Listed by: COLDWELL BANKER BAIN $874,995Active4 beds 2 baths2,192 sq. ft.
9206 31st Avenue Se, Everett, WA 98208
MLS# 2419463Listed by: SKYLINE PROPERTIES, INC. $300,000Pending2 beds 2 baths1,073 sq. ft.
8823 Holly Drive #C102, Everett, WA 98208
MLS# 2436461Listed by: WINDERMERE REAL ESTATE/EAST $115,000Active2 beds 2 baths1,152 sq. ft.
1415 SE 84th Street W #159, Everett, WA 98208
MLS# 2436954Listed by: JOHN L. SCOTT MUKILTEO $1,035,000Active3 beds 3 baths2,442 sq. ft.
12724 37th Avenue Se, Everett, WA 98208
MLS# 2431902Listed by: KELLER WILLIAMS REALTY BOTHELL $89,950Active2 beds 2 baths1,194 sq. ft.
1415 84th Street Se #117, Everett, WA 98208
MLS# 2431474Listed by: RE/MAX NORTHWEST $399,950Active2 beds 2 baths1,088 sq. ft.
2001 120th Place Se #2-204, Everett, WA 98208
MLS# 2430662Listed by: REDFIN $769,999Active3 beds 2 baths1,957 sq. ft.
901 94th Street Se, Everett, WA 98208
MLS# 2423925Listed by: VALLEYS WEST REALTY $875,000Pending3 beds 2 baths1,474 sq. ft.
12213 53rd Avenue Se, Everett, WA 98208
MLS# 2476628Listed by: WINDERMERE REAL ESTATE/EAST $384,900Active2 beds 2 baths1,091 sq. ft.
2001 120th Place Ne #8-104, Everett, WA 98208
MLS# 2481298Listed by: COLDWELL BANKER BAIN $530,000Pending2 beds 3 baths1,314 sq. ft.
11110 20th Drive Se, Everett, WA 98208
MLS# 2475829Listed by: JOHN L. SCOTT, INC. $80,000Active2 beds 2 baths1,392 sq. ft.
1415 84th Street Se #139, Everett, WA 98208
MLS# 2427929Listed by: REAL BROKER LLC $560,000Active2 beds 3 baths1,314 sq. ft.
1912 113th Place Se, Everett, WA 98208
MLS# 2473228Listed by: JOHN L. SCOTT, INC. $312,000Active2 beds 2 baths1,140 sq. ft.
8823 Holly Drive #H206, Everett, WA 98208
MLS# 2418788Listed by: RE/MAX ELITE $135,000Active3 beds 2 baths1,440 sq. ft.
11622 Silver Lake Road #54, Everett, WA 98208
MLS# 2402458Listed by: RE/MAX NORTHWEST $155,000Active2 beds 1 baths1,142 sq. ft.
1415 84th Street Se #196, Everett, WA 98208
MLS# 2381799Listed by: RE/MAX NORTHWEST $719,950Pending4 beds 3 baths1,800 sq. ft.
8510 Shadow Wood Drive #A, Everett, WA 98208
MLS# 2471738Listed by: COLDWELL BANKER BAIN $139,999Active2 beds 2 baths1,244 sq. ft.
1415 84th Street Se #136, Everett, WA 98208
MLS# 2348859Listed by: THE PREVIEW GROUP $1,300,000Active1 Acres
2 106th Street Se, Everett, WA 98208
MLS# 2270703Listed by: KW EVERETT $525,000Active0.53 Acres
308 120th Street Se, Everett, WA 98208
MLS# 2261244Listed by: KW EVERETT $299,950Active0.48 Acres
1318 130th Street Se #61, Everett, WA 98208
MLS# 2448698Listed by: KELLEY REAL ESTATE INVT. GROUP $235,000Active3 beds 2 baths1,236 sq. ft.
620 112th Street Se #193, Everett, WA 98206
MLS# 2456754Listed by: PATINA REALTY, LLC
Local realty services provided by:CENTURY 21 Lund, Realtors, CENTURY 21 North Homes Realty
Listings courtesy of Northwest MLS as distributed by MLS GRID. Based on information submitted to the MLS GRID as of March 2, 2026. All data is obtained from various sources and may not have been verified by broker or MLS GRID. Supplied Open House Information is subject to change without notice. All information should be independently reviewed and verified for accuracy. Properties may or may not be listed by the office/agent presenting the information. Listing information is provided for consumers' personal, non-commercial use, solely to identify prospective properties for potential purchase; all other use is strictly prohibited and may violate relevant federal and state law. Information deemed reliable but not guaranteed. Copyright © 2026 MLS GRID. All Rights Reserved.
All information provided is deemed reliable but is not guaranteed and should be independently verified. The content relating to real estate for sale on this web site comes in part from the IDX program of the RMLS of Portland Oregon. Real estate listings held by brokerage firms other than CENTURY 21 North Homes Realty are marked with the RMLS logo and detailed information about these properties includes the names of the listing brokers. Copyright 2026 RMLS, Portland, Oregon. Last updated: February 27, 2026
Popular searches near 98208
Popular neighborhoods near 98208
- Alderwood Manor, Lynnwood homes for sale
- Bayside, Everett homes for sale
- Boulevard Bluffs, Everett homes for sale
- Cascade View, Everett homes for sale
- Evergreen, Everett homes for sale
- Glacier View, Everett homes for sale
- Harborview, Everett homes for sale
- Harbour Pointe, Mukilteo homes for sale
- Holly, Everett homes for sale
- Pinehurst, Everett homes for sale
- Port Gardner, Everett homes for sale
- Riverside, Everett homes for sale
- Silver Firs, Everett homes for sale
- Silver Lake, Everett homes for sale
- Snohomish Cascade, Snohomish homes for sale
- South Forest Park, Everett homes for sale
- Twin Creeks, Everett homes for sale
- View Ridge Madison, Everett homes for sale
- Western Aire, Bothell homes for sale
- Westmont, Everett homes for sale
Counties near Everett, 98208
- Chelan County homes for sale
- Clallam County homes for sale
- Grays Harbor County homes for sale
- Island County homes for sale
- Jefferson County homes for sale
- King County homes for sale
- Kitsap County homes for sale
- Kittitas County homes for sale
- Lewis County homes for sale
- Mason County homes for sale
- Pierce County homes for sale
- San Juan County homes for sale
- Skagit County homes for sale
- Snohomish County homes for sale
- Thurston County homes for sale
- Whatcom County homes for sale
Protect your home and budget from life's surprises with an Assurant Home Warranty, backed by a partner that supports you through every step of homeownership. Explore Plans.
©2026 Century 21 Real Estate LLC. All rights reserved. CENTURY 21®, the CENTURY 21 Logo and C21® are service marks owned by Century 21 Real Estate LLC. Century 21 Real Estate LLC fully supports the principles of the Fair Housing Act and the Equal Opportunity Act. Each office is independently owned and operated. Listing information is deemed reliable but not guaranteed accurate.