- Adams, Los Angeles homes for sale
- Alvarado Terrace, Los Angeles homes for sale
- Angelus Mesa, Los Angeles homes for sale
- Angelus Vista, Los Angeles homes for sale
- Arlington Heights, Los Angeles homes for sale
- Arlington Park, Los Angeles homes for sale
- Byzantine-Latino Quarter, Los Angeles homes for sale
- Country Club Park, Los Angeles homes for sale
- Exposition Park, Los Angeles homes for sale
- Harvard Heights, Los Angeles homes for sale
- Jefferson Park, Los Angeles homes for sale
- King Estates, Los Angeles homes for sale
- Leimert Park, Los Angeles homes for sale
- Pico-Union, Los Angeles homes for sale
- University Park, Los Angeles homes for sale
- Vermont Square, Los Angeles homes for sale
- Wellington Square, Los Angeles homes for sale
- West Adams Heights, Los Angeles homes for sale
- West Adams Terrace, Los Angeles homes for sale
- Western Heights, Los Angeles homes for sale
Exposition Park West, Los Angeles, CA - homes for sale
9 of 9 results displayed
- Open Sat, 1 to 4pmNew
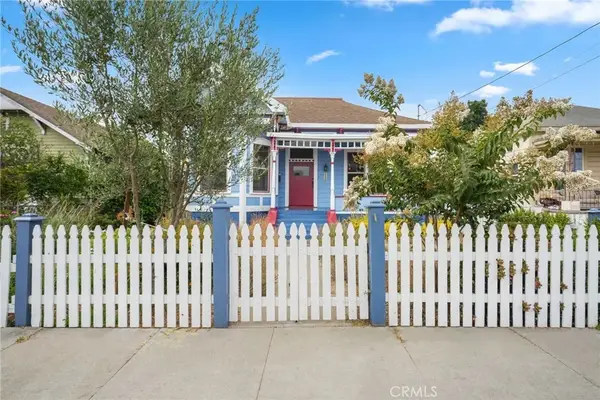 $799,999Active3 beds 2 baths1,888 sq. ft.
1598 W 36th Place, Los Angeles, CA 90018
MLS# SR26064816Listed by: PINNACLE ESTATE PROPERTIES - New
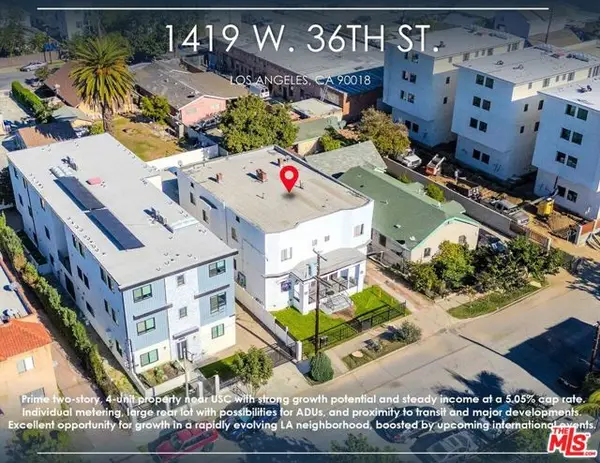 $1,395,000Active9 beds -- baths4,786 sq. ft.
1419 W 36th Street, Los Angeles, CA 90018
MLS# CL26668521Listed by: GLOBAL PLATINUM PROPERTIES, INC. - Open Sat, 1 to 4pm
 $649,000Active3 beds 2 baths808 sq. ft.
1450 W 35th Place, Los Angeles, CA 90018
MLS# PW26041449Listed by: Y REALTY 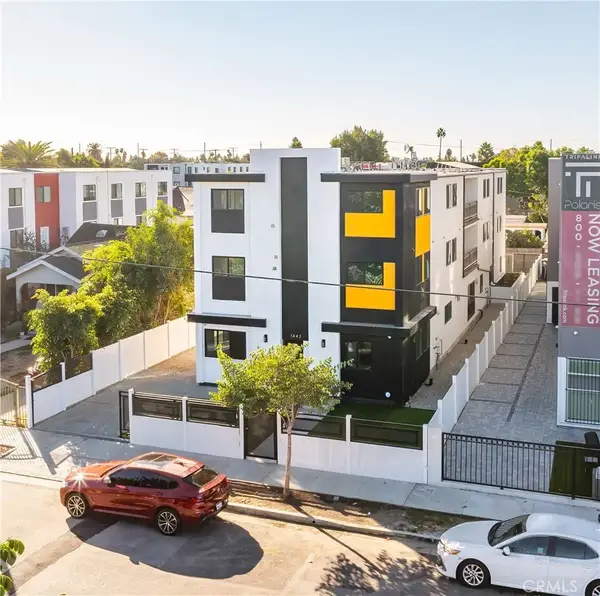 $4,500,000Active32 beds 34 baths
1444 W 37th Street, Los Angeles, CA 90018
MLS# OC26013171Listed by: PINNACLE REAL ESTATE GROUP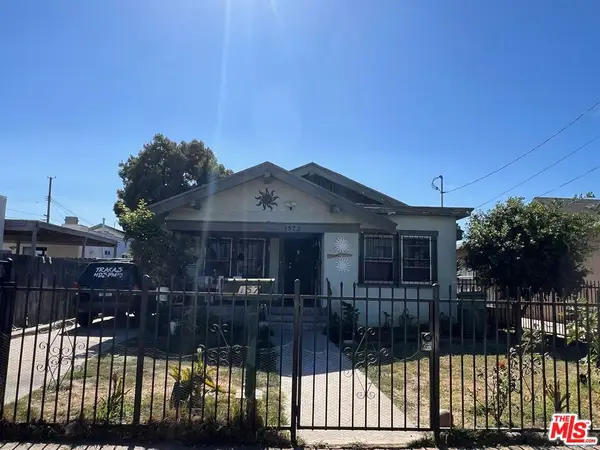 $985,000Active2 beds 1 baths1,168 sq. ft.
1572 W 37th Place, Los Angeles, CA 90018
MLS# 25625859Listed by: STANFLES REALTY $750,000Active4 beds 4 baths
1514 W 36th, Los Angeles, CA 90018
MLS# CV25243940Listed by: ELEVATE REAL ESTATE AGENCY $1,250,000Active4 beds 2 baths1,589 sq. ft.
1637 W 37th Street, Los Angeles, CA 90018
MLS# WS26047352Listed by: WETRUST REALTY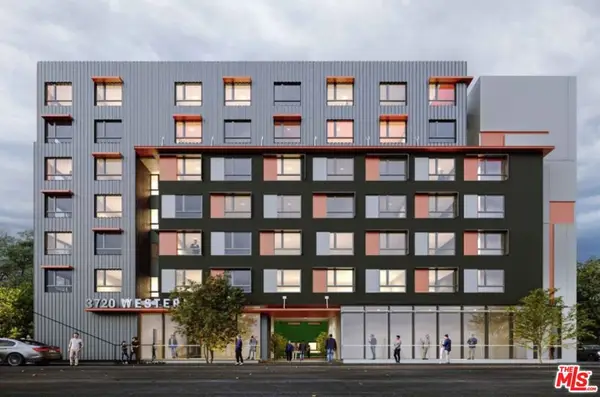 $2,950,000Active0.41 Acres
3720 S Western Avenue, Los Angeles, CA 90018
MLS# 25589221Listed by: MILLER & DESATNIK REALTY CO. $1,100,000Active2 beds -- baths2,498 sq. ft.
3734 S Harvard Boulevard, Los Angeles, CA 90018
MLS# CRSR23200468Listed by: PACIFIC SUNRISE INVESTMENTS
Local realty services provided by:CENTURY 21 Affiliated, CENTURY 21 Wildwood Properties, Inc., CENTURY 21 Experience
This information is deemed reliable but not guaranteed. You should rely on this information only to decide whether or not to further investigate a particular property. BEFORE MAKING ANY OTHER DECISION, YOU SHOULD PERSONALLY INVESTIGATE THE FACTS (e.g. square footage and lot size) with the assistance of an appropriate professional. You may use this information only to identify properties you may be interested in investigating further. All uses except for personal, non-commercial use in accordance with the foregoing purpose are prohibited. Redistribution or copying of this information, any photographs or video tours is strictly prohibited. This information is derived from the Internet Data Exchange (IDX) service provided by San Diego MLS®. Displayed property listings may be held by a brokerage firm other than the broker and/or agent responsible for this display. The information and any photographs and video tours and the compilation from which they are derived is protected by copyright. Compilation © 2020 San Diego MLS®, Inc.
The information being provided by California Regional MLS (Southern California) is for the consumer's personal, non-commercial use and may not be used for any purpose other than to identify prospective properties consumer may be interested in purchasing. Any information relating to real estate for sale referenced on this web site comes from the Internet Data Exchange (IDX) program of the California Regional MLS (Southern California). CENTURY 21 Experience is not a Multiple Listing Service (MLS), nor does it offer MLS access. This website is a service of CENTURY 21 Experience, a broker participant of California Regional MLS (Southern California). This web site may reference real estate listing(s) held by a brokerage firm other than the broker and/or agent who owns this web site.
The accuracy of all information, regardless of source, including but not limited to open house information, square footages and lot sizes, is deemed reliable but not guaranteed and should be personally verified through personal inspection by and/or with the appropriate professionals. The data contained herein is copyrighted by California Regional MLS (Southern California) and is protected by all applicable copyright laws. Any unauthorized dissemination of this information is in violation of copyright laws and is strictly prohibited.
Copyright 2021 California Regional MLS (Southern California). All rights reserved.
Popular neighborhoods near Exposition Park West, Los Angeles, CA
Zip codes near Exposition Park West, Los Angeles, CA
- 90004 homes for sale
- 90005 homes for sale
- 90006 homes for sale
- 90007 homes for sale
- 90008 homes for sale
- 90010 homes for sale
- 90011 homes for sale
- 90013 homes for sale
- 90014 homes for sale
- 90015 homes for sale
- 90016 homes for sale
- 90017 homes for sale
- 90018 homes for sale
- 90019 homes for sale
- 90020 homes for sale
- 90021 homes for sale
- 90037 homes for sale
- 90043 homes for sale
- 90057 homes for sale
- 90062 homes for sale
Counties near Exposition Park West, Los Angeles, CA
Protect your home and budget from life's surprises with an Assurant Home Warranty, backed by a partner that supports you through every step of homeownership. Explore Plans.
©2026 Century 21 Real Estate LLC. All rights reserved. CENTURY 21®, the CENTURY 21 Logo and C21® are service marks owned by Century 21 Real Estate LLC. Century 21 Real Estate LLC fully supports the principles of the Fair Housing Act and the Equal Opportunity Act. Each office is independently owned and operated. Listing information is deemed reliable but not guaranteed accurate.