- Allendale homes for sale
- American Canyon homes for sale
- Bay Point homes for sale
- Benicia homes for sale
- Dixon homes for sale
- Fairfield homes for sale
- Fairfield-Suisun City homes for sale
- Green Valley homes for sale
- Hartley homes for sale
- Moskowite Corner homes for sale
- Mountain View homes for sale
- Napa homes for sale
- Pittsburg homes for sale
- Rio Vista homes for sale
- Silverado Resort homes for sale
- Suisun City homes for sale
- Vacaville homes for sale
- Vallejo homes for sale
- Vine Hill homes for sale
- Winters homes for sale
94533, CA - homes for sale
9 of 9 results displayed
- New
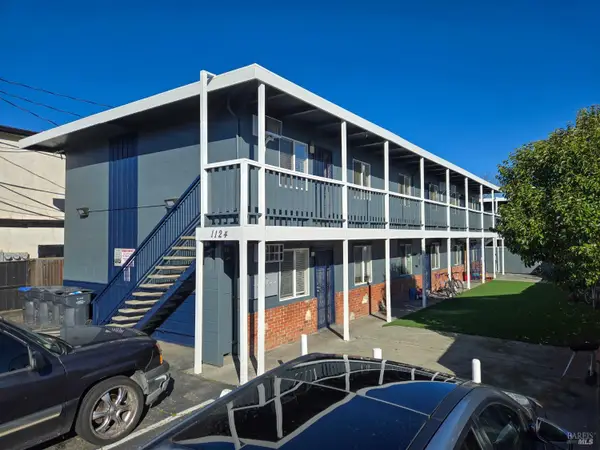 $2,195,000Active-- beds -- baths6,912 sq. ft.
1124 Union Avenue, Fairfield, CA 94533
MLS# 326022185Listed by: BERKSHIRE HATHAWAY 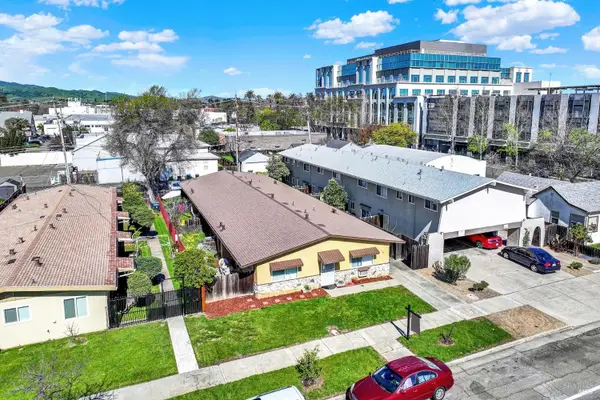 $875,000Pending6 beds 4 baths
724 Delaware Street, Fairfield, CA 94533
MLS# 326018722Listed by: MCGUIRE REAL ESTATE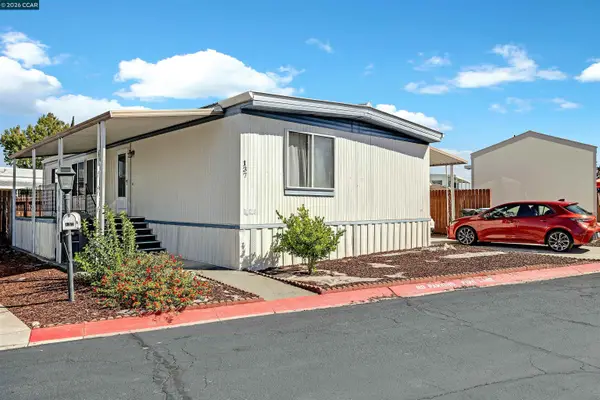 $189,000Pending3 beds 2 baths1,344 sq. ft.
137 Valencia, Fairfield, CA 94533
MLS# 41123332Listed by: REAL ESTATE SOURCE, INC.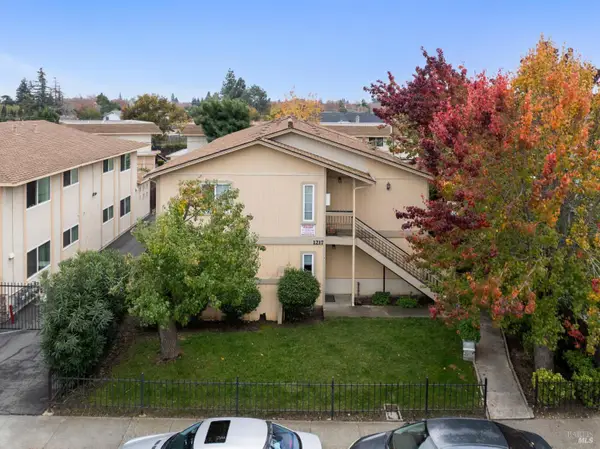 $1,525,000Active16 beds 2 baths6,536 sq. ft.
1217 Dana Drive, Fairfield, CA 94533
MLS# 326003313Listed by: COLDWELL BANKER COMMERCIAL REALTY $4,750,000Pending27 beds 4 baths18,423 sq. ft.
133 E Travis Boulevard, Fairfield, CA 94533
MLS# 325104318Listed by: NORTHBAY PROPERTY MANAGEMENT $2,400,000Active-- beds -- baths9,402 sq. ft.
1541 Rayburn Court, Fairfield, CA 94533
MLS# 325100267Listed by: REIMER REAL ESTATE, INC. $599,000Pending5 beds 1 baths2,293 sq. ft.
519 Pacific Avenue, Fairfield, CA 94533
MLS# 325097244Listed by: RE/MAX GOLD $1,550,000Active-- beds -- baths6,998 sq. ft.
735 Ohio Street, Fairfield, CA 94533
MLS# 325097053Listed by: NORTH VALLEY REAL ESTATE ADVISORS $975,000Active8 beds 4 baths2,960 sq. ft.
1712 Arthur Court, Fairfield, CA 94533
MLS# 325093541Listed by: COLDWELL BANKER KAPPEL GATEWAY REALTY
Local realty services provided by:CENTURY 21 Kobetz Realty, CENTURY 21 Wildwood Properties, Inc., CENTURY 21 Baldini Real Estate, Inc., CENTURY 21 Select Real Estate, Inc.
The information being provided by Bay Area Real Estate Information Service is for the consumer's personal, non-commercial use and may not be used for any purpose other than to identify prospective properties consumer may be interested in purchasing. Any information relating to real estate for sale referenced on this web site comes from the Internet Data Exchange (IDX) program of the Bay Area Real Estate Information Service. CENTURY 21 Kobetz Realty is not a Multiple Listing Service (MLS), nor does it offer MLS access. This website is a service of CENTURY 21 Kobetz Realty, a broker participant of Bay Area Real Estate Information Service. This web site may reference real estate listing(s) held by a brokerage firm other than the broker and/or agent who owns this web site.
The accuracy of all information, regardless of source, including but not limited to open house information, square footages and lot sizes, is deemed reliable but not guaranteed and should be personally verified through personal inspection by and/or with the appropriate professionals. The data contained herein is copyrighted by Bay Area Real Estate Information Service and is protected by all applicable copyright laws. Any unauthorized dissemination of this information is in violation of copyright laws and is strictly prohibited.
Properties in listings may have been sold or may no longer be available.
Copyright 2026 Bay Area Real Estate Information Service. All rights reserved.
The information being provided by San Francisco Association of REALTORS is for the consumer's personal, non-commercial use and may not be used for any purpose other than to identify prospective properties consumer may be interested in purchasing. Any information relating to real estate for sale referenced on this web site comes from the Internet Data Exchange (IDX) program of the San Francisco Association of REALTORS. This web site may reference real estate listing(s) held by a brokerage firm other than the broker and/or agent who owns this web site. The accuracy of all information, regardless of source, including but not limited to open house information, square footages and lot sizes, is deemed reliable but not guaranteed and should be personally verified through personal inspection by and/or with the appropriate professionals. The data contained herein is copyrighted by San Francisco Association of REALTORS and is protected by all applicable copyright laws. Any unauthorized dissemination of this information is in violation of copyright laws and is strictly prohibited.
MetroList MLS 2026. This information is being provided by MetroList MLS. All measurements and calculations of area are approximate. Information provided by Seller/Other sources, not verified by Broker. All interested persons should independently verify accuracy of information. Provided properties may or may not be listed by the office/agent presenting the information. Data Updated: March 21, 2026. Information being provided is for consumers' personal, non-commercial use and may not be used for any purpose other than to identify prospective properties consumers may be interested in purchasing. Information deemed reliable but not guaranteed. Any offer of compensation is made only to Participants of MLS where the subject listing is filed and in accordance with such MLS's regulations or rules.
Popular searches near 94533
Popular neighborhoods near 94533
- Alta Heights, Napa homes for sale
- Coombsville, Napa homes for sale
- Dixon California, Dixon homes for sale
- Downtown Napa, Napa homes for sale
- Fairmont, Vacaville homes for sale
- Heritage Park, Suisun City homes for sale
- Lawler Ranch, Suisun City homes for sale
- Leisure Town, Vacaville homes for sale
- Napa Abajo, Napa homes for sale
- Paradise Valley, Fairfield homes for sale
- Peterson Ranch, Suisun City homes for sale
- Riverpark, Napa homes for sale
- Seminole, Fairfield homes for sale
- Shurtleff, Napa homes for sale
- Silverado Country Club, Napa homes for sale
- Somerset Highlands, Vallejo homes for sale
- Southtown, Vacaville homes for sale
- Terrace, Napa homes for sale
- Valley Glen, Dixon homes for sale
- Vintage Ranch, American Canyon homes for sale
Counties near Fairfield, 94533
- Alameda County homes for sale
- Amador County homes for sale
- Calaveras County homes for sale
- Colusa County homes for sale
- Contra Costa County homes for sale
- Lake County homes for sale
- Marin County homes for sale
- Napa County homes for sale
- Sacramento County homes for sale
- San Francisco County homes for sale
- San Joaquin County homes for sale
- San Mateo County homes for sale
- Santa Clara County homes for sale
- Santa Cruz County homes for sale
- Solano County homes for sale
- Sonoma County homes for sale
- Stanislaus County homes for sale
- Sutter County homes for sale
- Yolo County homes for sale
- Yuba County homes for sale
Protect your home and budget from life's surprises with an Assurant Home Warranty, backed by a partner that supports you through every step of homeownership. Explore Plans.
©2026 Century 21 Real Estate LLC. All rights reserved. CENTURY 21®, the CENTURY 21 Logo and C21® are service marks owned by Century 21 Real Estate LLC. Century 21 Real Estate LLC fully supports the principles of the Fair Housing Act and the Equal Opportunity Act. Each office is independently owned and operated. Listing information is deemed reliable but not guaranteed accurate.