- Brauers, Richmond homes for sale
- Chimborazo, Richmond homes for sale
- Church Hill, Richmond homes for sale
- Church Hill North, Richmond homes for sale
- City Center, Richmond homes for sale
- Downtown, Richmond homes for sale
- East Side, Richmond homes for sale
- Eastview, Richmond homes for sale
- Green Park, Richmond homes for sale
- Highland Park Southern Tip, Richmond homes for sale
- Jackson Ward, Richmond homes for sale
- Monroe Ward, Richmond homes for sale
- Oakwood, Richmond homes for sale
- Old Town Manchester, Richmond homes for sale
- Shockoe Bottom, Richmond homes for sale
- Shockoe Slip, Richmond homes for sale
- Southern Barton Heights, Richmond homes for sale
- Union Hill, Richmond homes for sale
- Whitcomb, Richmond homes for sale
- Woodville, Richmond homes for sale
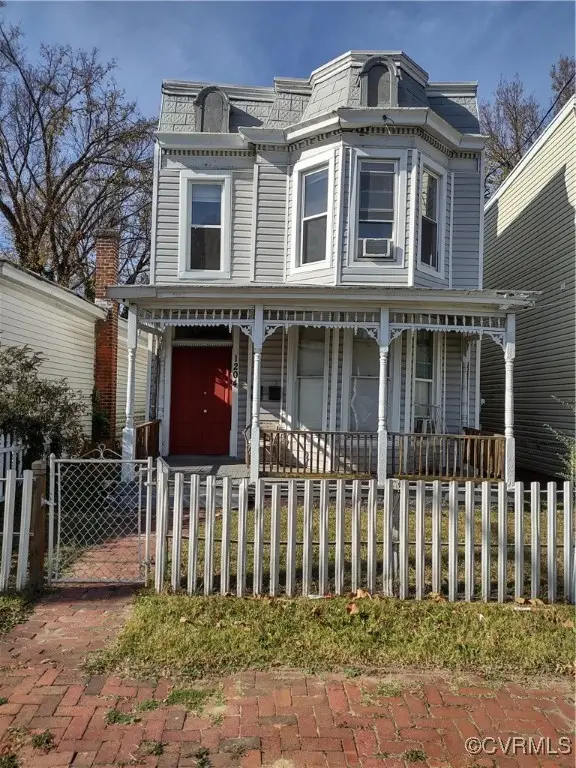
Fairmount, Richmond, VA - homes for sale
1 of 1 results displayed
Local realty services provided by:CENTURY 21 Nachman Realty
Popular neighborhoods near Fairmount, Richmond, VA
Zip codes near Fairmount, Richmond, VA
- 23075 homes for sale
- 23111 homes for sale
- 23116 homes for sale
- 23150 homes for sale
- 23219 homes for sale
- 23220 homes for sale
- 23221 homes for sale
- 23222 homes for sale
- 23223 homes for sale
- 23224 homes for sale
- 23225 homes for sale
- 23226 homes for sale
- 23227 homes for sale
- 23228 homes for sale
- 23229 homes for sale
- 23230 homes for sale
- 23231 homes for sale
- 23234 homes for sale
- 23235 homes for sale
- 23294 homes for sale
Counties near Fairmount, Richmond, VA
- Amelia County homes for sale
- Caroline County homes for sale
- Charles City County homes for sale
- Chesterfield County homes for sale
- Colonial Heights city County homes for sale
- Dinwiddie County homes for sale
- Essex County homes for sale
- Goochland County homes for sale
- Hanover County homes for sale
- Henrico County homes for sale
- Hopewell city County homes for sale
- James City County homes for sale
- King and Queen County homes for sale
- King William County homes for sale
- Louisa County homes for sale
- New Kent County homes for sale
- Petersburg city County homes for sale
- Powhatan County homes for sale
- Prince George County homes for sale
- Richmond city County homes for sale
Protect your home and budget from life's surprises with an Assurant Home Warranty, backed by a partner that supports you through every step of homeownership. Explore Plans.
©2026 Century 21 Real Estate LLC. All rights reserved. CENTURY 21®, the CENTURY 21 Logo and C21® are service marks owned by Century 21 Real Estate LLC. Century 21 Real Estate LLC fully supports the principles of the Fair Housing Act and the Equal Opportunity Act. Each office is independently owned and operated. Listing information is deemed reliable but not guaranteed accurate.