- Abert Estates, Colorado Springs homes for sale
- Bent Tree, Monument homes for sale
- Briargate, Colorado Springs homes for sale
- Briargate Area, Colorado Springs homes for sale
- Canterbury, Monument homes for sale
- Cathedral Pines, Colorado Springs homes for sale
- Cherry Creek Crossing, Colorado Springs homes for sale
- Cordera, Colorado Springs homes for sale
- Fox Run, Colorado Springs homes for sale
- Gleneagle, Colorado Springs homes for sale
- High Forest Ranch, Colorado Springs homes for sale
- Jackson Creek, Monument homes for sale
- Kambridge Point, Colorado Springs homes for sale
- Misty Meadows, Colorado Springs homes for sale
- Northgate, Colorado Springs homes for sale
- Northgate Area, Usaf Academy homes for sale
- Pastimes, Monument homes for sale
- Pine Creek, Colorado Springs homes for sale
- Summerfield, Colorado Springs homes for sale
- Wolf Ranch, Colorado Springs homes for sale
Flying Horse Ranch, Colorado Springs, CO - homes for sale
99 of 99 results displayed
- New
 $1,275,000Active3 beds 3 baths4,782 sq. ft.
2328 Margaux Valley Way, Colorado Springs, CO 80921
MLS# 6062066Listed by: REMAX PROPERTIES
- New
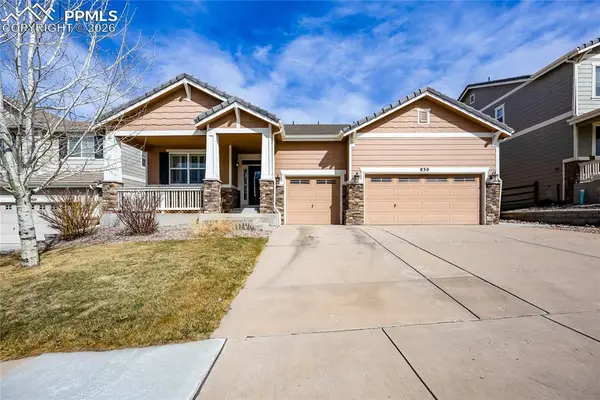 $589,000Active4 beds 3 baths4,204 sq. ft.
830 Spectrum Loop, Colorado Springs, CO 80921
MLS# 4226798Listed by: HOMESMART - New
 $890,000Active5 beds 4 baths3,316 sq. ft.
1951 Ruffino Dr, Colorado Springs, CO 80921
MLS# 6053700Listed by: HomeSmart Realty - New

 $1,180,000Active5 beds 5 baths4,610 sq. ft.
1907 Redbank Dr, Colorado Springs, CO 80921
MLS# 9742920Listed by: Century 21 Moore Real Estate - New
 $649,900Active3 beds 3 baths3,092 sq. ft.
13105 Cake Bread Heights, Colorado Springs, CO 80921
MLS# 2299737Listed by: REAL BROKER, LLC DBA REAL - New
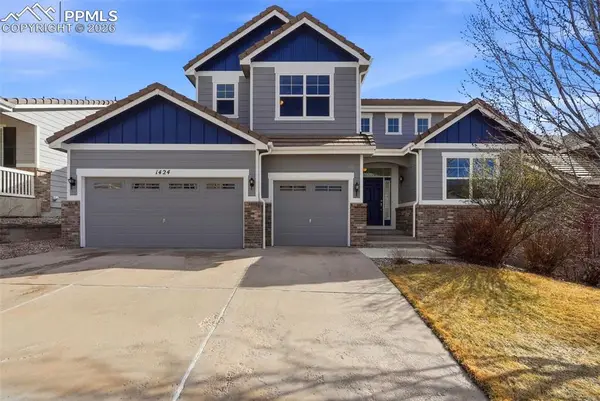 $659,900Active4 beds 4 baths4,314 sq. ft.
1424 Diamond Rim Drive, Colorado Springs, CO 80921
MLS# 8237399Listed by: SELLSTATE ALLIANCE REALTY - New
 $679,990Active3 beds 2 baths3,715 sq. ft.
13780 Honey Hush Trl, Parker, CO 80134
MLS# 9852269Listed by: DFH Colorado Realty LLC - New
 $725,000Active4 beds 4 baths3,096 sq. ft.
2055 Zenato Ct, Colorado Springs, CO 80921
MLS# 5182881Listed by: eXp Realty, LLC  $719,900Active4 beds 3 baths3,616 sq. ft.
12950 Penfold Drive, Colorado Springs, CO 80921
MLS# 4230712Listed by: QUANTUM RESIDENTIAL GROUP, LLC $900,000Active5 beds 4 baths4,182 sq. ft.
1489 Yellow Tail Drive, Colorado Springs, CO 80921
MLS# 9207317Listed by: ENGEL & VOELKERS PIKES PEAK $469,900Active3 beds 3 baths1,817 sq. ft.
13388 Positano Pt, Colorado Springs, CO 80921
MLS# 1053704Listed by: Black Feather Realty $985,000Active5 beds 4 baths3,978 sq. ft.
2242 Solterra Street, Colorado Springs, CO 80921
MLS# 3948944Listed by: THE PLATINUM GROUP $850,000Active5 beds 4 baths3,480 sq. ft.
1130 Spectrum Loop, Colorado Springs, CO 80921
MLS# 4905780Listed by: EXP REALTY LLC $2,350,000Active5 beds 6 baths6,429 sq. ft.
1797 Redbank Drive, Colorado Springs, CO 80921
MLS# 5841696Listed by: ENGEL & VOELKERS PIKES PEAK $659,000Active4 beds 4 baths4,326 sq. ft.
837 Altamont Ridge Drive, Colorado Springs, CO 80921
MLS# 9630731Listed by: HOMESMART $699,900Active4 beds 3 baths3,242 sq. ft.
1849 Clayhouse Drive, Colorado Springs, CO 80921
MLS# 8888984Listed by: BETTER HOMES AND GARDENS REAL ESTATE KENNEY & COMPANY $719,000Pending2 beds 2 baths2,296 sq. ft.
13689 Frost Bitten Grove, Colorado Springs, CO 80921
MLS# 6443138Listed by: THE PLATINUM GROUP $1,450,000Active5 beds 5 baths5,126 sq. ft.
Address Withheld By Seller, Colorado Springs, CO 80921
MLS# 5461160Listed by: Inside Edge Real Estate Inc $1,045,000Active5 beds 4 baths4,612 sq. ft.
1878 Walnut Creek Court, Colorado Springs, CO 80921
MLS# 4560487Listed by: REDFIN CORPORATION $1,000,000Active6 beds 5 baths4,598 sq. ft.
13421 Crane Canyon Loop, Colorado Springs, CO 80921
MLS# 2884589Listed by: The Cutting Edge $1,075,000Active4 beds 4 baths4,898 sq. ft.
13957 Sierra Knolls Court, Colorado Springs, CO 80921
MLS# 2184208Listed by: TREK REAL ESTATE GROUP, INC $525,000Active4 beds 3 baths2,516 sq. ft.
11415 Rill Point, Colorado Springs, CO 80921
MLS# 9324344Listed by: HOMESMART $899,900Active5 beds 4 baths4,265 sq. ft.
2129 Diamond Creek Drive, Colorado Springs, CO 80921
MLS# 3920698Listed by: LIV SOTHEBY'S INTERNATIONAL REALTY CO SPRINGS $1,375,000Active6 beds 6 baths5,004 sq. ft.
13274 Dominus Way, Colorado Springs, CO 80921
MLS# 9667177Listed by: THE CUTTING EDGE $899,900Active5 beds 4 baths4,265 sq. ft.
2129 Diamond Creek Drive, Colorado Springs, CO 80921
MLS# 5548624Listed by: LIV SOTHEBY'S INTERNATIONAL REALTY $1,199,000Pending5 beds 4 baths4,834 sq. ft.
1981 Clayhouse Drive, Colorado Springs, CO 80921
MLS# 4611181Listed by: KELLER WILLIAMS CLIENTS CHOICE REALTY $950,000Active5 beds 4 baths3,742 sq. ft.
1992 Walnut Creek Ct, Colorado Springs, CO 80921
MLS# 3537847Listed by: ERA Shields Real Estate $686,800Active5 beds 3 baths2,432 sq. ft.
Address Withheld By Seller, Colorado Springs, CO 80921
MLS# 8570737Listed by: Classic Residential Services $677,400Active4 beds 3 baths2,499 sq. ft.
Address Withheld By Seller, Colorado Springs, CO 80921
MLS# 9772998Listed by: Classic Residential Services $686,800Active-- beds -- baths
13621 Flurry Heights, Colorado Springs, CO 80921
MLS# 1791753Listed by: CLASSIC RESIDENTIAL SERVICES $677,400Active-- beds -- baths
13633 Flurry Heights, Colorado Springs, CO 80921
MLS# 1918519Listed by: CLASSIC RESIDENTIAL SERVICES $686,800Active-- beds -- baths
13620 Flurry Heights, Colorado Springs, CO 80921
MLS# 2409709Listed by: CLASSIC RESIDENTIAL SERVICES $677,400Active-- beds -- baths
13632 Flurry Heights, Colorado Springs, CO 80921
MLS# 9815034Listed by: CLASSIC RESIDENTIAL SERVICES $677,400Active4 beds 3 baths2,499 sq. ft.
13632 Flurry Heights, Colorado Springs, CO 80921
MLS# 9772998Listed by: CLASSIC RESIDENTIAL SERVICES $1,799,000Active4 beds 6 baths4,812 sq. ft.
13453 Drytown Grove, Colorado Springs, CO 80921
MLS# 6899719Listed by: ENGEL & VOELKERS PIKES PEAK $1,995,000Active4 beds 4 baths5,379 sq. ft.
13525 Random Ridge View, Colorado Springs, CO 80921
MLS# 7332150Listed by: THE CUTTING EDGE $725,000Active4 beds 4 baths3,096 sq. ft.
2061 Ruffino Drive, Colorado Springs, CO 80921
MLS# 2835260Listed by: ENGEL & VOELKERS PIKES PEAK $650,000Pending3 beds 3 baths3,702 sq. ft.
13115 Cake Bread Heights, Colorado Springs, CO 80921
MLS# 5368403Listed by: THE PLATINUM GROUP $544,999Pending3 beds 3 baths2,739 sq. ft.
13138 Diamond Edge Way, Colorado Springs, CO 80921
MLS# 3399973Listed by: KELLER WILLIAMS REAL ESTATE $640,000Active4 beds 4 baths3,096 sq. ft.
2086 Villa Creek Cir, Colorado Springs, CO 80921
MLS# 9828926Listed by: HomeSmart Realty $790,000Pending6 beds 4 baths4,411 sq. ft.
1112 Spectrum Loop, Colorado Springs, CO 80921
MLS# 1409659Listed by: EXP REALTY LLC $686,000Pending-- beds -- baths
13641 Frost Bitten Grove, Colorado Springs, CO 80921
MLS# 5592797Listed by: CLASSIC RESIDENTIAL SERVICES $899,900Active6 beds 4 baths4,404 sq. ft.
Address Withheld By Seller, Colorado Springs, CO 80921
MLS# 8848283Listed by: Stiltner Realty, Inc. $1,150,000Active5 beds 5 baths4,507 sq. ft.
2402 Parma Court, Colorado Springs, CO 80921
MLS# 1027723Listed by: KELLER WILLIAMS PARTNERS $1,245,000Active6 beds 5 baths5,126 sq. ft.
12498 Cloudy Bay Drive, Colorado Springs, CO 80921
MLS# 8403218Listed by: THE INNOVATIVE GROUP, LLC $2,050,000Active5 beds 4 baths5,560 sq. ft.
1575 Vine Cliff Heights, Colorado Springs, CO 80921
MLS# 6162710Listed by: NAV REAL ESTATE $599,900Pending4 beds 3 baths2,730 sq. ft.
12988 Cupcake Heights, Colorado Springs, CO 80921
MLS# 6660355Listed by: THE CUTTING EDGE $1,089,000Active4 beds 4 baths3,794 sq. ft.
12598 Pensador Drive, Colorado Springs, CO 80921
MLS# 2579770Listed by: REAL BROKER, LLC DBA REAL $1,499,998Active5 beds 4 baths5,233 sq. ft.
2015 Walnut Creek Ct, Colorado Springs, CO 80921
MLS# 7426712Listed by: Engel & Voelkers Pikes Peak $1,065,000Active4 beds 3 baths4,166 sq. ft.
Address Withheld By Seller, Colorado Springs, CO 80921
MLS# 2546915Listed by: Finch & Gable Real Estate Company- Open Sat, 12am to 2pm
 $649,900Active5 beds 5 baths3,507 sq. ft.
2374 Cinnabar Rd, Colorado Springs, CO 80921
MLS# 1842018Listed by: Iconic Colorado Properties, LLC  $550,000Pending3 beds 2 baths1,521 sq. ft.
1909 Medici Lane, Colorado Springs, CO 80921
MLS# 2384898Listed by: EAGLE ONE REAL ESTATE LLC $1,449,000Active5 beds 4 baths4,668 sq. ft.
12544 Bosa Court, Colorado Springs, CO 80921
MLS# 5502377Listed by: THE PLATINUM GROUP $675,000Pending4 beds 3 baths2,926 sq. ft.
1926 Villa Creek Circle, Colorado Springs, CO 80921
MLS# 9695384Listed by: EXP REALTY LLC $750,000Active4 beds 3 baths3,446 sq. ft.
13010 Penfold Drive, Colorado Springs, CO 80921
MLS# 4634738Listed by: THE PLATINUM GROUP $640,000Active6 beds 4 baths3,381 sq. ft.
13475 Canyons Edge Dr, Colorado Springs, CO 80921
MLS# 1603871Listed by: eXp Realty, LLC $599,000Active4 beds 3 baths2,690 sq. ft.
13015 Cake Bread Heights, Colorado Springs, CO 80921
MLS# 7263074Listed by: PRO FLAT FEE REALTY LLC $774,999Pending4 beds 4 baths3,611 sq. ft.
13494 Crane Canyon Loop, Colorado Springs, CO 80921
MLS# 7883496Listed by: KD CAPITAL $774,999Active4 beds 4 baths3,611 sq. ft.
13494 Crane Canyon Loop, Colorado Springs, CO 80921
MLS# 6942826Listed by: KD CAPITAL $1,699,999Active6 beds 6 baths6,022 sq. ft.
Address Withheld By Seller, Colorado Springs, CO 80921
MLS# 3151326Listed by: Mackenzie Jackson LLC $974,900Pending4 beds 4 baths4,193 sq. ft.
2014 Bent Creek Drive, Colorado Springs, CO 80921
MLS# 1939822Listed by: MERCIE REAL ESTATE $2,376,080Pending4 beds 5 baths5,026 sq. ft.
13577 Pride Mountain Drive, Colorado Springs, CO 80921
MLS# 5083996Listed by: REMAX PROPERTIES $1,015,000Active6 beds 6 baths4,816 sq. ft.
1449 Yellow Tail Dr, Colorado Springs, CO 80921
MLS# 3438246Listed by: eXp Realty, LLC $1,090,000Active6 beds 5 baths4,420 sq. ft.
13610 Kitty Joe Court, Colorado Springs, CO 80921
MLS# 9422980Listed by: REAL BROKER, LLC DBA REAL $574,900Active5 beds 3 baths2,974 sq. ft.
960 Fire Rock Place, Colorado Springs, CO 80921
MLS# 5629051Listed by: KELLER WILLIAMS DTC $725,000Pending4 beds 5 baths3,674 sq. ft.
13084 Cupcake Heights, Colorado Springs, CO 80921
MLS# 5424015Listed by: THE PLATINUM GROUP $525,000Pending5 beds 3 baths3,145 sq. ft.
1385 Diamond Rim Drive, Colorado Springs, CO 80921
MLS# 8526089Listed by: EXP REALTY LLC $1,230,201Pending5 beds 5 baths4,834 sq. ft.
12353 Mionetto Court, Colorado Springs, CO 80921
MLS# 4829070Listed by: NON MEMBER $1,041,000Pending5 beds 4 baths3,588 sq. ft.
12541 Cavit Court, Colorado Springs, CO 80921
MLS# 9445402Listed by: CLASSIC RESIDENTIAL SERVICES $815,000Pending5 beds 3 baths3,495 sq. ft.
13445 Cedarville Way, Colorado Springs, CO 80921
MLS# 8840213Listed by: ERA SHIELDS REAL ESTATE $1,500,000Active6 beds 5 baths5,040 sq. ft.
13625 Random Ridge View, Colorado Springs, CO 80921
MLS# 8503360Listed by: EXP REALTY LLC $950,000Active4 beds 3 baths4,328 sq. ft.
2351 Limerick Court, Colorado Springs, CO 80921
MLS# 3527652Listed by: ENGEL & VOELKERS PIKES PEAK $995,000Active4 beds 3 baths3,417 sq. ft.
1131 Old North Gate Road, Colorado Springs, CO 80921
MLS# 9095246Listed by: COLDWELL BANKER REALTY $1,375,000Active6 beds 4 baths5,265 sq. ft.
2180 Rocking Horse Court, Colorado Springs, CO 80921
MLS# 4094502Listed by: ERA SHIELDS REAL ESTATE $1,149,990Active5 beds 5 baths4,876 sq. ft.
2030 Mallorca Way, Colorado Springs, CO 80921
MLS# 1900221Listed by: ACTION TEAM REALTY $1,308,057Pending6 beds 7 baths5,174 sq. ft.
2451 Antica Court, Colorado Springs, CO 80921
MLS# 5234823Listed by: CLASSIC RESIDENTIAL SERVICES $1,220,000Pending4 beds 4 baths3,880 sq. ft.
13658 Kitty Joe Court, Colorado Springs, CO 80921
MLS# 7108429Listed by: RUSS J GORDON $765,000Pending4 beds 3 baths3,530 sq. ft.
2513 Cinnabar Road, Colorado Springs, CO 80921
MLS# 4465306Listed by: MOUNTAIN SPRINGS REALTY, LLC $1,189,000Active5 beds 5 baths4,876 sq. ft.
1955 Walnut Creek Court, Colorado Springs, CO 80921
MLS# 3737155Listed by: KELLER WILLIAMS PARTNERS $865,000Pending4 beds 3 baths3,198 sq. ft.
2267 Merlot Drive, Colorado Springs, CO 80921
MLS# 5631513Listed by: ENGEL & VOELKERS PIKES PEAK $879,000Pending5 beds 4 baths4,536 sq. ft.
12630 Chianti Court, Colorado Springs, CO 80921
MLS# 9383456Listed by: KELLER WILLIAMS CLIENTS CHOICE REALTY $1,695,000Pending4 beds 5 baths4,642 sq. ft.
13632 Stony Hill Point, Colorado Springs, CO 80921
MLS# 1390898Listed by: REAL BROKER, LLC DBA REAL $725,000Active5 beds 4 baths3,882 sq. ft.
13105 Canyons Edge Drive, Colorado Springs, CO 80921
MLS# 4639848Listed by: COLDWELL BANKER REALTY $499,994Active-- beds -- baths
13364 Positano Point, Colorado Springs, CO 80921
MLS# 9486228Listed by: QUANTUM RESIDENTIAL GROUP, LLC $825,000Pending4 beds 3 baths3,779 sq. ft.
1382 Morro Bay Way, Colorado Springs, CO 80921
MLS# 1837278Listed by: ERA SHIELDS REAL ESTATE $1,135,950Active4 beds 4 baths4,155 sq. ft.
2064 Walnut Creek Court, Colorado Springs, CO 80921
MLS# 8171259Listed by: BOLD STREET PROPERTIES, LLC $1,050,000Pending7 beds 4 baths4,322 sq. ft.
2042 Bent Creek Drive, Colorado Springs, CO 80921
MLS# 9581881Listed by: SOLID ROCK REALTY $1,090,000Pending4 beds 3 baths4,150 sq. ft.
1877 Walnut Creek Court, Colorado Springs, CO 80921
MLS# 3241657Listed by: HOMESMART $1,103,683Pending4 beds 3 baths4,557 sq. ft.
13518 Pride Mountain Drive, Colorado Springs, CO 80921
MLS# 4055120Listed by: NEW HOME STAR LLC $1,189,950Pending5 beds 4 baths4,112 sq. ft.
1902 Walnut Creek Court, Colorado Springs, CO 80921
MLS# 9664090Listed by: BOLD STREET PROPERTIES, LLC $654,000Pending4 beds 3 baths3,027 sq. ft.
2553 Cinnabar Road, Colorado Springs, CO 80921
MLS# 6788551Listed by: MOUNTAIN SPRINGS REALTY, LLC $1,149,000Pending5 beds 5 baths4,507 sq. ft.
12514 Bosa Court, Colorado Springs, CO 80921
MLS# 7703100Listed by: CLASSIC RESIDENTIAL SERVICES $1,890,287Active4 beds 4 baths4,900 sq. ft.
13457 Pride Mountain Drive, Colorado Springs, CO 80921
MLS# 5579810Listed by: NEW HOME STAR LLC $699,000Pending4 beds 4 baths3,096 sq. ft.
2127 Villa Creek Circle, Colorado Springs, CO 80921
MLS# 8504005Listed by: THE PLATINUM GROUP $810,000Pending6 beds 4 baths4,239 sq. ft.
13773 Lazy Creek Road, Colorado Springs, CO 80921
MLS# 8796272Listed by: KELLER WILLIAMS CLIENTS CHOICE REALTY $915,000Active5 beds 4 baths4,751 sq. ft.
1053 Crystal Basin Drive, Colorado Springs, CO 80921
MLS# 7638744Listed by: REMAX PROPERTIES $798,000Active1.16 Acres
1725 Vine Cliff Heights, Colorado Springs, CO 80921
MLS# 5464460Listed by: VILLAGREE LLC $4,200,000Pending7 beds 9 baths8,044 sq. ft.
1455 Vine Cliff Heights, Colorado Springs, CO 80921
MLS# 5625804Listed by: 6035 REAL ESTATE GROUP $850,000Active5 beds 3 baths4,312 sq. ft.
13435 Cedarville Way, Colorado Springs, CO 80921
MLS# 1616945Listed by: LIV SOTHEBY'S INTERNATIONAL REALTY
Local realty services provided by:CENTURY 21 Top Dog Properties, CENTURY 21 Cornerstone, CENTURY 21 Signature Realty
The information being provided by Pikes Peak REALTOR® Services Corp. is for the consumer's personal, non-commercial use and may not be used for any purpose other than to identify prospective properties consumer may be interested in purchasing. Any information relating to real estate for sale referenced on this web site comes from the Internet Data Exchange (IDX) program of the Pikes Peak REALTOR® Services Corp.. CENTURY 21 Top Dog Properties is not a Multiple Listing Service (MLS), nor does it offer MLS access. This website is a service of CENTURY 21 Top Dog Properties, a broker participant of Pikes Peak REALTOR® Services Corp.. This web site may reference real estate listing(s) held by a brokerage firm other than the broker and/or agent who owns this web site.
The accuracy of all information, regardless of source, including but not limited to open house information, square footages and lot sizes, is deemed reliable but not guaranteed and should be personally verified through personal inspection by and/or with the appropriate professionals. The data contained herein is copyrighted by Pikes Peak REALTOR® Services Corp. and is protected by all applicable copyright laws. Any unauthorized dissemination of this information is in violation of copyright laws and is strictly prohibited.
The real estate listing information and related content displayed on this site is provided exclusively for consumers' personal, non-commercial use and may not be used for any purpose other than to identify prospective properties consumers may be interested in purchasing. This information and related content is deemed reliable but is not guaranteed accurate by the Pikes Peak REALTOR® Services Corp.
Copyright 2026 Pikes Peak REALTOR® Services Corp. All rights reserved.
The real estate listing information and related content displayed on this site is provided exclusively for consumer's personal, non-commercial use and may not be used for any purpose other than to identify prospective properties consumers may be interested in purchasing. This information and related content is deemed reliable but is not guaranteed accurate by Information and Real Estate Services, LLC.
Information source: Information and Real Estate Services, LLC. Provided for limited non-commercial use only under IRES Rules © Copyright IRES. The information being provided by Information and Real Estate Services is for the consumer's personal, non-commercial use and may not be used for any purpose other than to identify prospective properties consumer may be interested in purchasing. Any information relating to real estate for sale referenced on this web site comes from the Internet Data Exchange (IDX) program of the Information and Real Estate Services. This web site may reference real estate listing(s) held by a brokerage firm other than the broker and/or agent who owns this web site.
The accuracy of all information, regardless of source, including but not limited to open house information, square footages and lot sizes, is deemed reliable but not guaranteed and should be personally verified through personal inspection by and/or with the appropriate professionals. The data contained herein is copyrighted by Information and Real Estate Services and is protected by all applicable copyright laws. Any unauthorized dissemination of this information is in violation of copyright laws and is strictly prohibited.
Based on information submitted to the MLS GRID as of March 19, 2026 02:16 PM. All data is obtained from various sources and may not have been verified by broker or MLS GRID. Supplied Open House information is subject to change without notice. All information should be independently reviewed and verified for accuracy. Properties may or may not be listed by the office/agent presenting the information.
Popular neighborhoods near Flying Horse Ranch, Colorado Springs, CO
Zip codes near Flying Horse Ranch, Colorado Springs, CO
- 80132 homes for sale
- 80133 homes for sale
- 80903 homes for sale
- 80904 homes for sale
- 80907 homes for sale
- 80908 homes for sale
- 80909 homes for sale
- 80915 homes for sale
- 80917 homes for sale
- 80918 homes for sale
- 80919 homes for sale
- 80920 homes for sale
- 80921 homes for sale
- 80922 homes for sale
- 80923 homes for sale
- 80924 homes for sale
- 80927 homes for sale
- 80938 homes for sale
- 80939 homes for sale
- 80951 homes for sale
Counties near Flying Horse Ranch, Colorado Springs, CO
- Adams County homes for sale
- Arapahoe County homes for sale
- Boulder County homes for sale
- Broomfield County homes for sale
- Chaffee County homes for sale
- Clear Creek County homes for sale
- Crowley County homes for sale
- Custer County homes for sale
- Denver County homes for sale
- Douglas County homes for sale
- El Paso County homes for sale
- Elbert County homes for sale
- Fremont County homes for sale
- Gilpin County homes for sale
- Jefferson County homes for sale
- Lincoln County homes for sale
- Park County homes for sale
- Pueblo County homes for sale
- Summit County homes for sale
- Teller County homes for sale
Protect your home and budget from life's surprises with an Assurant Home Warranty, backed by a partner that supports you through every step of homeownership. Explore Plans.
©2026 Century 21 Real Estate LLC. All rights reserved. CENTURY 21®, the CENTURY 21 Logo and C21® are service marks owned by Century 21 Real Estate LLC. Century 21 Real Estate LLC fully supports the principles of the Fair Housing Act and the Equal Opportunity Act. Each office is independently owned and operated. Listing information is deemed reliable but not guaranteed accurate.