- Archer Heights, Chicago homes for sale
- Austin, Chicago homes for sale
- Belmont Cragin, Chicago homes for sale
- Clearing, Chicago homes for sale
- Dunning, Chicago homes for sale
- Field Park, Western Springs homes for sale
- Fifth City, Chicago homes for sale
- Galewood, Elmwood Park homes for sale
- Garfield Park, Chicago homes for sale
- Garfield Ridge, Chicago homes for sale
- Hermosa, Chicago homes for sale
- Homan Square, Chicago homes for sale
- Humboldt Park, Chicago homes for sale
- K-Town, Chicago homes for sale
- Little Village, Chicago homes for sale
- Montclare, Elmwood Park homes for sale
- North Lawndale, Chicago homes for sale
- Northwest Side, Chicago homes for sale
- Portage Park, Chicago homes for sale
- West Side, Chicago homes for sale
Forest Park, IL - homes for sale
55 of 55 results displayed
- New
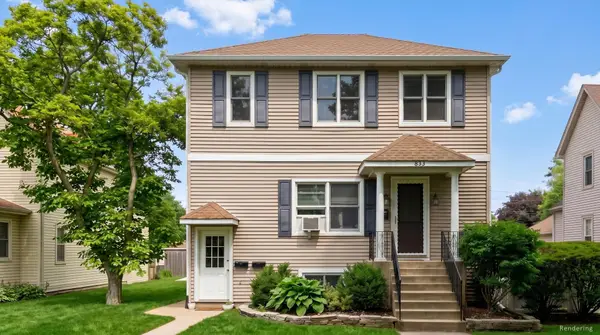
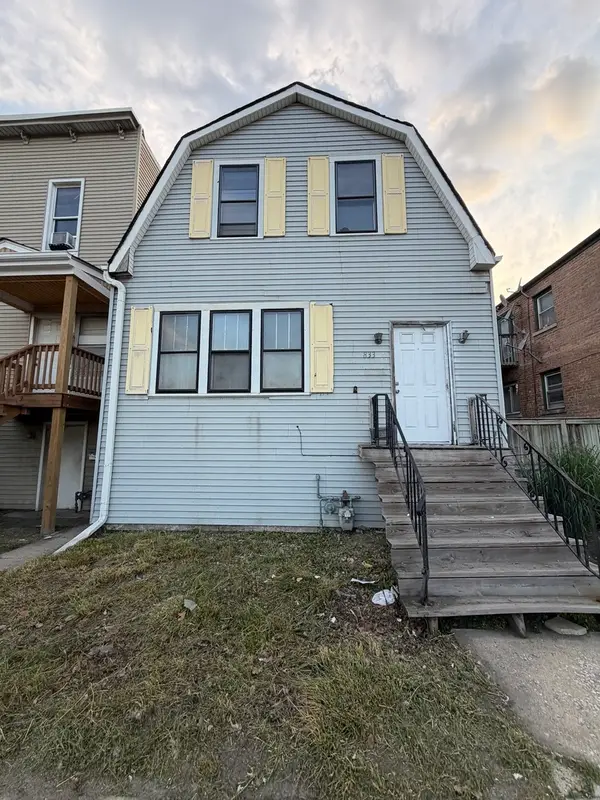 $124,999Active3 beds 3 baths1,886 sq. ft.
833 Harlem Avenue, Forest Park, IL 60130
MLS# 12665304Listed by: HOMESMART CONNECT LLC
- Open Sun, 12 to 2pmNew
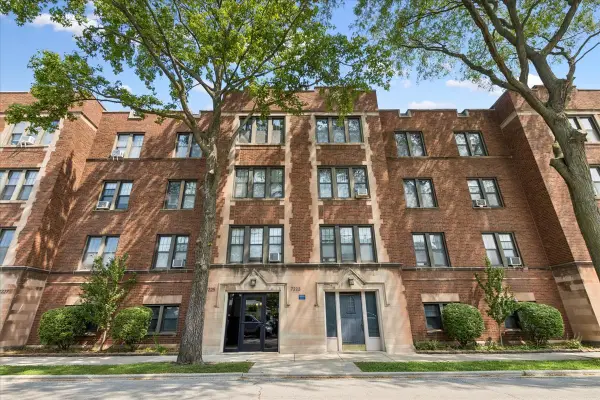 $169,000Active1 beds 1 baths604 sq. ft.
7223 Adams Street #3, Forest Park, IL 60130
MLS# 12703951Listed by: BAIRD & WARNER - New
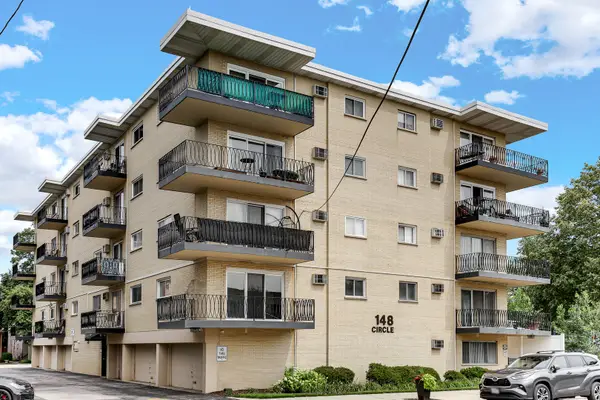 $169,990Active2 beds 2 baths1,000 sq. ft.
148 Circle Avenue #201, Forest Park, IL 60130
MLS# 12702800Listed by: KELLER WILLIAMS INFINITY - New
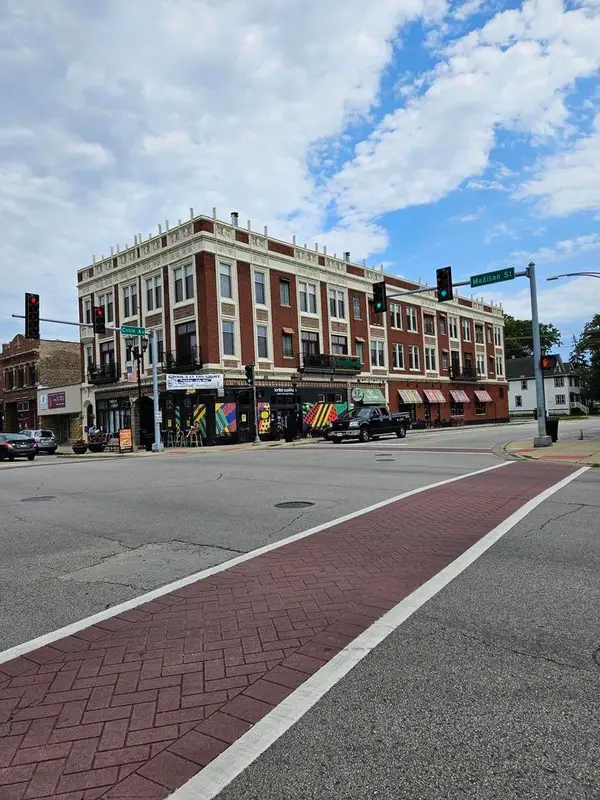 $315,000Active2 beds 3 baths1,400 sq. ft.
7320 Madison Street #6, Forest Park, IL 60130
MLS# 12701810Listed by: COLDWELL BANKER REALTY - New
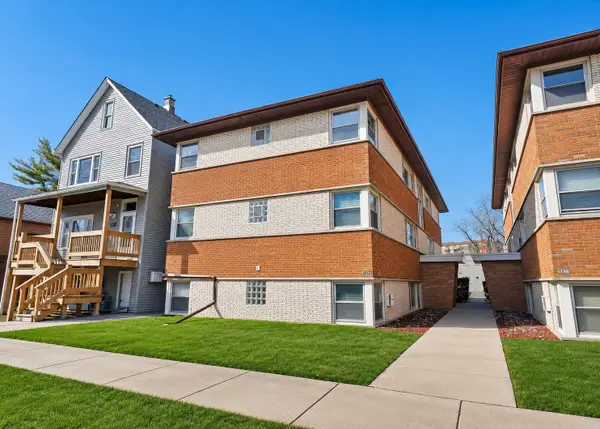 $192,000Active2 beds 1 baths700 sq. ft.
839 Lathrop Avenue #1E, Forest Park, IL 60130
MLS# 12705940Listed by: REALTY OF AMERICA, LLC - New
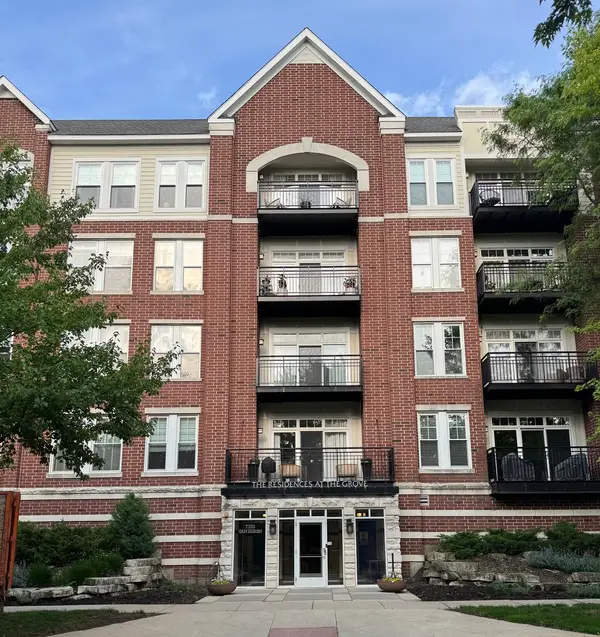
 $269,900Active1 beds 1 baths850 sq. ft.
7753 Van Buren Street #305, Forest Park, IL 60130
MLS# 12703169Listed by: CENTURY 21 NUVISION REAL ESTATE - New
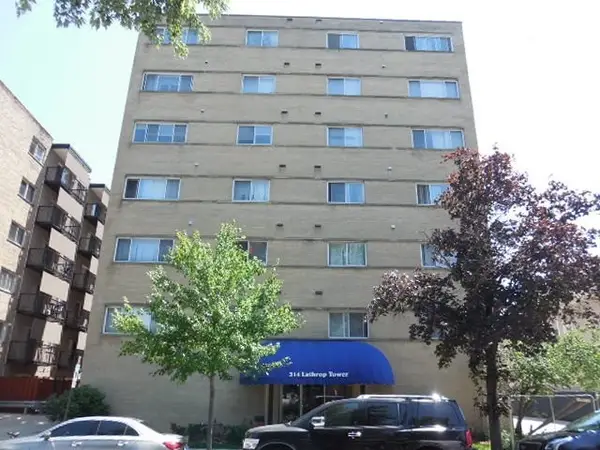 $83,000Active1 beds 1 baths602 sq. ft.
314 Lathrop Avenue #203, Forest Park, IL 60130
MLS# 12701207Listed by: BEEMY BROKER ILLINOIS LLC - New
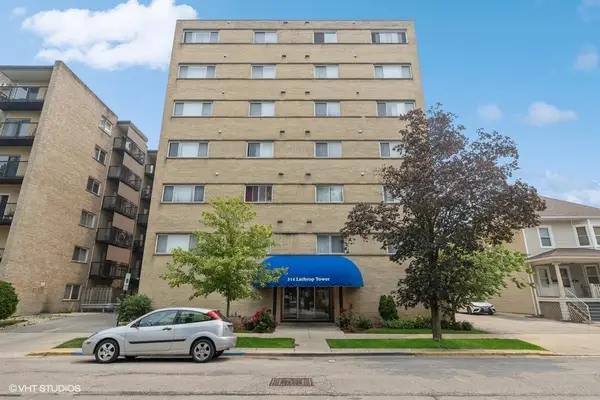 $115,000Active1 beds 1 baths750 sq. ft.
314 Lathrop Avenue #303, Forest Park, IL 60130
MLS# 12699358Listed by: BAIRD & WARNER - New
 $159,900Active2 beds 1 baths1,000 sq. ft.
600 Elgin Avenue #3B, Forest Park, IL 60130
MLS# 12699690Listed by: DUARTE REALTY COMPANY  $435,000Pending3 beds 2 baths1,659 sq. ft.
1101 Beloit Avenue, Forest Park, IL 60130
MLS# 12696692Listed by: COMPASS- New
 $155,000Active1 beds 1 baths612 sq. ft.
7428 Washington Street #605, Forest Park, IL 60130
MLS# 12697827Listed by: COLDWELL BANKER REAL ESTATE GROUP - New
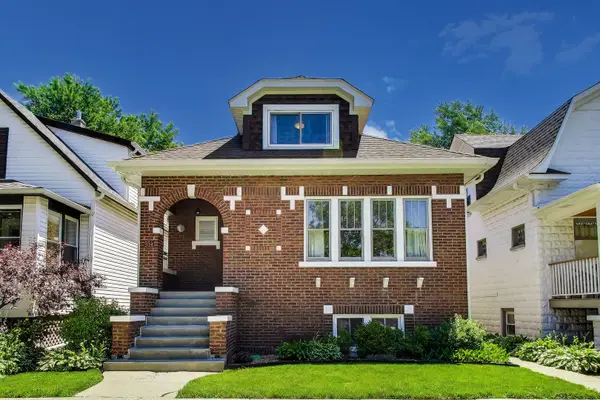
 $510,000Active5 beds 3 baths2,100 sq. ft.
827 Thomas Avenue, Forest Park, IL 60130
MLS# 12698298Listed by: HOMESMART CONNECT LLC 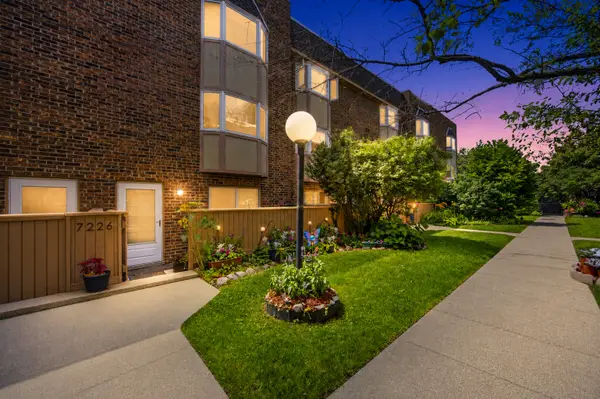 $374,900Pending2 beds 3 baths1,572 sq. ft.
7226 Washington Street #A, Forest Park, IL 60130
MLS# 12695489Listed by: HOMESMART REALTY GROUP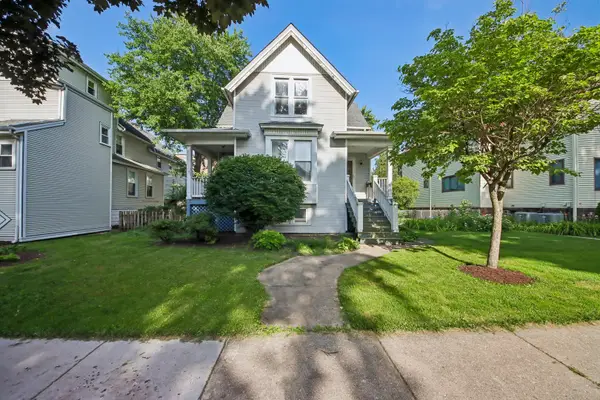 $499,000Pending4 beds 2 baths2,160 sq. ft.
537 Ferdinand Avenue, Forest Park, IL 60130
MLS# 12696204Listed by: BERKSHIRE HATHAWAY HOMESERVICES CHICAGO- New
 $718,000Active6 beds 3 baths
833 Elgin Avenue, Forest Park, IL 60130
MLS# 12665204Listed by: IDEAL LOCATION OAK PARK RE 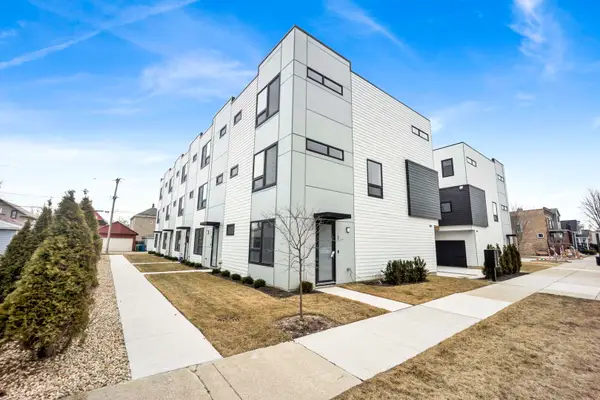 $588,000Active3 beds 3 baths2,289 sq. ft.
944 Beloit Avenue #4, Forest Park, IL 60130
MLS# 12694283Listed by: COMPASS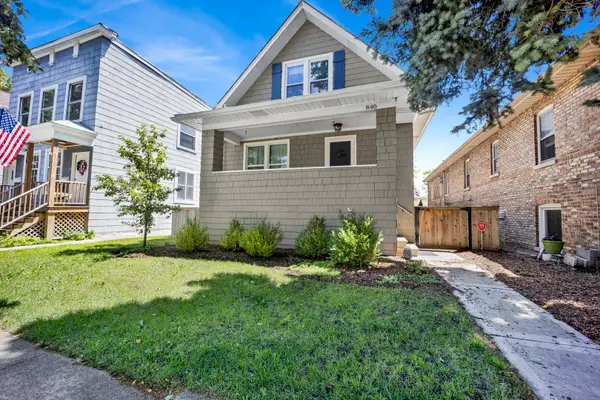 $599,000Active4 beds 3 baths
840 Beloit Avenue, Forest Park, IL 60130
MLS# 12691897Listed by: FULTON GRACE REALTY $125,000Active1 beds 1 baths800 sq. ft.
7432 W Washington Street #604, Forest Park, IL 60130
MLS# 12692096Listed by: PREMIER AGENT NETWORK ILLINOIS LLC $624,000Active5 beds 3 baths
244 Des Plaines Avenue, Forest Park, IL 60130
MLS# 12690051Listed by: EXP REALTY $550,000Active4 beds 2 baths2,022 sq. ft.
831 Circle Avenue, Forest Park, IL 60130
MLS# 12664746Listed by: BERKSHIRE HATHAWAY HOMESERVICES CHICAGO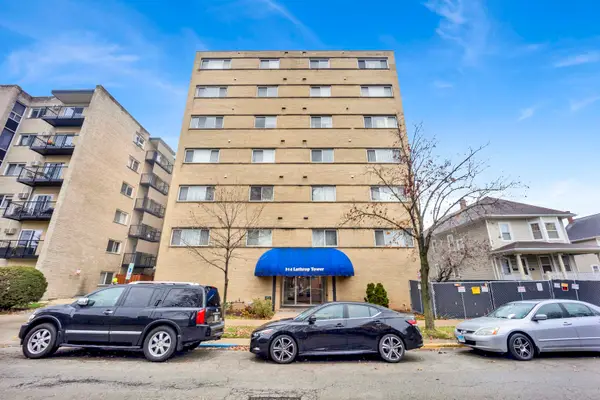 $145,000Pending2 beds 2 baths960 sq. ft.
314 Lathrop Avenue #407, Forest Park, IL 60130
MLS# 12687393Listed by: COMPASS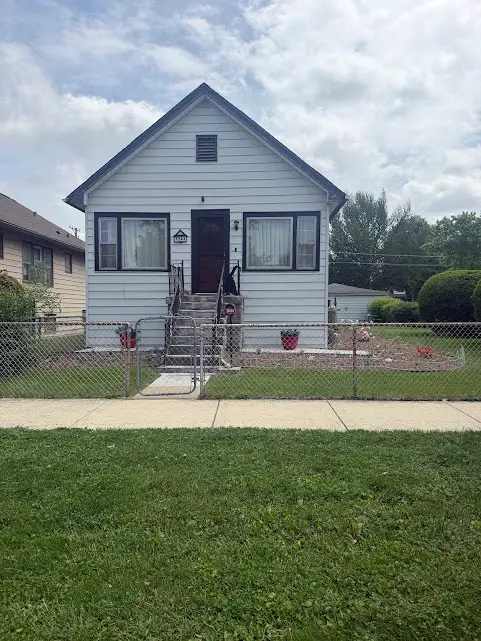 $318,000Active2 beds 2 baths968 sq. ft.
1044 Ferdinand Avenue, Forest Park, IL 60130
MLS# 12653183Listed by: BETTER HOMES & GARDENS REAL ESTATE CONNECTIONS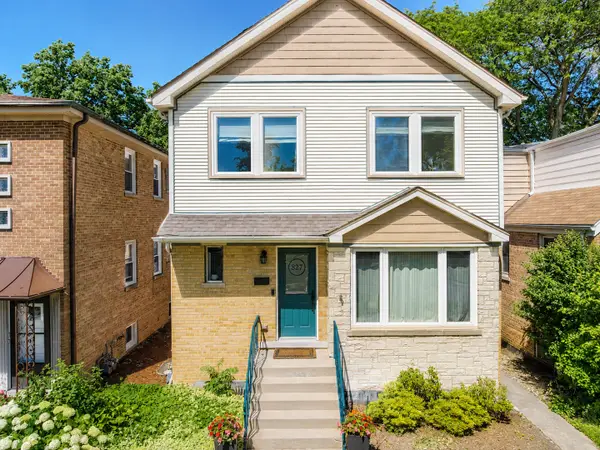 $579,000Pending5 beds 3 baths
827 Lathrop Avenue, Forest Park, IL 60130
MLS# 12684510Listed by: @PROPERTIES CHRISTIE'S INTERNATIONAL REAL ESTATE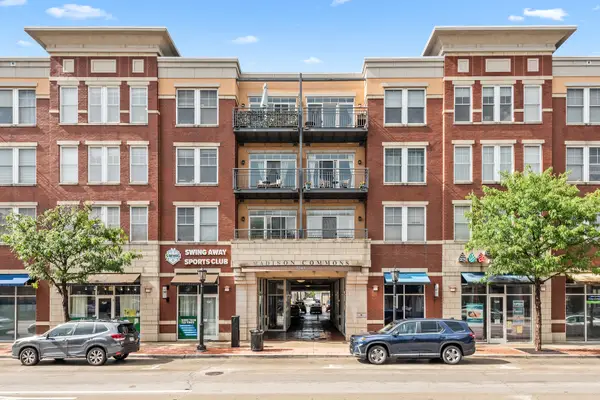 $279,000Pending1 beds 1 baths
7243 Madison Street #204, Forest Park, IL 60130
MLS# 12678542Listed by: BERKSHIRE HATHAWAY HOMESERVICES CHICAGO $419,000Pending3 beds 2 baths1,254 sq. ft.
1105 Dunlop Avenue, Forest Park, IL 60130
MLS# 12681360Listed by: JASIEN REALTY $259,900Pending1 beds 1 baths860 sq. ft.
7757 Van Buren Street #413, Forest Park, IL 60130
MLS# 12676452Listed by: MORPHEASY REALTY- Open Sat, 11am to 1pm
 $375,000Active4 beds 1 baths1,539 sq. ft.
934 Circle Avenue, Forest Park, IL 60130
MLS# 12670615Listed by: COMPASS  $94,500Pending-- beds 1 baths400 sq. ft.
7216 Jackson Boulevard #GC, Forest Park, IL 60130
MLS# 12679041Listed by: COLDWELL BANKER REALTY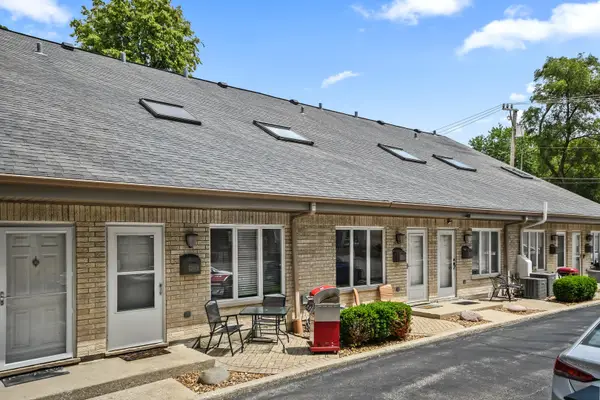 $220,000Active1 beds 2 baths
7248 Dixon Street #B, Forest Park, IL 60130
MLS# 12633958Listed by: BERKSHIRE HATHAWAY HOMESERVICES CHICAGO $779,000Pending4 beds 4 baths2,700 sq. ft.
337 Marengo Avenue, Forest Park, IL 60130
MLS# 12675365Listed by: @PROPERTIES CHRISTIE'S INTERNATIONAL REAL ESTATE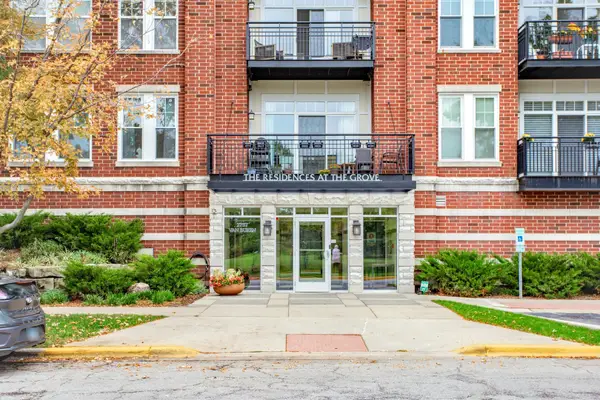 $349,900Active2 beds 2 baths1,289 sq. ft.
7757 Van Buren Street #511, Forest Park, IL 60130
MLS# 12673998Listed by: BERKSHIRE HATHAWAY HOMESERVICES CHICAGO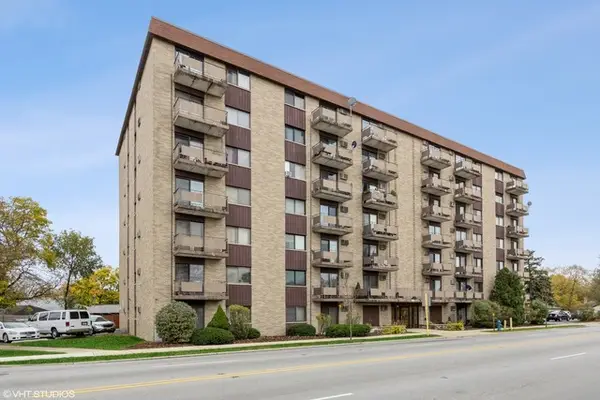 $159,900Pending1 beds 1 baths700 sq. ft.
850 Des Plaines Avenue #504, Forest Park, IL 60130
MLS# 12670826Listed by: BERKSHIRE HATHAWAY HOMESERVICES STARCK REAL ESTATE- Open Sat, 12 to 2pm
 $149,999Active2 beds 1 baths920 sq. ft.
1101 Harlem Avenue #203, Forest Park, IL 60130
MLS# 12663340Listed by: CHICAGOLAND BROKERS, INC.  $429,900Pending3 beds 2 baths1,400 sq. ft.
925 Harlem Avenue, Forest Park, IL 60130
MLS# 12660777Listed by: BAIRD & WARNER $199,000Active1 beds 1 baths
7225 Adams Street #2, Forest Park, IL 60130
MLS# 12664254Listed by: ESM REALTY GROUP $230,000Pending3 beds 1 baths826 sq. ft.
826 Circle Avenue, Forest Park, IL 60130
MLS# 12668934Listed by: CHICAGO AREA REALTY INC $490,000Active5 beds 2 baths2,500 sq. ft.
1503 Elgin Avenue, Forest Park, IL 60130
MLS# 12635159Listed by: MIDWEST SIGNATUREPROPERTIES CO $540,000Pending4 beds 3 baths2,100 sq. ft.
604 Hannah Avenue, Forest Park, IL 60130
MLS# 12667873Listed by: KELLER WILLIAMS PREMIERE PROPERTIES $229,900Active6 beds 2 baths1,686 sq. ft.
915 Ferdinand Avenue, Forest Park, IL 60130
MLS# 12666526Listed by: RE/MAX CITYVIEW $350,000Pending4 beds 2 baths1,400 sq. ft.
1005 Hannah Avenue, Forest Park, IL 60130
MLS# 12665245Listed by: @PROPERTIES CHRISTIE'S INTERNATIONAL REAL ESTATE $224,900Pending2 beds 2 baths700 sq. ft.
7525 Adams Street #1W, Forest Park, IL 60130
MLS# 12672878Listed by: CENTURY 21 NEW BEGINNINGS $345,000Pending3 beds 2 baths1,100 sq. ft.
813 Circle Avenue, Forest Park, IL 60130
MLS# 12650668Listed by: PLATINUM PARTNERS REALTORS $484,900Pending3 beds 2 baths1,925 sq. ft.
220 Elgin Avenue, Forest Park, IL 60130
MLS# 12653769Listed by: BERKSHIRE HATHAWAY HOMESERVICES CHICAGO $690,000Active6 beds 4 baths
940 Troost Avenue, Forest Park, IL 60130
MLS# 12644767Listed by: TOP CARE REALTY LLC $359,900Active2 beds 2 baths1,100 sq. ft.
7243 Madison Street #211, Forest Park, IL 60130
MLS# 12649395Listed by: GREEN EQUITIES LLC $550,000Pending4 beds 3 baths2,144 sq. ft.
1102 Marengo Avenue, Forest Park, IL 60130
MLS# 12639507Listed by: BERKSHIRE HATHAWAY HOMESERVICES CHICAGO $225,000Active3 beds 2 baths1,334 sq. ft.
Address Withheld By Seller, Forest Park, IL 60130
MLS# 12641763Listed by: BAIRD & WARNER $154,200Pending1 beds 1 baths900 sq. ft.
Address Withheld By Seller, Forest Park, IL 60130
MLS# 12619521Listed by: COLDWELL BANKER REALTY $459,000Pending4 beds 3 baths2,531 sq. ft.
907 Ferdinand Avenue, Forest Park, IL 60130
MLS# 12596140Listed by: EXP REALTY $625,000Active3 beds 3 baths2,289 sq. ft.
944 Beloit Avenue #2, Forest Park, IL 60130
MLS# 12579445Listed by: COMPASS $129,900Active1 beds 1 baths700 sq. ft.
7443 Washington Street #307, Forest Park, IL 60130
MLS# 12511306Listed by: COLDWELL BANKER REAL ESTATE GROUP $109,000Active1 beds 1 baths650 sq. ft.
314 Lathrop Avenue #604, Forest Park, IL 60130
MLS# 12505859Listed by: COMPASS $129,000Pending0 Acres
836 Circle Avenue, Forest Park, IL 60130
MLS# 12481711Listed by: RE/MAX LOYALTY $450,000Pending4 beds 2 baths1,935 sq. ft.
442 Hannah Avenue, Forest Park, IL 60130
MLS# 12471892Listed by: TEVA REALTY- Open Sun, 1 to 3pm
 $575,000Active5 beds 3 baths
7415 Dixon Street, Forest Park, IL 60130
MLS# 12452749Listed by: BERKSHIRE HATHAWAY HOMESERVICES CHICAGO
Local realty services provided by:CENTURY 21 Circle
Copyright 2026 Midwest Real Estate Data LLC. All rights reserved. The data relating to real estate for sale on this web site comes in part from the Broker Reciprocity Program of the Midwest Real Estate Data LLC. Listing information is deemed reliable but not guaranteed.
Neighborhoods near Forest Park, IL
Zip codes near Forest Park, IL
- 60104 homes for sale
- 60130 homes for sale
- 60153 homes for sale
- 60154 homes for sale
- 60155 homes for sale
- 60160 homes for sale
- 60165 homes for sale
- 60171 homes for sale
- 60301 homes for sale
- 60302 homes for sale
- 60304 homes for sale
- 60305 homes for sale
- 60402 homes for sale
- 60513 homes for sale
- 60526 homes for sale
- 60534 homes for sale
- 60546 homes for sale
- 60644 homes for sale
- 60707 homes for sale
- 60804 homes for sale
Popular searches near Forest Park, IL
- Bellwood homes for sale
- Berwyn homes for sale
- Broadview homes for sale
- Brookfield homes for sale
- Cicero homes for sale
- Elmwood Park homes for sale
- La Grange Park homes for sale
- Lyons homes for sale
- Maywood homes for sale
- Melrose Park homes for sale
- North Riverside homes for sale
- Oak Park homes for sale
- Oak Park Township homes for sale
- Proviso homes for sale
- River Forest homes for sale
- River Grove homes for sale
- Riverside homes for sale
- Riverside Township homes for sale
- Stone Park homes for sale
- Westchester homes for sale
Protect your home and budget from life's surprises with an Assurant Home Warranty, backed by a partner that supports you through every step of homeownership. Explore Plans.
©2026 Century 21 Real Estate LLC. All rights reserved. CENTURY 21®, the CENTURY 21 Logo and C21® are service marks owned by Century 21 Real Estate LLC. Century 21 Real Estate LLC fully supports the principles of the Fair Housing Act and the Equal Opportunity Act. Each office is independently owned and operated. Listing information is deemed reliable but not guaranteed accurate.