- Alamosa homes for sale
- Alamosa East homes for sale
- Blanca homes for sale
- Boncarbo homes for sale
- Costilla homes for sale
- Cuchara homes for sale
- Fort Garland homes for sale
- Garcia homes for sale
- Gardner homes for sale
- Jaroso homes for sale
- La Veta homes for sale
- Mesita homes for sale
- Mosca homes for sale
- Mosca-Hooper homes for sale
- San Acacio homes for sale
- San Luis homes for sale
- Sanford homes for sale
- Stonewall Gap homes for sale
- Walsenburg homes for sale
- Weston homes for sale
Local realty services provided by:CENTURY 21 CapRock Real Estate, CENTURY 21 Community First, CENTURY 21 Top Dog Properties
81133, CO - homes for sale
300 of 506 results displayed
- New
 $15,000Active1.62 Acres
951 Van Fossan Lane, Fort Garland, CO 81133
MLS# 3793956Listed by: Code of the West Real Estate - New
 $9,500Active5.19 Acres
716 Slegers Circle, San Luis, CO 81152
MLS# 4927040Listed by: Werner Realty, Inc. - New
 $8,500Active5.01 Acres
1047 Lee Way, Fort Garland, CO 81123
MLS# 5580218Listed by: Werner Realty, Inc. - New
 $17,000Active5.07 Acres
3968 Kruesi Rd, Fort Garland, CO 81133
MLS# 2778136Listed by: Mtn. Meadows Realty - New
 $94,000Active10.24 Acres
3277 Talmage Rd, Fort Garland, CO 81133
MLS# 7745502Listed by: Werner Realty, Inc. - New
 $10,000Active2.32 Acres
218 Wergeles Pl, Fort Garland, CO 81133
MLS# 6429461Listed by: Fathom Realty Colorado LLC - New
 $19,900Active4.27 Acres
219 Wergeles Pl, Fort Garland, CO 81133
MLS# 9896665Listed by: Fathom Realty Colorado LLC - New
 $12,500Active1.44 Acres
1386 Emery Loop, Fort Garland, CO 81133
MLS# 5195648Listed by: Amber Lawrence Realty LLC - New
 $14,000Active1 Acres
768 Shepard Pl, Fort Garland, CO 81133
MLS# 7929081Listed by: Amber Lawrence Realty LLC - New
 $45,000Active1.68 Acres
2113 Packer Pl, Fort Garland, CO 81133
MLS# 4326587Listed by: Amber Lawrence Realty LLC - New
 $32,500Active11.85 Acres
2716 Sesame Rd, Fort Garland, CO 81133
MLS# 7819082Listed by: Colorado Realty & Land Co. - New
 $32,500Active16.94 Acres
6644 Phillips Rd, San Luis, CO 81152
MLS# 6204475Listed by: Mtn. Meadows Realty - New
 $15,000Active1.57 Acres
2874 Fery Loop, Fort Garland, CO 81133
MLS# 4839359Listed by: Code of the West Real Estate - New
 $14,000Active6.96 Acres
6078 Vreeland Rd, San Luis, CO 81152
MLS# 5938181Listed by: Fathom Realty Colorado LLC - New
 $564,000Active3 beds 3 baths2,491 sq. ft.
2842 Wendt Ln, Fort Garland, CO 81133
MLS# 7024510Listed by: Colorado Realty 4 Less, LLC - New
 $625,000Active3 beds 2 baths1,350 sq. ft.
27833 Co Rd Nn, Fort Garland, CO 81133
MLS# 3351323Listed by: Mtn. Meadows Realty - New
 $210,000Active84.17 Acres
369 Powers Rd, Fort Garland, CO 81133
MLS# 8173111Listed by: Mtn. Meadows Realty - New
 $42,500Active20.02 Acres
Lot 6076 Starkweather Road, San Luis, CO 81152
MLS# 4945363Listed by: MTN. MEADOWS REALTY
- New
 $17,000Active6.57 Acres
Lot 5273 Vivian Road, Fort Garland, CO 81133
MLS# 9592354Listed by: MTN. MEADOWS REALTY - New
 $11,999Active1.38 Acres
1177 Bechtel Pl, Fort Garland, CO 81133
MLS# 9139972Listed by: Mtn. Meadows Realty  $45,000Active19.44 Acres
Kawasaki, San Luis, CO 81152
MLS# 1835296Listed by: Werner Realty, Inc. $45,000Active19.44 Acres
Kawasaki, San Luis, CO 81152
MLS# 1835296Listed by: WERNER REALTY, INC. $15,000Active5.71 Acres
0 Schlueter Rd, Fort Garland, CO 81133
MLS# 6407431Listed by: Brackendale Realty Llc $12,000Active5.2 Acres
Address Withheld By Seller, Fort Garland, CO 81133
MLS# 8571001Listed by: Fathom Realty Colorado LLC $799,000Active3 beds 3 baths6,077 sq. ft.
4905 Jaffe Road, Fort Garland, CO 81133
MLS# 3897222Listed by: COLORADO REALTY & LAND CO. $32,000Active10.34 Acres
2153 Acapulco Rd, Fort Garland, CO 81133
MLS# 6184872Listed by: Colorado Realty & Land Co. $25,000Active15 Acres
6622 Clinton Rd, Fort Garland, CO 81133
MLS# 3845614Listed by: REMAX PROPERTIES $20,000Active16 Acres
Address Withheld By Seller, Fort Garland, CO 81133
MLS# 5614306Listed by: REMAX PROPERTIES $45,000Active22 Acres
Ryland Rd, Fort Garland, CO 81133
MLS# 6670810Listed by: REMAX PROPERTIES $17,000Active10 Acres
Preast, Fort Garland, CO 81133
MLS# 6924825Listed by: REMAX PROPERTIES $15,000Active2.76 Acres
960-961 Huntington Lane, Fort Garland, CO 81133
MLS# 3842061Listed by: MTN. MEADOWS REALTY $325,000Active2 beds 2 baths1,416 sq. ft.
906 Huntington Ln, Fort Garland, CO 81133
MLS# 3280223Listed by: Mtn. Meadows Realty $18,000Active6 Acres
Mallon Road, Fort Garland, CO 81133
MLS# 3304852Listed by: REMAX PROPERTIES $12,900Active5.08 Acres
LOT 940 Bateman, Fort Garland, CO 81133
MLS# 5862298Listed by: FATHOM REALTY COLORADO LLC $295,000Active2 beds 2 baths1,224 sq. ft.
2357 Benton Pl, Fort Garland, CO 81133
MLS# 2494616Listed by: Mtn. Meadows Realty $29,500Active5.47 Acres
6748 Starkweather Rd, San Luis, CO 81152
MLS# 5100012Listed by: Mtn. Meadows Realty $14,997Active5.05 Acres
Address Withheld By Seller, Fort Garland, CO 81133
MLS# 9912357Listed by: Werner Realty, Inc. $19,900Active5.02 Acres
Address Withheld By Seller, Fort Garland, CO 81133
MLS# 3122130Listed by: Werner Realty, Inc. $750,000Active5 beds 3 baths3,360 sq. ft.
2137 Riccardo Lane, Fort Garland, CO 81133
MLS# 5045926Listed by: MTN. MEADOWS REALTY $20,000Active9.31 Acres
Lot 5526 Joy Road, Fort Garland, CO 81133
MLS# 6428546Listed by: FATHOM REALTY COLORADO LLC $13,000Active5.04 Acres
Lot 1617 Juarez Road, San Luis, CO 81152
MLS# 6915299Listed by: FATHOM REALTY COLORADO LLC $89,500Active15.64 Acres
3 Trinchera Ranch Rd, Fort Garland, CO 81133
MLS# 5575395Listed by: Mtn. Meadows Realty $319,000Active2 beds 1 baths1,192 sq. ft.
3222 Siverd Rd, Fort Garland, CO 81133
MLS# 3396474Listed by: Colorado Realty 4 Less, LLC $13,500Active5.21 Acres
Lot 4786 Beekman Rd, Fort Garland, CO 81133
MLS# 4802401Listed by: COLORADO REALTY & LAND CO. $10,000Pending20 Acres
20 AC Road X, San Luis, CO 81152
MLS# 8634323Listed by: FATHOM REALTY COLORADO LLC $795,000Active2 beds 3 baths6,822 sq. ft.
200 Nordman Dr, Fort Garland, CO 81133
MLS# 4673363Listed by: Colorado Realty & Land Co. $40,000Active19.84 Acres
Lot 6427 Laffin Road, San Luis, CO 81152
MLS# 7743636Listed by: FATHOM REALTY COLORADO LLC $5,000Pending10 Acres
10 AC Dante Road, San Luis, CO 81152
MLS# 5309132Listed by: FATHOM REALTY COLORADO LLC $70,000Active44.28 Acres
6401 Ryland Rd, San Luis, CO 81152
MLS# 2780189Listed by: Fathom Realty Colorado LLC $47,000Active15.12 Acres
Lot 6676 Alexandra Road, Fort Garland, CO 81133
MLS# 836371Listed by: EXP REALTY, LLC $29,500Active5.28 Acres
1321 Michaels Rd, San Luis, CO 81152
MLS# 9075361Listed by: Mtn. Meadows Realty $13,000Active5.15 Acres
Lot 989 Bateman Road, Fort Garland, CO 81133
MLS# 8818185Listed by: MTN. MEADOWS REALTY $20,000Active5.25 Acres
6082 Stella Road Rd, San Luis, CO 81152
MLS# 6313088Listed by: Fathom Realty Colorado LLC $69,900Active9.09 Acres
Lot 6026 Bruce Road, San Luis, CO 81152
MLS# 1763417Listed by: WERNER REALTY, INC. $12,000Active5.24 Acres
7668 Froom Rd, Fort Garland, CO 81133
MLS# 5035582Listed by: Mtn. Meadows Realty $12,000Active5.22 Acres
7669 Lewis Smith Rd, Fort Garland, CO 81133
MLS# 5249969Listed by: Mtn. Meadows Realty $17,500Active8.97 Acres
Address Withheld By Seller, Fort Garland, CO 81133
MLS# 8396940Listed by: eXp Realty, LLC $12,000Active2.03 Acres
968 Hunington Ln, Fort Garland, CO 81133
MLS# 2188128Listed by: Mtn. Meadows Realty $149,000Active2 beds 2 baths1,259 sq. ft.
1380 Dunn Rd, San Luis, CO 81152
MLS# 9654992Listed by: Mtn. Meadows Realty $90,000Active41.3 Acres
377 Powers Rd, Fort Garland, CO 81133
MLS# 8169249Listed by: Mtn. Meadows Realty $37,500Active5.16 Acres
6474 Malcolm Rd, San Luis, CO 81152
MLS# 6202704Listed by: Mtn. Meadows Realty $749,000Active5 beds 3 baths3,829 sq. ft.
1108 Ove Place, Fort Garland, CO 81133
MLS# 7900698Listed by: Blanca Peak Realty $30,000Active19.62 Acres
6077 Vreeland Rd, San Luis, CO 81152
MLS# 8581041Listed by: Fathom Realty Colorado LLC $10,500Active1.17 Acres
1617 Kopf Ln, Fort Garland, CO 81133
MLS# 8486537Listed by: Mtn. Meadows Realty $20,000Active5.69 Acres
LOT 6079 Stella Road, San Luis, CO 81152
MLS# 7945212Listed by: FATHOM REALTY COLORADO LLC $60,000Active20 Acres
00 Forbes Rd, Fort Garland, CO 81133
MLS# 2834647Listed by: COLORADO REALTY & LAND CO. $310,250Active2 beds 2 baths1,222 sq. ft.
1010 Foy Place, Fort Garland, CO 81133
MLS# 2389623Listed by: VILLAGE BROKERS INC $25,000Active8.89 Acres
6028 Spruce Rds, San Luis, CO 81152
MLS# 2505919Listed by: Fathom Realty Colorado LLC $30,000Active14.26 Acres
6029 Spruce Rd, San Luis, CO 81152
MLS# 3618740Listed by: Fathom Realty Colorado LLC $110,000Pending46.21 Acres
64121 Ryland Rd, San Luis, CO 81152
MLS# 2588665Listed by: Mtn. Meadows Realty $130,000Active1 beds 1 baths600 sq. ft.
3302 Calder Rd, Fort Garland, CO 81133
MLS# 9909855Listed by: Motion Homes Group $150,000Active1 beds 1 baths637 sq. ft.
4808 Fleming Rd, Fort Garland, CO 81133
MLS# 4039249Listed by: Werner Realty, Inc. $18,500Active6 Acres
6795 Starkweather Rd, Fort Garland, CO 81133
MLS# 6252882Listed by: Mtn. Meadows Realty $27,500Active5.69 Acres
Lot 6525 Schlueter Road, San Luis, CO 81152
MLS# 2444054Listed by: MTN. MEADOWS REALTY $26,500Active11.97 Acres
LOT 6785 Starkweather Road, San Luis, CO 81152
MLS# 8627910Listed by: FATHOM REALTY COLORADO LLC $18,000Active5.16 Acres
5835 Slegers Rd, San Luis, CO 81152
MLS# 5253214Listed by: Fathom Realty Colorado LLC $76,000Active5.71 Acres
6295 Malcolm Rd, San Luis, CO 81152
MLS# 5611693Listed by: Fathom Realty Colorado LLC $25,000Active9.45 Acres
6573 Ackerman Rd, San Luis, CO 81152
MLS# 6714921Listed by: Fathom Realty Colorado LLC $66,000Active5 Acres
6473 Malcolm Rd, San Luis, CO 81152
MLS# 7070568Listed by: Fathom Realty Colorado LLC $25,000Active5.3 Acres
5597 Nettler Rd, San Luis, CO 81152
MLS# 7106830Listed by: Fathom Realty Colorado LLC $23,000Active9.05 Acres
5563 Balleroy Rd, San Luis, CO 81152
MLS# 7660649Listed by: Fathom Realty Colorado LLC $28,000Pending10.46 Acres
6588 Forbes Rd, San Luis, CO 81152
MLS# 8020559Listed by: Fathom Realty Colorado LLC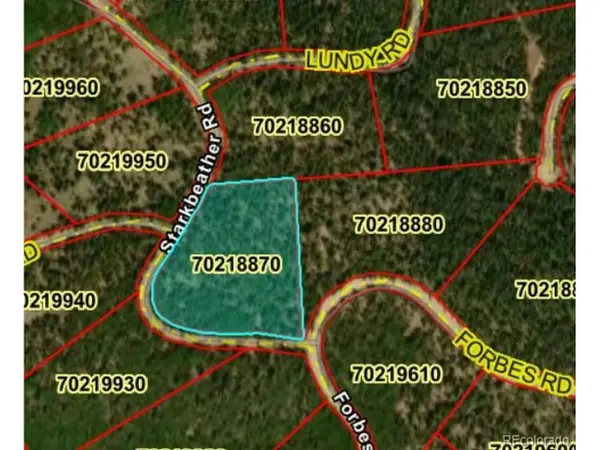 $19,000Active5.4 Acres
6614 Starkweather Rd, San Luis, CO 81152
MLS# 7256079Listed by: Fathom Realty Colorado LLC $25,000Active6.29 Acres
6461 Jacquez Rd, San Luis, CO 81152
MLS# 8209888Listed by: Fathom Realty Colorado LLC $24,000Active5.84 Acres
LOT 6447 Shoshita Road, San Luis, CO 81152
MLS# 4980826Listed by: FATHOM REALTY COLORADO LLC $18,500Active5.5 Acres
Lot 6858 Starkweather Road, San Luis, CO 81152
MLS# 5366281Listed by: FATHOM REALTY COLORADO LLC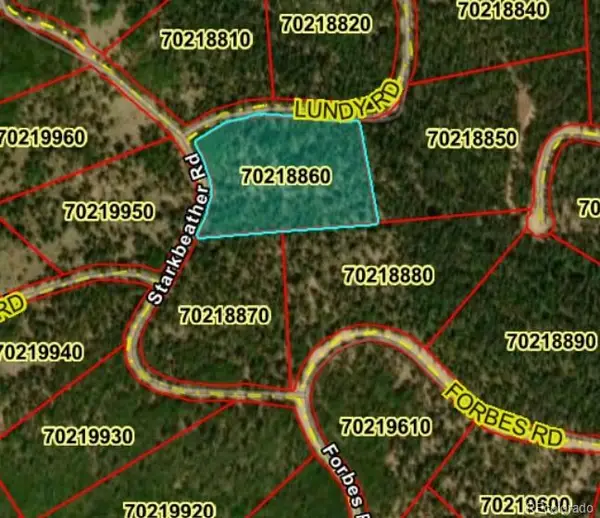 $19,000Active5.23 Acres
LOT 6613 Starkweather Road, San Luis, CO 81152
MLS# 6627846Listed by: FATHOM REALTY COLORADO LLC $17,500Active6.11 Acres
LOT 6850 Ryland Road, San Luis, CO 81152
MLS# 8911377Listed by: FATHOM REALTY COLORADO LLC $20,000Active5.09 Acres
na Andruss Road, Fort Garland, CO 81133
MLS# 835723Listed by: KELLER WILLIAMS PARTNERS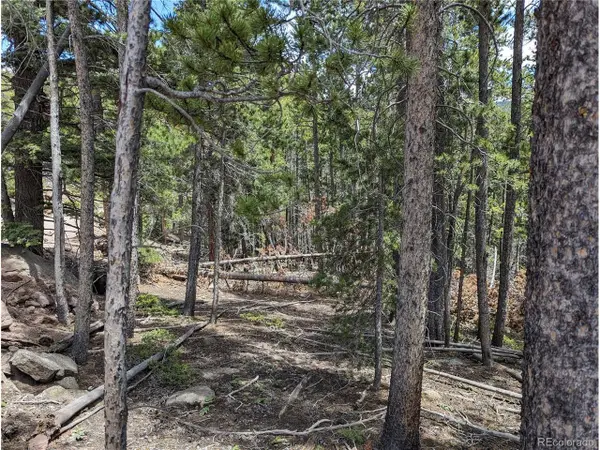 $11,500Active2.03 Acres
3159 Purnell Ln, Fort Garland, CO 81133
MLS# 5488265Listed by: Werner Realty, Inc.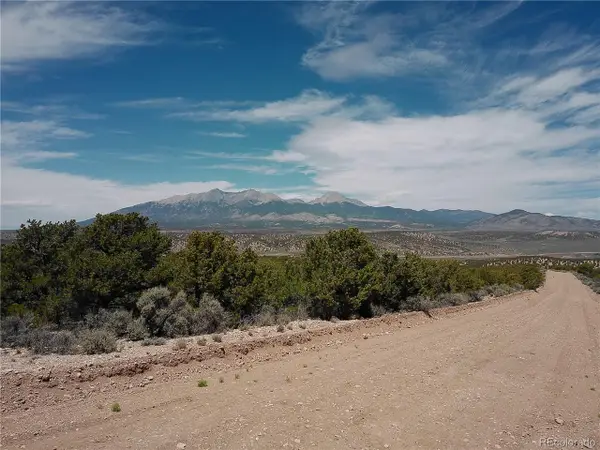 $20,000Active5.09 Acres
Address Withheld By Seller, Fort Garland, CO 81132
MLS# 6724200Listed by: Keller Williams Partners Realty $21,900Active5.37 Acres
Freling Huysen Rd, Fort Garland, CO 81133
MLS# 9503157Listed by: JPAR Modern Real Estate $20,000Active5 Acres
6991 Valarie Road, Fort Garland, CO 81133
MLS# 835489Listed by: STEFFENS AND COMPANY REALTY, INC $22,000Active1.3 Acres
2905 Forbes Park Loop, Fort Garland, CO 81133
MLS# 8249795Listed by: WERNER REALTY, INC. $539,000Active2 beds 2 baths1,712 sq. ft.
4653 Schierl Rd, Fort Garland, CO 81133
MLS# 3174051Listed by: Colorado Realty & Land Co. $11,500Active5.01 Acres
Lot 1075 Sylvia Road, Fort Garland, CO 81133
MLS# 4022298Listed by: MTN. MEADOWS REALTY $28,000Active5.21 Acres
6829 Ryland Rd, Fort Garland, CO 81133
MLS# 1641642Listed by: Colorado Realty & Land Co. $28,000Active5.28 Acres
6530 Schluetter Rd, Fort Garland, CO 81133
MLS# 2398024Listed by: Colorado Realty & Land Co. $15,000Active5.59 Acres
Lot 5428 Balleroy Road, Fort Garland, CO 81133
MLS# 2518772Listed by: MTN. MEADOWS REALTY $39,000Active1 beds 1 baths480 sq. ft.
7325 Boyer Road, Fort Garland, CO 81133
MLS# 835374Listed by: SCHULZ REALTY LLC $285,000Active3 beds 2 baths1,568 sq. ft.
7436 Waligunda Street, Fort Garland, CO 81133
MLS# 835337Listed by: SCHULZ REALTY LLC $22,000Active1.44 Acres
2904 Henderson Dr, Fort Garland, CO 81133
MLS# 7645534Listed by: Werner Realty, Inc. $11,700Active1.6 Acres
Lot 1102 Emery Loop, Fort Garland, CO 81152
MLS# 7072027Listed by: BRACKENDALE REALTY LLC $8,900Active5.02 Acres
1058 Hotchkiss Rd, Fort Garland, CO 81133
MLS# 6465624Listed by: Colorado Realty & Land Co. $17,500Active5.21 Acres
3714 Hartgrave Rd, Fort Garland, CO 81133
MLS# 8245989Listed by: Mtn. Meadows Realty $15,000Active5 Acres
5505 Balleroy Rd, Fort Garland, CO 81133
MLS# 3161563Listed by: Mtn. Meadows Realty $5,500Pending5.07 Acres
2884 Mcdonnell, Fort Garland, CO 81133
MLS# 7451342Listed by: Colorado Realty & Land Co. $17,500Active5.11 Acres
Lot 3715 Hartgrave Road, Fort Garland, CO 81133
MLS# 2150498Listed by: MTN. MEADOWS REALTY $15,000Active5 Acres
Lot 5505 Balleroy Road, Fort Garland, CO 81133
MLS# 3161563Listed by: MTN. MEADOWS REALTY $12,000Active5.39 Acres
891 Filly Rd., Fort Garland, CO 81133
MLS# 2432992Listed by: Werner Realty, Inc. $39,000Active2.63 Acres
2348 Benton Pl, Fort Garland, CO 81133
MLS# 3572452Listed by: Colorado Realty & Land Co. $42,500Active5.19 Acres
3691 Rockwell Road, Fort Garland, CO 81133
MLS# 9617075Listed by: Werner Realty, Inc. $45,000Active5 Acres
5 Reg Jones Rd, Fort Garland, CO 81133
MLS# 8454122Listed by: Colorado Realty & Land Co. $6,000Active5.39 Acres
St Timothy, Fort Garland, CO 81133
MLS# 5025428Listed by: COLORADO REALTY & LAND CO. $45,000Active5 Acres
5 acres Reg Jones Rd, Fort Garland, CO 81133
MLS# 8454122Listed by: COLORADO REALTY & LAND CO. $39,000Active40 Acres
TBD Countyrd 20.5, Fort Garland, CO 81133
MLS# 835166Listed by: BRACKENDALE REALTY, LLC $59,000Active5.09 Acres
415 Mulligan Ln, Fort Garland, CO 81133
MLS# 1536866Listed by: Werner Realty, Inc. $59,000Active5.09 Acres
415-416 Mulligan Lane, Fort Garland, CO 81133
MLS# 1536866Listed by: WERNER REALTY, INC. $50,000Active6.53 Acres
TBD Tagge Road, Fort Garland, CO 81133
MLS# 835131Listed by: STEFFENS AND COMPANY REALTY, INC $21,500Active9.25 Acres
Address Withheld By Seller, Fort Garland, CO 81133
MLS# 5916840Listed by: Keller Williams Partners Realty $21,500Active9.25 Acres
Forbes, Fort Garland, CO 81133
MLS# 5916840Listed by: KELLER WILLIAMS PARTNERS REALTY $21,500Active9.46 Acres
no Known Address Road, Fort Garland, CO 81133
MLS# 835070Listed by: KELLER WILLIAMS PARTNERS $9,000Active5.1 Acres
Address Withheld By Seller, Fort Garland, CO 81133
MLS# 3039773Listed by: Mtn. Meadows Realty $11,000Active1.4 Acres
Address Withheld By Seller, Fort Garland, CO 81133
MLS# 8143755Listed by: Mtn. Meadows Realty $200,000Active2 beds 1 baths1,400 sq. ft.
1031 Van Fossan Ln, Fort Garland, CO 81133
MLS# 4972833Listed by: Werner Realty, Inc. $549,900Active4 beds 3 baths2,720 sq. ft.
21515 Camino Tio Irving Street, Fort Garland, CO 81133
MLS# 7087003Listed by: MTN. MEADOWS REALTY $24,500Active5.25 Acres
5825 Covington Rd, Fort Garland, CO 81133
MLS# 9415779Listed by: Mtn. Meadows Realty $849,000Active3 beds 3 baths2,758 sq. ft.
406 Schierl Rd, Fort Garland, CO 81133
MLS# 5978717Listed by: Mtn. Meadows Realty $849,000Active3 beds 3 baths2,758 sq. ft.
406-449 Schierl Road, Fort Garland, CO 81133
MLS# 5978717Listed by: MTN. MEADOWS REALTY $325,000Active2 beds 1 baths1,125 sq. ft.
442 Forbes Park Road, Other, CO 81133
MLS# S1046270Listed by: LIV SOTHEBY'S I.R. $15,000Active5 Acres
SDCR Unit R2 Balleroy, Fort Garland, CO 81133
MLS# 821689Listed by: BRACKENDALE REALTY, LLC $35,000Active5.19 Acres
1915-16-19 Kiers Lane, Fort Garland, CO 81133
MLS# 822669Listed by: CODE OF THE WEST REAL ESTATE, LLC $15,000Active2.74 Acres
00 Special Place, Fort Garland, CO 81133
MLS# 823322Listed by: STEFFENS AND COMPANY REALTY, INC $12,000Active2.15 Acres
TBD Laker Lane, Fort Garland, CO 81133
MLS# 828615Listed by: CODE OF THE WEST REAL ESTATE, LLC $16,000Active8.84 Acres
Lot 5374 Adams Road, Fort Garland, CO 81133
MLS# 829198Listed by: MOTION HOMES GROUP LLC $12,000Active1.41 Acres
1069 Reed Lane, Fort Garland, CO 81133
MLS# 829551Listed by: CODE OF THE WEST REAL ESTATE, LLC $12,000Active1.44 Acres
842 Slaoui Place, Fort Garland, CO 81133
MLS# 829553Listed by: CODE OF THE WEST REAL ESTATE, LLC $17,000Active5.37 Acres
LOT 5701 Dettman Road, Fort Garland, CO 81133
MLS# 829821Listed by: MOTION HOMES GROUP LLC $115,000Active1 beds 1 baths1,200 sq. ft.
1702 Teirnan Dr, Fort Garland, CO 81133
MLS# 830828Listed by: BRACKENDALE REALTY, LLC $320,000Active2 beds 1 baths1,200 sq. ft.
7865 Platten Road, Fort Garland, CO 81133
MLS# 831469Listed by: MOTION HOMES GROUP LLC $15,000Active5.05 Acres
Lot 646 Slegers Road, Fort Garland, CO 81133
MLS# 831595Listed by: MOTION HOMES GROUP LLC $40,000Active8.49 Acres
no Known Address, Fort Garland, CO 81133
MLS# 832048Listed by: KELLER WILLIAMS PARTNERS $15,000Active2.9 Acres
TBD Lot 3170 Purnell Lane, Fort Garland, CO 81133
MLS# 833675Listed by: CODE OF THE WEST REAL ESTATE, LLC $120,000Active44.11 Acres
TBD Nordman Drive, Fort Garland, CO 81133
MLS# 833740Listed by: STEFFENS AND COMPANY REALTY, INC $72,000Active5 Acres
no Known Address Roads, Fort Garland, CO 81133
MLS# 834243Listed by: KELLER WILLIAMS PARTNERS $12,000Active5.96 Acres
TBD Tyllyn Rd, Fort Garland, CO 81133
MLS# 834284Listed by: STEFFENS AND COMPANY REALTY, INC $240,000Active160 Acres
0 County Road Gg, Fort Garland, CO 81133
MLS# 834361Listed by: EXP REALTY, LLC $15,000Active5.05 Acres
7631 Lewis Smith Rd, Fort Garland, CO 81133
MLS# 834603Listed by: EXP REALTY, LLC $24,500Active5.25 Acres
3292 Geneen Rd, Fort Garland, CO 81133
MLS# 1874031Listed by: Brackendale Realty Llc $18,900Active5.13 Acres
123 Slegers Cir, Fort Garland, CO 81133
MLS# 1882893Listed by: Keller Williams Preferred Realty $20,900Active5.41 Acres
123 Scheffellin, Fort Garland, CO 81133
MLS# 8354976Listed by: KELLER WILLIAMS PREFERRED REALTY $18,900Active5.02 Acres
1234 Mitchell Road, Fort Garland, CO 81133
MLS# 9318881Listed by: KELLER WILLIAMS PREFERRED REALTY $33,500Active1.34 Acres
Lot 1005 Foy Place, Fort Garland, CO 81133
MLS# 8845996Listed by: BRACKENDALE REALTY LLC $10,000Active1.65 Acres
Lot 2248 Buonaventura Lane, Fort Garland, CO 81133
MLS# 2355363Listed by: MTN. MEADOWS REALTY $310,250Active2 beds 2 baths1,276 sq. ft.
1010 Foy Place, Fort Garland, CO 81133
MLS# 9783961Listed by: VILLAGE BROKERS INC $9,400Active1.13 Acres
448 Wagon Mesa Loop, Fort Garland, CO 81133
MLS# 9432735Listed by: Mtn. Meadows Realty $8,000Active1.45 Acres
2301 Wohlstetter Loop, Fort Garland, CO 81133
MLS# 2228993Listed by: Motion Homes Group $8,500Active1.85 Acres
2296 Wohlstetter Loop, Fort Garland, CO 81133
MLS# 8379453Listed by: Motion Homes Group $369,000Active4 beds 2 baths1,908 sq. ft.
2084 Forbes Park Road, Fort Garland, CO 81133
MLS# 7859768Listed by: WERNER REALTY, INC. $20,500Active10 Acres
3036 Patricia Rd, Fort Garland, CO 81133
MLS# 8332993Listed by: Brackendale Realty Llc $36,500Active1.39 Acres
2553 Fine Pl, Fort Garland, CO 81133
MLS# 6688392Listed by: Werner Realty, Inc. $221,000Active2 beds 2 baths1,176 sq. ft.
1670 Cary Ln, Fort Garland, CO 81133
MLS# 7329599Listed by: Werner Realty, Inc. $59,900Active13.65 Acres
5817 Balleroy & Covington Rd, Fort Garland, CO 81133
MLS# 7548112Listed by: Mtn. Meadows Realty $37,995Active5 Acres
Lot 5244 Crossman Road, Fort Garland, CO 81133
MLS# 9944273Listed by: MTN. MEADOWS REALTY $5,900Active5 Acres
40 Dante Rd, Fort Garland, CO 81133
MLS# 3205783Listed by: Mtn. Meadows Realty $35,000Active10.27 Acres
5475 Joy Rd, Fort Garland, CO 81133
MLS# 7366755Listed by: Mtn. Meadows Realty $5,900Active5 Acres
Lot 40 Dante Road, Fort Garland, CO 81133
MLS# 3205783Listed by: MTN. MEADOWS REALTY $165,000Pending2 beds 1 baths1,254 sq. ft.
2613 Sleger Road, Fort Garland, CO 81133
MLS# 9175830Listed by: MTN. MEADOWS REALTY $650,000Active3 beds 2 baths1,860 sq. ft.
110 Guendel Place, Fort Garland, CO 81133
MLS# 2927654Listed by: HOMESMART $9,500Active1.59 Acres
1692 Trimm Pl, Fort Garland, CO 81133
MLS# 1898927Listed by: Werner Realty, Inc. $65,000Active8.35 Acres
2767 Purnell Ln, Fort Garland, CO 81133
MLS# 4522740Listed by: Werner Realty, Inc. $14,500Active5.01 Acres
14 Howell Rd, Fort Garland, CO 81133
MLS# 4412886Listed by: Werner Realty, Inc. $9,000Active1.24 Acres
321 Hagin Ln, Fort Garland, CO 81133
MLS# 1604806Listed by: Mtn. Meadows Realty $29,500Active1.58 Acres
1648 Cary Ln, Fort Garland, CO 81133
MLS# 2371708Listed by: Mtn. Meadows Realty $23,000Active3.89 Acres
Lot 1154 Bluhdorn Place, Fort Garland, CO 81133
MLS# 8460135Listed by: MTN. MEADOWS REALTY $15,000Active5.05 Acres
Lewis Smith Road, Fort Garland, CO 81133
MLS# 8515033Listed by: EXP REALTY, LLC $15,000Active5.08 Acres
4536 Sarnoff Rd, Fort Garland, CO 81133
MLS# 5955467Listed by: Mtn. Meadows Realty $6,700Active4.79 Acres
105 Schlitz Rd., Fort Garland, CO 81133
MLS# 1860892Listed by: LPT Realty $6,700Active4.75 Acres
8 Budwieser Rd., Fort Garland, CO 81133
MLS# 3978094Listed by: LPT Realty $6,700Active4.67 Acres
91 Triana Rd., Fort Garland, CO 81133
MLS# 5624505Listed by: LPT Realty $6,700Active4.74 Acres
9 Ballentine Rd., Fort Garland, CO 81133
MLS# 8586633Listed by: LPT Realty $6,700Active5.1 Acres
22 Tuborg Rd., Fort Garland, CO 81133
MLS# 9559054Listed by: LPT Realty $7,700Active4.64 Acres
18 Sancho Rd., Fort Garland, CO 81133
MLS# 5394018Listed by: LPT Realty $6,200Active4.73 Acres
4 2nd St., Blanca, CO 81123
MLS# 7770526Listed by: LPT Realty $1,900,000Active6 beds 6 baths7,587 sq. ft.
29469 County Road V V.8, Fort Garland, CO 81133
MLS# 2546762Listed by: REMAX PROPERTIES $14,000Active2.1 Acres
3408 Drexler Pl, Fort Garland, CO 81133
MLS# 2335201Listed by: Mtn. Meadows Realty $49,000Active5.01 Acres
TBD Sangre De Cristo Ranches, Fort Garland, CO 81133
MLS# 239832Listed by: CODE OF THE WEST REAL ESTATE LLC $23,000Active5.08 Acres
Lot 5902 Slegers Road, Fort Garland, CO 81133
MLS# 8155711Listed by: MTN. MEADOWS REALTY $9,500Active1 Acres
Lot 686 Cogbill Drive, Fort Garland, CO 81133
MLS# 5282840Listed by: MTN. MEADOWS REALTY $28,000Active40 Acres
Tio Irving St, Fort Garland, CO 81133
MLS# 6221227Listed by: Mtn. Meadows Realty $435,000Active3 beds 3 baths2,688 sq. ft.
5751 Emery Loop, Fort Garland, CO 81133
MLS# 9537844Listed by: Werner Realty, Inc. $31,500Pending2.03 Acres
2433 Petito Drive, Fort Garland, CO 81133
MLS# 7018765Listed by: WERNER REALTY, INC. $226,000Active1 beds 1 baths2,053 sq. ft.
2504 Sharbaugh Ln, Fort Garland, CO 81133
MLS# 6333630Listed by: Trillionaire Realty $567,000Active3 beds 2 baths1,892 sq. ft.
153 Tahmoush Ln, Fort Garland, CO 81133
MLS# 1670525Listed by: Mtn. Meadows Realty $120,000Active40.44 Acres
154 Tahmoush Ln, Fort Garland, CO 81133
MLS# 2463238Listed by: Mtn. Meadows Realty $11,900Active1.29 Acres
1426 Hassan Ln, Fort Garland, CO 81133
MLS# 6813108Listed by: Amber Lawrence Realty LLC $42,499Active20.42 Acres
6742 Starkweather Rd, San Luis, CO 81152
MLS# 3639788Listed by: Werner Realty, Inc. $42,499Active20.42 Acres
Lot 6742 Starkweather Road, San Luis, CO 81152
MLS# 3639788Listed by: WERNER REALTY, INC. $39,900Active17.74 Acres
6744 Starkweather Rd, San Luis, CO 81152
MLS# 3374189Listed by: Werner Realty, Inc. $29,900Active5.43 Acres
1593 Jaidi Rd, Fort Garland, CO 81133
MLS# 2626535Listed by: Werner Realty, Inc. $44,900Active5.26 Acres
2387 Pina Rd, Fort Garland, CO 81133
MLS# 2641813Listed by: Werner Realty, Inc. $125,000Active40.05 Acres
Address Withheld By Seller, Fort Garland, CO 81133
MLS# 8393728Listed by: Mtn. Meadows Realty $129,000Active1 beds 1 baths603 sq. ft.
6800 Starkweather Rd, San Luis, CO 81152
MLS# 3754176Listed by: Mtn. Meadows Realty $33,500Active9.66 Acres
5401 Balleroy Rd, Fort Garland, CO 81133
MLS# 5821091Listed by: Amber Lawrence Realty LLC $9,500Active5.19 Acres
1258 Michaels Rd, Fort Garland, CO 81133
MLS# 9958360Listed by: Colorado Realty & Land Co. $11,500Active1.62 Acres
1228 Granville Loop, Fort Garland, CO 81133
MLS# 7020839Listed by: Mtn. Meadows Realty $11,500Active1.59 Acres
1227 Granville Loop, Fort Garland, CO 81133
MLS# 9055381Listed by: Mtn. Meadows Realty $11,500Active1.9 Acres
1223 Emery Loop, Fort Garland, CO 81133
MLS# 4924791Listed by: Mtn. Meadows Realty $11,500Active1.63 Acres
1224 Emery Loop, Fort Garland, CO 81133
MLS# 5054164Listed by: Mtn. Meadows Realty $23,500Active1.36 Acres
2560 Grojean Dr, Fort Garland, CO 81133
MLS# 2291920Listed by: Mtn. Meadows Realty $165,000Active46.9 Acres
155 Tahmoush Ln, Fort Garland, CO 81133
MLS# 2860872Listed by: Mtn. Meadows Realty $60,000Active3 Acres
549 Drevs Pl, Fort Garland, CO 81133
MLS# 4239653Listed by: Werner Realty, Inc. $283,000Active2 beds 1 baths1,064 sq. ft.
4585 Laidlaw Road, Fort Garland, CO 81133
MLS# 3365947Listed by: WERNER REALTY, INC. $409,900Active2 beds 1 baths1,550 sq. ft.
450 Schierl Road, Fort Garland, CO 81133
MLS# 7758024Listed by: ERA SHIELDS REAL ESTATE $19,350Active3.2 Acres
0 Marriot Circle, Fort Garland, CO 81133
MLS# 5633010Listed by: Colorado Realty & Land Co. $38,000Active40 Acres
0 Vacant Land, Fort Garland, CO 81133
MLS# 6599387Listed by: Colorado Realty & Land Co. $16,110Active1.61 Acres
0 Hart Ln., Fort Garland, CO 81133
MLS# 7295828Listed by: Colorado Realty & Land Co. $6,750Active5 Acres
0 Elkhorn Dr., Fort Garland, CO 81133
MLS# 7372440Listed by: Colorado Realty & Land Co. $11,610Active1.3 Acres
00 Forbes Park Rd., Fort Garland, CO 81133
MLS# 2068440Listed by: COLORADO REALTY & LAND CO. $81,000Active3.38 Acres
3772 Soubry Pl, Fort Garland, CO 81133
MLS# 1683414Listed by: Werner Realty, Inc. $79,000Active40.2 Acres
Lot 297 Boothby Lane, Fort Garland, CO 81133
MLS# 9991369Listed by: MTN. MEADOWS REALTY $12,000Active10 Acres
Tbd Amy Ln, San Luis, CO 81152
MLS# 2426056Listed by: Mtn. Meadows Realty $32,000Active5.32 Acres
2443 Hall Ln, Fort Garland, CO 81133
MLS# 4335911Listed by: Amo Realty $6,250Active1.68 Acres
1960 Hilda Ln, Fort Garland, CO 81133
MLS# 3349337Listed by: Mtn. Meadows Realty $32,750Active1.89 Acres
2415 Petito Dr, Fort Garland, CO 81133
MLS# 5542575Listed by: Mtn. Meadows Realty $11,500Active5.1 Acres
Address Withheld By Seller, Fort Garland, CO 81133
MLS# 6854389Listed by: Mtn. Meadows Realty $15,000Active5.08 Acres
3589 Freylinghuysen Rd, Fort Garland, CO 81133
MLS# 8434921Listed by: Motion Homes Group $22,000Active1.45 Acres
3091 Sterenson Pl, Fort Garland, CO 81133
MLS# 6744105Listed by: Mtn. Meadows Realty $19,900Active2.57 Acres
1020 Hassan Ln, Fort Garland, CO 81133
MLS# 8795109Listed by: Mtn. Meadows Realty $22,000Active1.45 Acres
Lot 3091 Sterenson Place, Fort Garland, CO 81133
MLS# 6744105Listed by: MTN. MEADOWS REALTY $19,900Active2.57 Acres
Lot 1020 & 1021 Hassan Lane, Fort Garland, CO 81133
MLS# 8795109Listed by: MTN. MEADOWS REALTY $610,000Active4 beds 4 baths2,500 sq. ft.
6949 Debutts Pl, Fort Garland, CO 81133
MLS# 3085912Listed by: LPT Realty $289,000Active3 beds 2 baths1,200 sq. ft.
786 Margie Ln, Fort Garland, CO 81133
MLS# 7709089Listed by: Motion Homes Group $11,500Active1.51 Acres
880 Slaoui Pl, Fort Garland, CO 81133
MLS# 2998924Listed by: Mtn. Meadows Realty $7,200Active5 Acres
5 Arrowhead Rd, Fort Garland, CO 81133
MLS# 6018138Listed by: LPT Realty $124,900Active6.1 Acres
000 Riccardo Lane, Fort Garland, CO 81133
MLS# 9629880Listed by: CODE OF THE WEST REAL ESTATE $18,000Active5.02 Acres
0 Juarez Rd, Fort Garland, CO 81133
MLS# 8740234Listed by: Motion Homes Group $529,000Active4 beds 3 baths3,130 sq. ft.
3818 Fontaine Rd, Fort Garland, CO 81133
MLS# 1637238Listed by: Mtn. Meadows Realty $22,900Active5.1 Acres
2121 Acapulco Rd, Fort Garland, CO 81133
MLS# 3420171Listed by: Code of the West Real Estate $15,000Active5.33 Acres
2981 Blk 174, Fort Garland, CO 81133
MLS# 7760986Listed by: Keller Williams Partners Realty $29,900Active1.83 Acres
2067 Korlkoff Ln, Fort Garland, CO 81133
MLS# 3413946Listed by: Mtn. Meadows Realty $10,000Active1.98 Acres
3375 Purnell Ln, Fort Garland, CO 81133
MLS# 2318586Listed by: Werner Realty, Inc. $73,000Active18.03 Acres
n/a Ryland Rd, San Luis, CO 81152
MLS# 238878Listed by: CRUIKSHANK REALTY, INC $35,750Active2.86 Acres
2664 Grojean Drive, Fort Garland, CO 81133
MLS# 2408092Listed by: WERNER REALTY, INC. $12,500Active1.81 Acres
2938 Kemper Loop, Fort Garland, CO 81133
MLS# 8003081Listed by: Werner Realty, Inc. $15,000Active1.36 Acres
2452 Petito Dr, Fort Garland, CO 81133
MLS# 5832902Listed by: Werner Realty, Inc. $5,000Active1.12 Acres
914 Forbes Park Rd, Fort Garland, CO 81133
MLS# 9762144Listed by: Werner Realty, Inc. $12,500Active5.22 Acres
0 Bilby Rd, Fort Garland, CO 81133
MLS# 2793581Listed by: Keller Williams Clients Choice Realty $50,000Active90 Acres
90 County Road 19.5, Fort Garland, CO 81133
MLS# 8479332Listed by: Brackendale Realty Llc $14,750Active1.43 Acres
2127 Sigler Dr, Fort Garland, CO 81133
MLS# 4763901Listed by: Werner Realty, Inc. $45,000Active15.89 Acres
2045 Pfotenhaur Rd, Fort Garland, CO 81133
MLS# 8532666Listed by: Mtn. Meadows Realty $14,000Active2.24 Acres
385 Soubry Pl, Fort Garland, CO 81133
MLS# 2087107Listed by: Mtn. Meadows Realty $12,000Active5.03 Acres
0 Mclaughlin Rd, Fort Garland, CO 81133
MLS# 1613666Listed by: Colorado Realty & Land Co. $650,000Active5 beds 4 baths3,944 sq. ft.
3237 Romnes Rd, Fort Garland, CO 81133
MLS# 1054517Listed by: eXp Realty - Fort Collins $15,000Active6.48 Acres
00 Preast Road, Fort Garland, CO 81133
MLS# 2945440Listed by: COLORADO REALTY & LAND CO. $7,000Active1.33 Acres
1470 Von Heyl Ln, Fort Garland, CO 81133
MLS# 4558914Listed by: Mtn. Meadows Realty $7,000Active1.39 Acres
1460 Von Heyl Ln, Fort Garland, CO 81133
MLS# 3037408Listed by: Mtn. Meadows Realty $77,000Active8.67 Acres
374 Soubry Pl, Fort Garland, CO 81133
MLS# 9848794Listed by: Werner Realty, Inc. $16,000Active5 Acres
7274 Barker Rd, Fort Garland, CO 81133
MLS# 2490416Listed by: Mtn. Meadows Realty $16,000Active5 Acres
Lot 7274 Barker Road, Fort Garland, CO 81133
MLS# 2490416Listed by: MTN. MEADOWS REALTY $6,500Active4.8 Acres
119 Budweiser Rd, Fort Garland, CO 81133
MLS# 3669336Listed by: Brackendale Realty Llc $7,000Active4.6 Acres
5 Budweiser Rd, Fort Garland, CO 81133
MLS# 3955157Listed by: Brackendale Realty Llc $24,000Active4.24 Acres
2796 Moir Dr, Fort Garland, CO 81133
MLS# 4794411Listed by: Werner Realty, Inc. $60,000Active8.15 Acres
409 Williams Rd, Fort Garland, CO 81133
MLS# 2015352Listed by: Mtn. Meadows Realty $18,500Active6.98 Acres
4510 Iannelli Rd, Fort Garland, CO 81133
MLS# 2607129Listed by: Mtn. Meadows Realty $6,500Active4.68 Acres
Address Withheld By Seller, San Luis, CO 81152
MLS# IR1053584Listed by: REALTY ONE GROUP FOURPOINTS CO $25,000Active1.07 Acres
999 Foy Pl, Fort Garland, CO 81133
MLS# 9442426Listed by: Mtn. Meadows Realty $24,000Active1.91 Acres
2736 Newman Place, Fort Garland, CO 81133
MLS# 8699604Listed by: WERNER REALTY, INC. $45,000Active1.01 Acres
954 Forbes Park Road, Fort Garland, CO 81133
MLS# 4136228Listed by: WERNER REALTY, INC. $240,000Active1 beds 1 baths1,120 sq. ft.
7541 Indian Creek Road, Fort Garland, CO 81133
MLS# 9821008Listed by: MTN. MEADOWS REALTY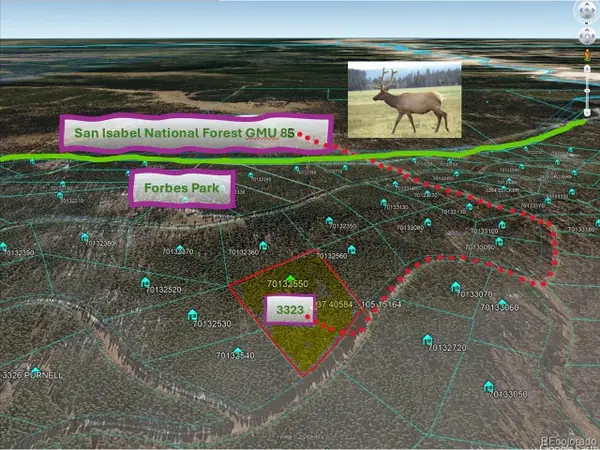 $20,000Active4.14 Acres
3323 Purnell Ln, Fort Garland, CO 81133
MLS# 1542143Listed by: Werner Realty, Inc. $45,900Active2.48 Acres
1280 Seawell Pl, Fort Garland, CO 81133
MLS# 6111369Listed by: Mtn. Meadows Realty $34,900Active5.22 Acres
Lot 7542 Indian Creek Road, Fort Garland, CO 81133
MLS# 8527428Listed by: MTN. MEADOWS REALTY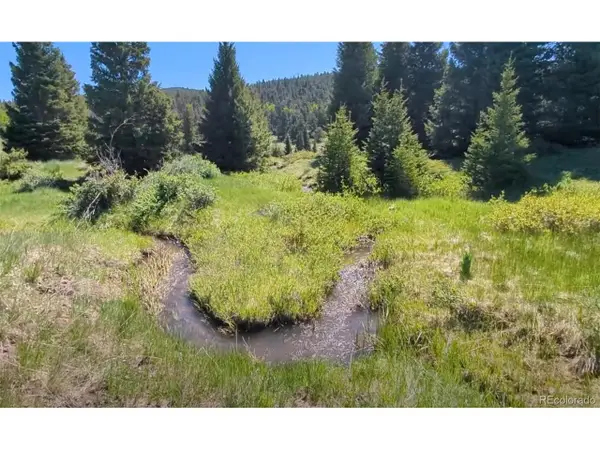 $88,750Active4.2 Acres
3119 Segal Pl, Fort Garland, CO 81133
MLS# 9045683Listed by: Werner Realty, Inc.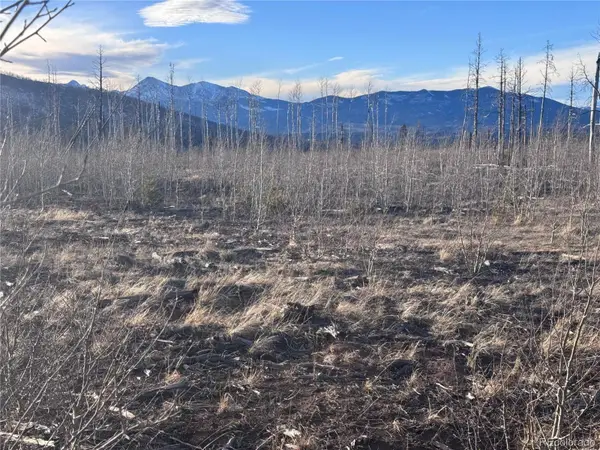 $9,500Active1.37 Acres
1290 Clayton Road, Fort Garland, CO 81133
MLS# 1806983Listed by: BRACKENDALE REALTY LLC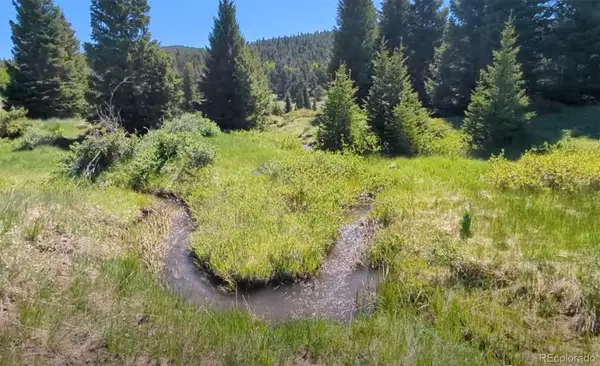 $88,750Active4.2 Acres
3119-3121 Segal Place, Fort Garland, CO 81133
MLS# 9045683Listed by: WERNER REALTY, INC. $15,000Active5.02 Acres
0 Juarez, Fort Garland, CO 81133
MLS# 6904427Listed by: Motion Homes Group $13,000Active2.18 Acres
1502 Vonheyl Ln, Fort Garland, CO 81133
MLS# 6717841Listed by: Mtn. Meadows Realty $15,000Active5.27 Acres
7060 Pamplin Rd, Fort Garland, CO 81133
MLS# 1877001Listed by: Mtn. Meadows Realty $599,000Active4 beds 2 baths2,248 sq. ft.
1025 Walker Pl, Fort Garland, CO 81133
MLS# 9089778Listed by: Mtn. Meadows Realty $9,500Active5 Acres
4101 Woodman Rd, Fort Garland, CO 81133
MLS# 9755591Listed by: Mtn. Meadows Realty $90,000Active40.4 Acres
129 Flavin Ln, Fort Garland, CO 81133
MLS# 6986743Listed by: Mtn. Meadows Realty $9,977Active2.49 Acres
2734 Newman, Fort Garland, CO 81133
MLS# 8121299Listed by: Forbes Park Realty $16,900Active5.03 Acres
7293 Barker Rd, Fort Garland, CO 81133
MLS# 2515266Listed by: Mtn. Meadows Realty $10,000Active5.1 Acres
Address Withheld By Seller, Fort Garland, CO 81133
MLS# 3111358Listed by: Mtn. Meadows Realty $6,100Active4.7 Acres
68 Cervantes Rd, Fort Garland, CO 81133
MLS# 4525313Listed by: Brackendale Realty Llc $5,900Active4.8 Acres
27 Dante Rd, Fort Garland, CO 81133
MLS# 6962286Listed by: Brackendale Realty Llc $6,100Active4.9 Acres
81 Macarthur Rd, Fort Garland, CO 81133
MLS# 9117808Listed by: Brackendale Realty Llc $10,500Active5 Acres
663 Slegers Rd, Fort Garland, CO 81133
MLS# 8455391Listed by: Brackendale Realty Llc $33,333Active2.68 Acres
Lot 542 Forbes Pk, Fort Garland, CO 81133
MLS# 237187Listed by: CODE OF THE WEST REAL ESTATE LLC $33,333Active2.7 Acres
542 Forbes Park, Fort Garland, CO 81133
MLS# 6432116Listed by: Code of the West Real Estate $33,333Active2.7 Acres
lot 542 Forbes Park, Fort Garland, CO 81133
MLS# 6432116Listed by: CODE OF THE WEST REAL ESTATE $14,500Active1.29 Acres
1043 Saul Pl, Fort Garland, CO 81133
MLS# 5085087Listed by: Forbes Park Realty $17,777Active2.6 Acres
3207 Vaughn Ln, Fort Garland, CO 81133
MLS# 5028471Listed by: Forbes Park Realty $12,000Active5.03 Acres
1188 Fleck Rd, Fort Garland, CO 81133
MLS# 8035861Listed by: Mtn. Meadows Realty $20,000Active3.51 Acres
2379 Larry Pl, Fort Garland, CO 81133
MLS# 4142211Listed by: Werner Realty, Inc. $35,000Active5 Acres
1134 Jorgulesco Rd, Fort Garland, CO 81133
MLS# 3257808Listed by: REMAX PROPERTIES $12,500Active5.1 Acres
4875 Durante Rd, Fort Garland, CO 81133
MLS# 7735892Listed by: Mtn. Meadows Realty $29,000Active41.63 Acres
Camino Tio Irving, Fort Garland, CO 81133
MLS# 4082531Listed by: LPT Realty $30,000Active20 Acres
0 County Rd W, Fort Garland, CO 81133
MLS# 6694379Listed by: Colorado Realty & Land Co.
The real estate listing information and related content displayed on this site is provided exclusively for consumer's personal, non-commercial use and may not be used for any purpose other than to identify prospective properties consumers may be interested in purchasing. This information and related content is deemed reliable but is not guaranteed accurate by Information and Real Estate Services, LLC.
Information source: Information and Real Estate Services, LLC. Provided for limited non-commercial use only under IRES Rules © Copyright IRES. The information being provided by Information and Real Estate Services is for the consumer's personal, non-commercial use and may not be used for any purpose other than to identify prospective properties consumer may be interested in purchasing. Any information relating to real estate for sale referenced on this web site comes from the Internet Data Exchange (IDX) program of the Information and Real Estate Services. This web site may reference real estate listing(s) held by a brokerage firm other than the broker and/or agent who owns this web site.
The accuracy of all information, regardless of source, including but not limited to open house information, square footages and lot sizes, is deemed reliable but not guaranteed and should be personally verified through personal inspection by and/or with the appropriate professionals. The data contained herein is copyrighted by Information and Real Estate Services and is protected by all applicable copyright laws. Any unauthorized dissemination of this information is in violation of copyright laws and is strictly prohibited.
Based on information submitted to the MLS GRID as of July 30, 2026 02:19 PM. All data is obtained from various sources and may not have been verified by broker or MLS GRID. Supplied Open House information is subject to change without notice. All information should be independently reviewed and verified for accuracy. Properties may or may not be listed by the office/agent presenting the information.
SOURCE: The data relating to real estate for sale on this web site comes in part from the Internet Data Exchange (IDX) program of Colorado Real Estate Network (CREN). All data deemed reliable but not guaranteed and should be independently verified. The information contained in this publication is subject to change without notice. TERMS OF USE: This publication is designed to provide information with regard to the subject matter covered. This listing information is provided exclusively for consumers' personal, non-commercial use and may not be used for any purpose other than to identify prospective properties consumers may be interested in purchasing. It is displayed with the understanding that the publisher and authors are not engaged in rendering real estate, legal, accounting, tax, or other professional services and that the publisher and authors are not offering such advice in this publication. If real estate, legal, or other expert assistance is required, the services of a competent, professional person should be sought. WARRANTY: COLORADO REAL ESTATE NETWORK (CREN) MAKES NO WARRANTY OF ANY KIND WITH REGARD TO THIS MATERIAL, INCLUDING, BUT NOT LIMITED TO, THE IMPLIED WARRANTIES OF MERCHANTABILITY AND FITNESS FOR A PARTICULAR PURPOSE. COLORADO REAL ESTATE NETWORK SHALL NOT BE LIABLE FOR ERRORS CONTAINED HEREIN OR FOR ANY DAMAGES IN CONNECTION WITH THE FURNISHING, PERFORMANCE, OR USE OF THIS MATERIAL. 2026 by COLORADO REAL ESTATE NETWORK” 121 Park Avenue #4 MONTROSE, CO 81401 USA ALL RIGHTS RESERVED WORLDWIDE. No part of this publication may be reproduced, adapted, translated, stored in a retrieval system or transmitted in any form or by any means, electronic, mechanical, photocopying, recording, or otherwise, without the prior written permission of Colorado Real Estate Network (CREN). PUBLISHERS NOTE: All information is deemed reliable by is not guaranteed and should be independently verified. All real estate advertised herein is subject to the US Federal Housing Act of 1968 and the Colorado Fair Housing Act, which makes it illegal to make or publish any advertisement that indicates any preference, limitation, or discrimination based on race, color, religion, sex,, handicap, familial status, or national origin. Please check with your local government agency for more information. CO_CREN Member Broker: Rachel Justamn
The information being provided by Pikes Peak REALTOR® Services Corp. is for the consumer's personal, non-commercial use and may not be used for any purpose other than to identify prospective properties consumer may be interested in purchasing. Any information relating to real estate for sale referenced on this web site comes from the Internet Data Exchange (IDX) program of the Pikes Peak REALTOR® Services Corp.. CENTURY 21 Top Dog Properties is not a Multiple Listing Service (MLS), nor does it offer MLS access. This website is a service of CENTURY 21 Top Dog Properties, a broker participant of Pikes Peak REALTOR® Services Corp.. This web site may reference real estate listing(s) held by a brokerage firm other than the broker and/or agent who owns this web site.
The accuracy of all information, regardless of source, including but not limited to open house information, square footages and lot sizes, is deemed reliable but not guaranteed and should be personally verified through personal inspection by and/or with the appropriate professionals. The data contained herein is copyrighted by Pikes Peak REALTOR® Services Corp. and is protected by all applicable copyright laws. Any unauthorized dissemination of this information is in violation of copyright laws and is strictly prohibited.
The real estate listing information and related content displayed on this site is provided exclusively for consumers' personal, non-commercial use and may not be used for any purpose other than to identify prospective properties consumers may be interested in purchasing. This information and related content is deemed reliable but is not guaranteed accurate by the Pikes Peak REALTOR® Services Corp.
Copyright 2026 Pikes Peak REALTOR® Services Corp. All rights reserved.
All information deemed reliable but not guaranteed and should be independently verified. All properties are subject to prior sale, change or withdrawal. Neither listing broker(s) nor CENTURY 21 Top Dog Properties shall be responsible for any typographical errors, misinformation, misprints and shall be held totally harmless. Information being provided is for consumers' personal, non-commercial use and may not be used for any other purpose. The content relating to real estate for sale on this Web site comes in part from Pueblo Assocation of Realtors.
Popular searches near 81133
Popular neighborhoods near 81133
- Aberdeen, Pueblo homes for sale
- Bessemer, Pueblo homes for sale
- Beulah Heights, Pueblo homes for sale
- City Hall Place, Pueblo homes for sale
- El Camino, Pueblo homes for sale
- Heritage, Pueblo homes for sale
- Highland Park, Pueblo homes for sale
- Hyde Park, Pueblo homes for sale
- Lake Minnequa, Pueblo homes for sale
- Lakeview, Pueblo homes for sale
- Liberty Point, Pueblo homes for sale
- Mesa Junction, Pueblo homes for sale
- Regency, Pueblo homes for sale
- Regency Park, Pueblo homes for sale
- Southpointe, Pueblo homes for sale
- Starlight Hills, Pueblo homes for sale
- Sunny Heights, Pueblo homes for sale
- Sunset, Pueblo homes for sale
- Sunset Park, Pueblo homes for sale
- West Park, Pueblo homes for sale
Counties near Fort Garland, 81133
- Alamosa County homes for sale
- Archuleta County homes for sale
- Colfax County homes for sale
- Conejos County homes for sale
- Costilla County homes for sale
- Custer County homes for sale
- Fremont County homes for sale
- Huerfano County homes for sale
- Las Animas County homes for sale
- Mineral County homes for sale
- Mora County homes for sale
- Otero County homes for sale
- Pueblo County homes for sale
- Rio Grande County homes for sale
- Saguache County homes for sale
- Taos County homes for sale
Protect your home and budget from life's surprises with an Assurant Home Warranty, backed by a partner that supports you through every step of homeownership. Explore Plans.
©2026 Century 21 Real Estate LLC. All rights reserved. CENTURY 21®, the CENTURY 21 Logo and C21® are service marks owned by Century 21 Real Estate LLC. Century 21 Real Estate LLC fully supports the principles of the Fair Housing Act and the Equal Opportunity Act. Each office is independently owned and operated. Listing information is deemed reliable but not guaranteed accurate.