- Biggs Junction, Wasco homes for sale
- Boyd Acres, Bend homes for sale
- Cold Springs, Hermiston homes for sale
- Dallesport, Dallesport homes for sale
- Downtown, Hood River homes for sale
- Fairhaven, Redmond homes for sale
- Government Camp, Government Camp homes for sale
- Husum, White Salmon homes for sale
- Idlewilde, Hood River homes for sale
- Lyle, Lyle homes for sale
- Maryhill, Goldendale homes for sale
- McNary, Umatilla homes for sale
- Mountain View, Bend homes for sale
- Orchard District, Bend homes for sale
- Rivers Edge Village, Bend homes for sale
- Roosevelt, Roosevelt homes for sale
- The Heights, Hood River homes for sale
- Underwood, Underwood homes for sale
- Wiestoria, Bend homes for sale
- Wishram, Wishram homes for sale
Fossil, OR - homes for sale
7 of 7 results displayed
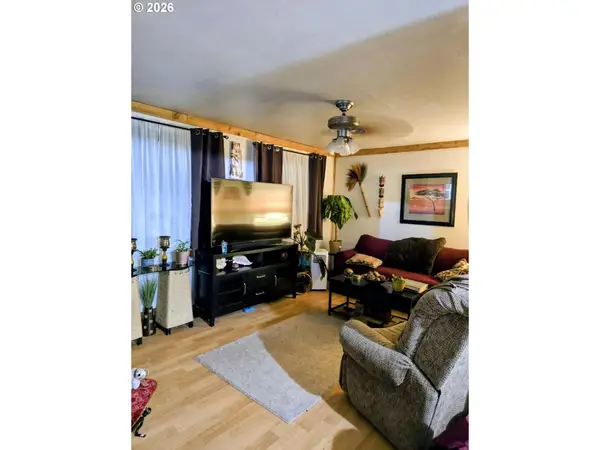
 $79,900Active4 beds 1 baths1,264 sq. ft.
1010 C St, Fossil, OR 97830
MLS# 534114476Listed by: KELLER WILLIAMS SUNSET CORRIDOR
 $175,000Active2 beds 1 baths2,000 sq. ft.
680 Main St, Fossil, OR 97830
MLS# 324466832Listed by: KELLER WILLIAMS SUNSET CORRIDOR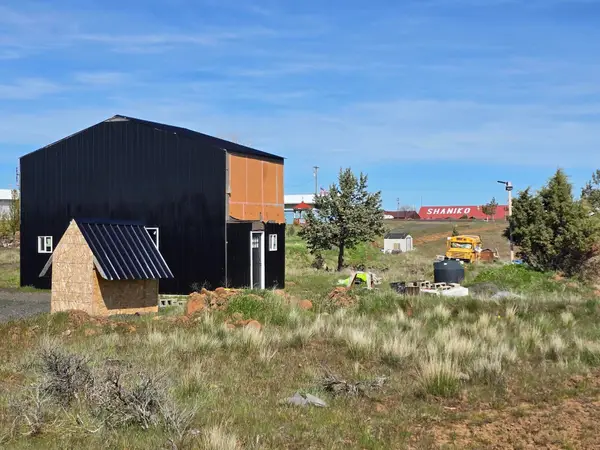 $199,000Active1 beds 1 baths845 sq. ft.
48712 B Street, Shaniko, OR 97057
MLS# 220219665Listed by: COLDWELL BANKER SUN COUNTRY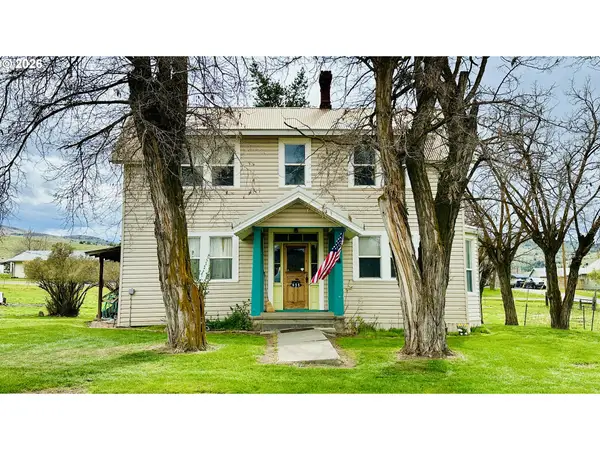 $249,900Pending3 beds 1 baths1,507 sq. ft.
955 B St, Fossil, OR 97830
MLS# 409610635Listed by: KELLER WILLIAMS SUNSET CORRIDOR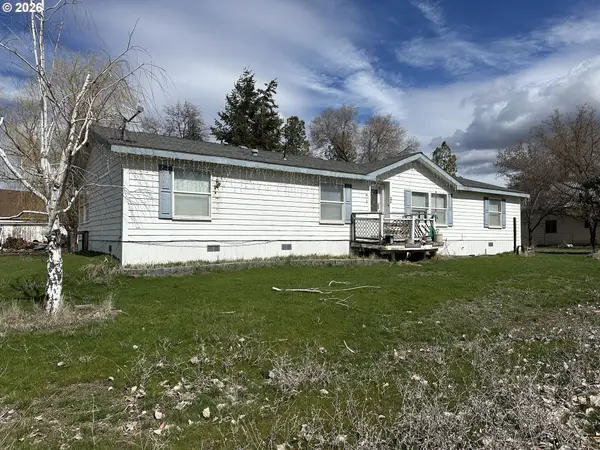 $149,900Active3 beds 2 baths1,848 sq. ft.
404 Second St, Fossil, OR 97830
MLS# 564822709Listed by: KELLER WILLIAMS SUNSET CORRIDOR $149,900Pending2 beds 1 baths1,260 sq. ft.
406 Ellsworth St, Fossil, OR 97830
MLS# 446589932Listed by: KELLER WILLIAMS SUNSET CORRIDOR $265,000Active3 beds 1 baths1,448 sq. ft.
1225 B St, Fossil, OR 97830
MLS# 405147251Listed by: MADDEN REALTY
Local realty services provided by:CENTURY 21 Agate Realty
All information provided is deemed reliable but is not guaranteed and should be independently verified. The content relating to real estate for sale on this web site comes in part from the IDX program of the RMLS of Portland Oregon. Real estate listings held by brokerage firms other than CENTURY 21 Agate Realty are marked with the RMLS logo and detailed information about these properties includes the names of the listing brokers. Copyright 2026 RMLS, Portland, Oregon. Last updated: July 26, 2026 PORTLAND Member Broker: Rebecca Watwood PC
Neighborhoods near Fossil, OR
Zip codes near Fossil, OR
- 97021 homes for sale
- 97037 homes for sale
- 97039 homes for sale
- 97058 homes for sale
- 97063 homes for sale
- 97065 homes for sale
- 97741 homes for sale
- 97750 homes for sale
- 97812 homes for sale
- 97818 homes for sale
- 97823 homes for sale
- 97825 homes for sale
- 97830 homes for sale
- 97836 homes for sale
- 97839 homes for sale
- 97843 homes for sale
- 97848 homes for sale
- 97856 homes for sale
- 98673 homes for sale
- 99356 homes for sale
Popular searches near Fossil, OR
- Arlington homes for sale
- Ashwood homes for sale
- Condon homes for sale
- Dayville homes for sale
- Dufur homes for sale
- Heppner homes for sale
- Ione homes for sale
- Ione-Lexington homes for sale
- Kimberly homes for sale
- Lexington homes for sale
- Madras homes for sale
- Maupin homes for sale
- Metolius homes for sale
- Mitchell homes for sale
- Moro homes for sale
- Ochoco West homes for sale
- Roosevelt homes for sale
- Tygh Valley homes for sale
- Wamic homes for sale
- Wasco homes for sale
Protect your home and budget from life's surprises with an Assurant Home Warranty, backed by a partner that supports you through every step of homeownership. Explore Plans.
©2026 Century 21 Real Estate LLC. All rights reserved. CENTURY 21®, the CENTURY 21 Logo and C21® are service marks owned by Century 21 Real Estate LLC. Century 21 Real Estate LLC fully supports the principles of the Fair Housing Act and the Equal Opportunity Act. Each office is independently owned and operated. Listing information is deemed reliable but not guaranteed accurate.