- Alberta homes for sale
- Beaver Creek homes for sale
- Brodnax homes for sale
- Dewitt homes for sale
- Dinwiddie homes for sale
- Dolphin homes for sale
- Emporia homes for sale
- Freeman homes for sale
- Henrico homes for sale
- Jarratt homes for sale
- Lawrenceville homes for sale
- McKenney homes for sale
- Meherrin homes for sale
- Powellton homes for sale
- Rawlings homes for sale
- Red Oak homes for sale
- Skippers homes for sale
- Stony Creek homes for sale
- Sturgeon homes for sale
- Totaro homes for sale
23856, VA - homes for sale
5 of 5 results displayed
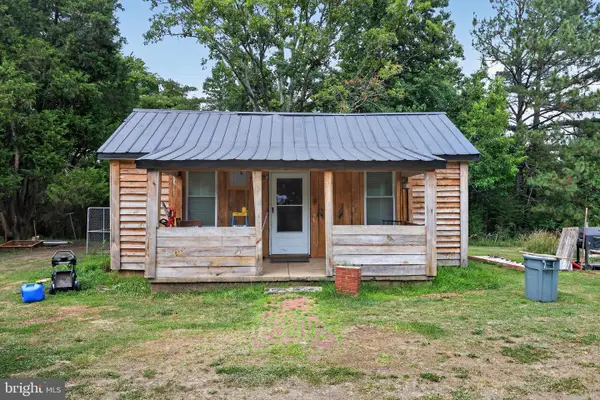 $70,000Pending2 beds 1 baths
405 County Pond Rd, FREEMAN, VA 23856
MLS# VABW2000124Listed by: SAMSON PROPERTIES $26,000Pending4.49 Acres
0 Freemans Cross Rd, FREEMAN, VA 23856
MLS# VABW2000122Listed by: SHERWOOD BASKERVILLE REAL ESTATE $90,000Active2 beds 1 baths854 sq. ft.
3796 Cut Bank Road, Warfield, VA 23889
MLS# 59755Listed by: REAL BROKER LLC $174,900Pending4 beds 2 baths2,079 sq. ft.
18101 Governor Harrison Parkway, Freeman, VA 23856
MLS# 2532671Listed by: SOUTHERN VIRGINIA REALTY INC $299,900Pending3 beds 2 baths1,358 sq. ft.
4646 Old Stage Road, Lawrenceville, VA 23868
MLS# 2529192Listed by: KELLER WILLIAMS
Local realty services provided by:CENTURY 21 Gold, CENTURY 21 Realty @ Home, CENTURY 21 Nachman Realty
Popular searches near 23856
Popular neighborhoods near 23856
- Beaufont, Richmond homes for sale
- Bellemeade, Richmond homes for sale
- Brookbury, Richmond homes for sale
- Cottrell Farms, Richmond homes for sale
- Davee Gardens, Richmond homes for sale
- Forest Hill Terrace, Richmond homes for sale
- Forest View, Richmond homes for sale
- Hickory Hill, Richmond homes for sale
- Jeff Davis, Richmond homes for sale
- McGuire, Richmond homes for sale
- Midlothian, Richmond homes for sale
- Oak Grove, Richmond homes for sale
- Piney Knolls, Richmond homes for sale
- Reedy Creek, Richmond homes for sale
- South Garden, Richmond homes for sale
- South Side, Richmond homes for sale
- Swansboro West, Richmond homes for sale
- Swanson, Richmond homes for sale
- Westover, Richmond homes for sale
- Woodhaven, Richmond homes for sale
Counties near Freeman, 23856
- Amelia County homes for sale
- Brunswick County homes for sale
- Chesterfield County homes for sale
- Colonial Heights city County homes for sale
- Dinwiddie County homes for sale
- Emporia city County homes for sale
- Franklin city County homes for sale
- Greensville County homes for sale
- Halifax County homes for sale
- Hertford County homes for sale
- Hopewell city County homes for sale
- Lunenburg County homes for sale
- Mecklenburg County homes for sale
- Northampton County homes for sale
- Nottoway County homes for sale
- Petersburg city County homes for sale
- Prince George County homes for sale
- Southampton County homes for sale
- Sussex County homes for sale
- Warren County homes for sale
Protect your home and budget from life's surprises with an Assurant Home Warranty, backed by a partner that supports you through every step of homeownership. Explore Plans.
©2026 Century 21 Real Estate LLC. All rights reserved. CENTURY 21®, the CENTURY 21 Logo and C21® are service marks owned by Century 21 Real Estate LLC. Century 21 Real Estate LLC fully supports the principles of the Fair Housing Act and the Equal Opportunity Act. Each office is independently owned and operated. Listing information is deemed reliable but not guaranteed accurate.