- Algiers Point, New Orleans homes for sale
- Bayou St. John, New Orleans homes for sale
- Broadmoor, New Orleans homes for sale
- Central Business District, New Orleans homes for sale
- Central City, New Orleans homes for sale
- Fairgrounds, New Orleans homes for sale
- Garden District, New Orleans homes for sale
- Gert Town, New Orleans homes for sale
- Hurtsville, New Orleans homes for sale
- Irish Channel, New Orleans homes for sale
- Lower Garden District, New Orleans homes for sale
- Marigny, New Orleans homes for sale
- McDonough, New Orleans homes for sale
- Mid-City, New Orleans homes for sale
- Milan, New Orleans homes for sale
- St Thomas, New Orleans homes for sale
- Seventh Ward, New Orleans homes for sale
- Tremé / Lafitte, New Orleans homes for sale
- Tulane, New Orleans homes for sale
- Whitney, New Orleans homes for sale
French Quarter, New Orleans, LA - homes for sale
300 of 454 results displayed
- New
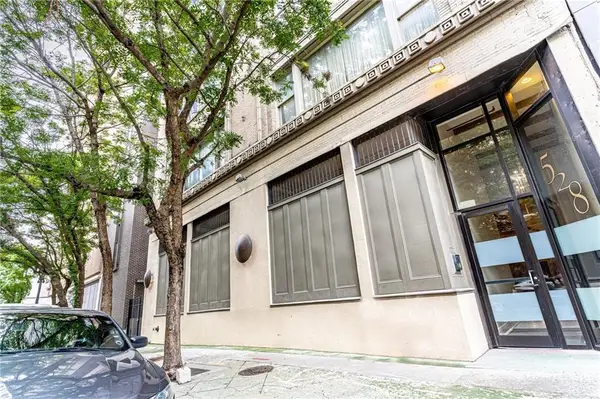 $550,000Active1 beds 1 baths1,328 sq. ft.
528 Baronne Street #401, New Orleans, LA 70113
MLS# 2550460Listed by: KELLER WILLIAMS REALTY NEW ORLEANS - New
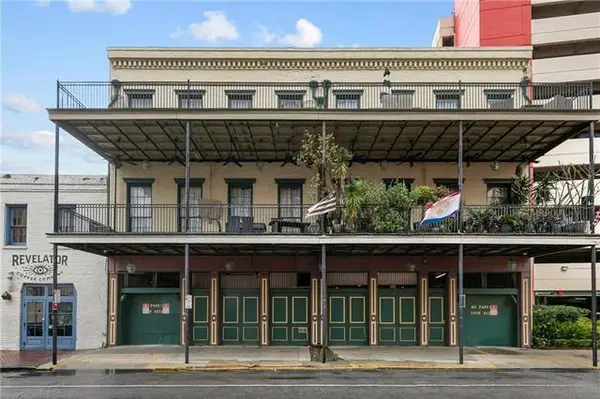 $329,000Active1 beds 1 baths784 sq. ft.
633 Tchoupitoulas Street #4, New Orleans, LA 70130
MLS# 2548023Listed by: DOWNTOWN REALTY - New
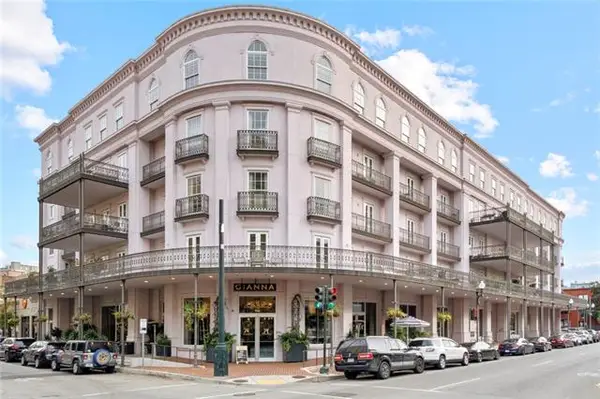
 $575,000Active1 beds 1 baths1,068 sq. ft.
700 Magazine Street #414, New Orleans, LA 70130
MLS# 2548411Listed by: MCENERY RESIDENTIAL, LLC - New
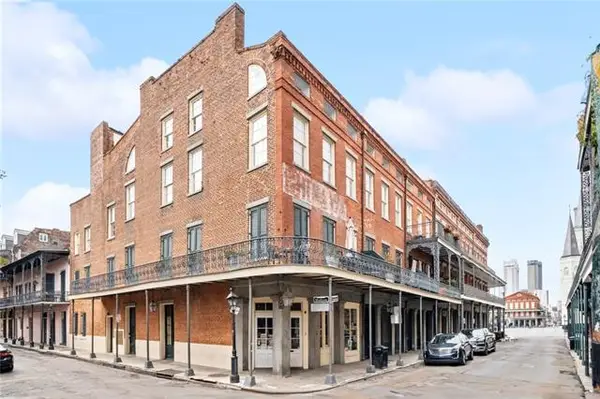
 $649,000Active1 beds 2 baths1,180 sq. ft.
700 Magazine Street #517, New Orleans, LA 70130
MLS# NO2548421Listed by: MCENERY RESIDENTIAL, LLC - New
 $399,000Active1 beds 1 baths719 sq. ft.
538 Madison Street #1B, New Orleans, LA 70116
MLS# NO2549736Listed by: FQR REALTORS  $725,000Pending1 beds 2 baths1,035 sq. ft.
2 Canal Street #1903, New Orleans, LA 70130
MLS# 2549963Listed by: COLDWELL BANKER TEC- New
 $645,000Active2 beds 2 baths1,904 sq. ft.
441 Gravier Street #10, New Orleans, LA 70130
MLS# 2547045Listed by: COMPASS UPTOWN-MAPLE ST (LATT28) - New
 $695,000Active3 beds 2 baths1,182 sq. ft.
1111 Tulane Avenue #604, New Orleans, LA 70112
MLS# NO2548904Listed by: MCENERY RESIDENTIAL, LLC - New
 $369,000Active1 beds 1 baths532 sq. ft.
1228 Royal Street #12, New Orleans, LA 70116
MLS# 2549620Listed by: REVE, REALTORS - New
 $449,000Active2 beds 1 baths980 sq. ft.
333 Chartres Street #E, New Orleans, LA 70130
MLS# 2549309Listed by: SHELNUTT REAL ESTATE ENTERPRISES - New
 $470,000Active2 beds 2 baths1,324 sq. ft.
1000 St Charles Avenue #D, New Orleans, LA 70130
MLS# 2549462Listed by: KELLER WILLIAMS REALTY 455-0100 - New
 $369,000Active1 beds 2 baths742 sq. ft.
420 Common Street #1A, New Orleans, LA 70130
MLS# 2549063Listed by: THE W GROUP REAL ESTATE LLC - New
 $1,200,000Active3 beds 2 baths2,467 sq. ft.
225 Girod Street #202, New Orleans, LA 70130
MLS# 2549018Listed by: COMPASS UPTOWN (LATT07) - New
 $215,000Active-- beds 1 baths300 sq. ft.
618 Dauphine Street #2C, New Orleans, LA 70112
MLS# NO2548496Listed by: PARALEX GROUP LLC - New
 $1,999,500Active2 beds 2 baths1,886 sq. ft.
600 Port Of New Orleans Place #5G, New Orleans, LA 70130
MLS# 2548096Listed by: COMPASS UPTOWN (LATT07)  $365,000Active2 beds 3 baths775 sq. ft.
618 Dauphine Street #1B, New Orleans, LA 70112
MLS# NO2547688Listed by: PARALEX GROUP LLC $5,900,000Active3 beds 6 baths5,000 sq. ft.
600 Port Of New Orleans Place #15F, New Orleans, LA 70130
MLS# 2548253Listed by: COMPASS UPTOWN (LATT07) $615,000Active2 beds 2 baths1,250 sq. ft.
700 S Peters Street #216, New Orleans, LA 70130
MLS# 2547254Listed by: REALTY ONE GROUP IMMOBILIA $295,000Active1 beds 1 baths652 sq. ft.
539 Toulouse Street #C, New Orleans, LA 70130
MLS# 2545096Listed by: COMPASS MANDEVILLE (LATT15) $265,000Active2 beds 1 baths1,003 sq. ft.
539 Toulouse Street #F, New Orleans, LA 70130
MLS# 2545112Listed by: COMPASS MANDEVILLE (LATT15) $195,000Active1 beds 1 baths294 sq. ft.
539 Toulouse Street #A, New Orleans, LA 70130
MLS# 2545042Listed by: COMPASS MANDEVILLE (LATT15) $279,000Active1 beds 1 baths575 sq. ft.
1030 Orleans Avenue #A, New Orleans, LA 70116
MLS# 2548428Listed by: REVE, REALTORS $425,000Active2 beds 2 baths1,390 sq. ft.
633 Tchoupitoulas Street #6, New Orleans, LA 70130
MLS# 2548311Listed by: COMPASS UPTOWN (LATT07) $180,000Active1 beds 1 baths520 sq. ft.
919 St Philip Street #2, New Orleans, LA 70116
MLS# 2526562Listed by: FQR REALTORS $487,000Active1 beds 1 baths800 sq. ft.
604 Esplanade Avenue #102, New Orleans, LA 70116
MLS# 2547600Listed by: EXP REALTY, LLC $395,000Active2 beds 1 baths705 sq. ft.
1127 Dauphine Street #203, New Orleans, LA 70116
MLS# 2547768Listed by: SNAP REALTY $749,900Active2 beds 3 baths1,711 sq. ft.
801 St Joseph Street #18, New Orleans, LA 70113
MLS# 2547480Listed by: MCENERY RESIDENTIAL, LLC $399,900Active1 beds 1 baths564 sq. ft.
533 St Philip Street #3, New Orleans, LA 70116
MLS# 2547440Listed by: REVE, REALTORS $410,900Active2 beds 2 baths677 sq. ft.
521 St Philip Street #4, New Orleans, LA 70116
MLS# 2547415Listed by: WURTH REAL ESTATE SERVICES $344,000Active1 beds 1 baths778 sq. ft.
1111 Tulane Avenue #708, New Orleans, LA 70112
MLS# 2547298Listed by: SNAP REALTY $679,000Active2 beds 2 baths1,237 sq. ft.
614 Baronne Street #301, New Orleans, LA 70113
MLS# 2547041Listed by: TALBOT REALTY GROUP $179,000Active-- beds 1 baths359 sq. ft.
539 Toulouse Street #D, New Orleans, LA 70130
MLS# 2538174Listed by: REVE, REALTORS $419,000Active2 beds 3 baths857 sq. ft.
923 Saint Philip Street #C, New Orleans, LA 70116
MLS# 2543684Listed by: 23 REALTY, LLC $799,000Active2 beds 2 baths1,409 sq. ft.
760 Magazine Street #PH, New Orleans, LA 70130
MLS# 2546755Listed by: REVE, REALTORS $599,000Active2 beds 2 baths998 sq. ft.
614 Baronne Street #303, New Orleans, LA 70113
MLS# 2547024Listed by: TALBOT REALTY GROUP $410,000Active1 beds 1 baths840 sq. ft.
700 S Peters Street #505, New Orleans, LA 70130
MLS# NO2546543Listed by: REALTY ONE GROUP IMMOBILIA $299,000Active1 beds 1 baths683 sq. ft.
334 Carondelet Street #410, New Orleans, LA 70130
MLS# NO2546945Listed by: SATSUMA REAL ESTATE LLC $428,000Active1 beds 2 baths892 sq. ft.
210 Decatur Street #202, New Orleans, LA 70112
MLS# 2546963Listed by: JON HUFFMAN REAL ESTATE $495,000Active2 beds 2 baths1,031 sq. ft.
210 Decatur Street #401, New Orleans, LA 70112
MLS# 2546965Listed by: JON HUFFMAN REAL ESTATE $1,115,000Active3 beds 3 baths2,029 sq. ft.
875 O'keefe Avenue #301, New Orleans, LA 70113
MLS# 2546905Listed by: VALMONT REALTORS $1,115,000Active3 beds 3 baths2,100 sq. ft.
875 O'keefe Avenue #302, New Orleans, LA 70113
MLS# 2546913Listed by: VALMONT REALTORS $1,115,000Active3 beds 3 baths2,100 sq. ft.
875 O'keefe Avenue #302, New Orleans, LA 70113
MLS# NO2546913Listed by: VALMONT REALTORS $579,000Active2 beds 2 baths1,068 sq. ft.
875 O'keefe Avenue #201, New Orleans, LA 70113
MLS# 2546814Listed by: VALMONT REALTORS $569,000Active2 beds 3 baths1,040 sq. ft.
875 O'keefe Avenue #205, New Orleans, LA 70113
MLS# 2546884Listed by: VALMONT REALTORS $350,000Active1 beds 1 baths638 sq. ft.
875 O'keefe Avenue #208, New Orleans, LA 70113
MLS# 2546895Listed by: VALMONT REALTORS $569,000Active2 beds 3 baths1,040 sq. ft.
875 O'keefe Avenue #205, New Orleans, LA 70113
MLS# NO2546884Listed by: VALMONT REALTORS $569,000Active2 beds 2 baths1,083 sq. ft.
875 O'keefe Avenue #204, New Orleans, LA 70113
MLS# 2546802Listed by: VALMONT REALTORS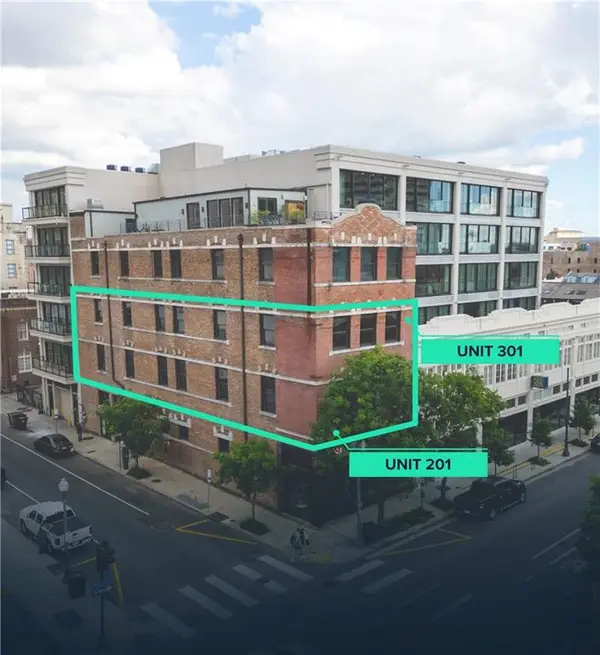 $2,900,000Active6 beds 8 baths4,920 sq. ft.
888 Girod Street #2 & 3, New Orleans, LA 70113
MLS# 2546751Listed by: SRSA RESIDENTIAL, INC. $349,000Active1 beds 1 baths621 sq. ft.
875 O'keefe Avenue #207, New Orleans, LA 70113
MLS# 2546758Listed by: VALMONT REALTORS $399,000Active1 beds 1 baths741 sq. ft.
875 O'keefe Avenue #206, New Orleans, LA 70113
MLS# 2546762Listed by: VALMONT REALTORS $579,000Active2 beds 2 baths1,000 sq. ft.
875 O'keefe Avenue #202, New Orleans, LA 70113
MLS# 2546763Listed by: VALMONT REALTORS $589,000Active2 beds 2 baths1,034 sq. ft.
875 O'keefe Avenue #203, New Orleans, LA 70113
MLS# 2546764Listed by: VALMONT REALTORS $1,075,000Active3 beds 3 baths1,934 sq. ft.
875 O'keefe Avenue #102, New Orleans, LA 70113
MLS# 2546644Listed by: VALMONT REALTORS $579,000Active2 beds 2 baths1,068 sq. ft.
875 O'keefe Avenue #101, New Orleans, LA 70113
MLS# 2546752Listed by: VALMONT REALTORS $595,000Active2 beds 2 baths1,083 sq. ft.
875 O'keefe Avenue #103, New Orleans, LA 70113
MLS# 2546754Listed by: VALMONT REALTORS $399,000Active2 beds 2 baths972 sq. ft.
334 Carondelet Street #302, New Orleans, LA 70130
MLS# 2546734Listed by: SATSUMA REAL ESTATE LLC $359,000Active1 beds 1 baths962 sq. ft.
1111 Tulane Avenue #222, New Orleans, LA 70112
MLS# NO2545640Listed by: GALIANO REALTY $215,000Active-- beds 1 baths277 sq. ft.
1228 Royal Street #2, New Orleans, LA 70116
MLS# 2545956Listed by: REMAX CRESCENT COLLECTIVE LLC $425,000Pending2 beds 2 baths1,113 sq. ft.
333 Julia Street #519, New Orleans, LA 70130
MLS# 2520413Listed by: WITRY COLLECTIVE, L.L.C. $320,000Active2 beds 2 baths902 sq. ft.
1201 Canal Street #362, New Orleans, LA 70112
MLS# 2546073Listed by: COMPASS HISTORIC (LATT09) $429,000Active2 beds 2 baths800 sq. ft.
526 Madison Street #1B, New Orleans, LA 70116
MLS# 2542344Listed by: HOMESMART REALTY SOUTH $270,000Active2 beds 1 baths739 sq. ft.
700 Commerce Street #216, New Orleans, LA 70130
MLS# 2543562Listed by: CRESCENT SOTHEBY'S INTL REALTY $499,000Active1 beds 2 baths950 sq. ft.
828 St Charles Avenue #4, New Orleans, LA 70130
MLS# 2545613Listed by: REVE, REALTORS $429,000Active2 beds 2 baths800 sq. ft.
526 Madison Street #1B, New Orleans, LA 70116
MLS# NO2542344Listed by: HOMESMART REALTY SOUTH $259,900Active2 beds 1 baths848 sq. ft.
1201 Canal Street #474, New Orleans, LA 70112
MLS# 2546048Listed by: REALTY ONE GROUP IMMOBILIA $599,000Active3 beds 1 baths1,428 sq. ft.
862 Camp Street #1, New Orleans, LA 70130
MLS# 2545978Listed by: REVE, REALTORS $320,000Active1 beds 1 baths450 sq. ft.
1029 Barracks Street #2, New Orleans, LA 70116
MLS# 2545164Listed by: SHELNUTT REAL ESTATE ENTERPRISES $795,500Active3 beds 3 baths1,513 sq. ft.
1201 Chartres Street #18, New Orleans, LA 70116
MLS# 2545641Listed by: WURTH REAL ESTATE SERVICES $429,000Active2 beds 2 baths1,197 sq. ft.
220 Decatur Street #304, New Orleans, LA 70130
MLS# RANO2503113Listed by: LATTER & BLUM (LATT18) $429,000Active2 beds 2 baths1,144 sq. ft.
220 Decatur Street #302, New Orleans, LA 70130
MLS# RANO2503120Listed by: LATTER & BLUM (LATT18)- $530,000Active2 beds 2 baths1,576 sq. ft.
404 Notre Dame Street #24, New Orleans, LA 70130
MLS# RANO2516074Listed by: LATTER & BLUM (LATT09)  $1,450,000Active3 beds 4 baths2,460 sq. ft.
888 Girod Street #301, New Orleans, LA 70113
MLS# 2545686Listed by: SRSA RESIDENTIAL, INC. $1,450,000Active3 beds 4 baths2,460 sq. ft.
888 Girod Street #301, New Orleans, LA 70113
MLS# 2545686Listed by: SRSA RESIDENTIAL, INC. $599,900Active2 beds 2 baths1,385 sq. ft.
917 Conti Street #102, New Orleans, LA 70112
MLS# 2514683Listed by: TALBOT REALTY GROUP $375,000Active2 beds 2 baths1,047 sq. ft.
333 Julia Street #325, New Orleans, LA 70130
MLS# 2545456Listed by: GALIANO REALTY $185,000Active-- beds 1 baths268 sq. ft.
727 Barracks Street #3, New Orleans, LA 70116
MLS# 2545495Listed by: KELLER WILLIAMS REALTY 455-0100 $920,900Active3 beds 2 baths1,438 sq. ft.
888 Baronne Street #PH 6, New Orleans, LA 70113
MLS# 2545345Listed by: TALBOT REALTY GROUP $238,000Active1 beds 1 baths442 sq. ft.
727 Barracks Street #5, New Orleans, LA 70116
MLS# 2516626Listed by: KELLER WILLIAMS REALTY 455-0100 $359,000Active2 beds 2 baths1,155 sq. ft.
1201 Canal Street #327, New Orleans, LA 70112
MLS# 2544028Listed by: COMPASS HISTORIC (LATT09) $220,000Active1 beds 1 baths620 sq. ft.
1201 Canal Street #315, New Orleans, LA 70112
MLS# 2545119Listed by: KELLER WILLIAMS REALTY 455-0100 $329,000Active2 beds 2 baths990 sq. ft.
1201 Canal Street #407, New Orleans, LA 70112
MLS# 2544833Listed by: COMPASS HISTORIC (LATT09) $189,000Active1 beds 1 baths558 sq. ft.
1201 Canal Street #504, New Orleans, LA 70112
MLS# 2544837Listed by: COMPASS HISTORIC (LATT09) $212,000Active1 beds 1 baths620 sq. ft.
1201 Canal Street #515, New Orleans, LA 70112
MLS# 2544841Listed by: COMPASS HISTORIC (LATT09) $449,000Active1 beds 2 baths867 sq. ft.
518 Governor Nicholls Street #102, New Orleans, LA 70116
MLS# 2545131Listed by: MCENERY RESIDENTIAL, LLC $199,999Active-- beds 1 baths362 sq. ft.
618 Dauphine Street #2D, New Orleans, LA 70112
MLS# 2544274Listed by: PARALEX GROUP LLC $299,000Active1 beds 1 baths701 sq. ft.
518 Governor Nicholls Street #401, New Orleans, LA 70116
MLS# 2545076Listed by: MCENERY RESIDENTIAL, LLC $475,000Active2 beds 1 baths875 sq. ft.
518 Governor Nicholls Street #301, New Orleans, LA 70116
MLS# 2530976Listed by: MCENERY RESIDENTIAL, LLC $475,000Active2 beds 2 baths1,064 sq. ft.
524 Governor Nicholls Street #301, New Orleans, LA 70116
MLS# NO2544903Listed by: THE MCENERY COMPANY- Open Wed, 11am to 1pm
 $800,000Active1 beds 2 baths1,050 sq. ft.
2 Canal Street #2102, New Orleans, LA 70130
MLS# 2543556Listed by: COLDWELL BANKER TEC - Open Wed, 11am to 1pm
 $4,500,000Active-- beds -- baths3,992 sq. ft.
2 Canal Street #3004, New Orleans, LA 70130
MLS# 2543594Listed by: COLDWELL BANKER TEC - Open Wed, 11am to 1pm
 $2,625,000Active3 beds 4 baths2,643 sq. ft.
2 Canal Street #2303, New Orleans, LA 70130
MLS# 2543803Listed by: COLDWELL BANKER TEC  $1,800,000Active2 beds 3 baths1,950 sq. ft.
2 Canal Street #2604, New Orleans, LA 70130
MLS# 2543820Listed by: COLDWELL BANKER TEC $495,000Active1 beds 1 baths947 sq. ft.
1001 Julia Street #9G, New Orleans, LA 70113
MLS# 2544863Listed by: KELLER WILLIAMS REALTY 455-0100 $545,000Active2 beds 2 baths1,103 sq. ft.
628 Baronne Street #402, New Orleans, LA 70113
MLS# 2544883Listed by: TALBOT REALTY GROUP $399,000Active1 beds 1 baths792 sq. ft.
628 Baronne Street #403, New Orleans, LA 70113
MLS# 2544887Listed by: TALBOT REALTY GROUP $240,000Active-- beds 1 baths413 sq. ft.
524 Governor Nicholls Street #202, New Orleans, LA 70116
MLS# 2544889Listed by: THE MCENERY COMPANY $944,000Active3 beds 3 baths1,895 sq. ft.
628 Baronne Street #402-3, New Orleans, LA 70113
MLS# 2544836Listed by: TALBOT REALTY GROUP $944,000Active3 beds 3 baths1,895 sq. ft.
628 Baronne Street #402-3, New Orleans, LA 70113
MLS# NO2544836Listed by: TALBOT REALTY GROUP $1,000,900Active2 beds 2 baths1,504 sq. ft.
888 Baronne Street #PH 5, New Orleans, LA 70113
MLS# 2544799Listed by: TALBOT REALTY GROUP $339,000Active1 beds 1 baths654 sq. ft.
518 Governor Nicholls Street #101, New Orleans, LA 70116
MLS# 2544803Listed by: MCENERY RESIDENTIAL, LLC $795,000Active3 beds 3 baths2,855 sq. ft.
801 St Joseph Street #7, New Orleans, LA 70113
MLS# NO2544247Listed by: COMPASS UPTOWN (LATT07) $399,000Active1 beds 2 baths921 sq. ft.
1040 Chartres Street #D9, New Orleans, LA 70116
MLS# 2544182Listed by: REVE, REALTORS $3,900,000Active3 beds 5 baths3,836 sq. ft.
416 Common Street #PHB, New Orleans, LA 70130
MLS# 2539316Listed by: COMPASS UPTOWN-MAPLE ST (LATT28) $3,900,000Active3 beds 5 baths3,836 sq. ft.
416 Common Street #PHB, New Orleans, LA 70130
MLS# NO2539316Listed by: COMPASS UPTOWN-MAPLE ST (LATT28)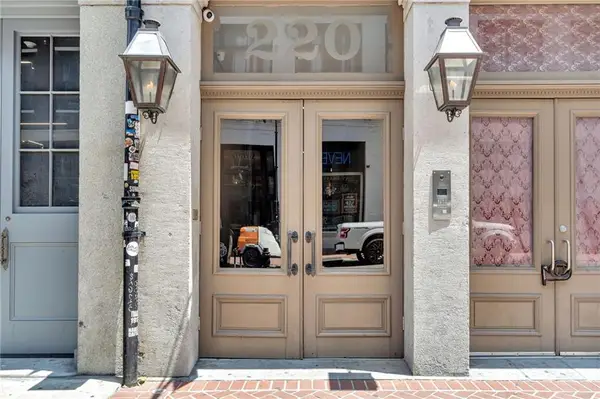 $425,000Active2 beds 2 baths1,144 sq. ft.
220 Decatur Street #302, New Orleans, LA 70130
MLS# 2543987Listed by: COMPASS GARDEN DISTRICT (LATT18) $425,000Active2 beds 2 baths1,197 sq. ft.
220 Decatur Street #304, New Orleans, LA 70130
MLS# 2543995Listed by: COMPASS GARDEN DISTRICT (LATT18) $1,825,000Active2 beds 2 baths1,886 sq. ft.
600 Port Of New Orleans Place #7G, New Orleans, LA 70130
MLS# 2544006Listed by: COMPASS UPTOWN (LATT07) $839,000Active2 beds 2 baths1,766 sq. ft.
755 Camp Street #755, New Orleans, LA 70130
MLS# 2542379Listed by: COLDWELL BANKER TEC MAGAZINE $385,000Active2 beds 1 baths986 sq. ft.
1031 Barracks Street #4, New Orleans, LA 70116
MLS# NO2543766Listed by: KELLER WILLIAMS REALTY NEW ORLEANS $520,000Active2 beds 2 baths1,097 sq. ft.
224 Chartres Street #4B, New Orleans, LA 70130
MLS# 2543533Listed by: MIRAMBELL REALTY $1,100,900Active3 beds 2 baths1,752 sq. ft.
888 Baronne Street #PH 1, New Orleans, LA 70113
MLS# 2543290Listed by: TALBOT REALTY GROUP $799,000Active2 beds 2 baths1,919 sq. ft.
422 Notre Dame Street #3, New Orleans, LA 70130
MLS# 2543326Listed by: EXP REALTY, LLC $585,000Active2 beds 2 baths1,070 sq. ft.
936 Conti Street #14, New Orleans, LA 70112
MLS# 2542670Listed by: JOHN ANTHONY REALTY LLC $529,000Active2 beds 2 baths783 sq. ft.
718 Barracks Street #4, New Orleans, LA 70116
MLS# 2542828Listed by: COMPASS UPTOWN (LATT07) $325,000Active2 beds 1 baths711 sq. ft.
740 Esplanade Avenue #23, New Orleans, LA 70116
MLS# 2543029Listed by: ENGEL & VLKERS NEW ORLEANS $220,500Active1 beds 1 baths545 sq. ft.
1201 Canal Street #206, New Orleans, LA 70112
MLS# 2486489Listed by: ENGEL & VLKERS NEW ORLEANS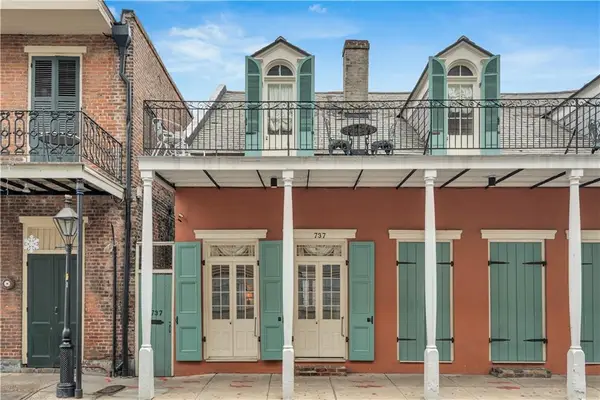 $695,000Active3 beds 3 baths1,432 sq. ft.
737 St Ann Street #737, New Orleans, LA 70116
MLS# 2543010Listed by: ENGEL & VLKERS NEW ORLEANS $925,900Active2 beds 2 baths1,449 sq. ft.
888 Baronne Street #PH 4, New Orleans, LA 70113
MLS# 2542916Listed by: TALBOT REALTY GROUP $925,900Active2 beds 2 baths1,449 sq. ft.
888 Baronne Street #PH 4, New Orleans, LA 70113
MLS# NO2542916Listed by: TALBOT REALTY GROUP $540,000Active2 beds 2 baths1,059 sq. ft.
336 Camp Street #301, New Orleans, LA 70130
MLS# 2542513Listed by: COOL MURPHY, LLC $851,900Active2 beds 2 baths1,271 sq. ft.
888 Baronne Street #PH 8, New Orleans, LA 70113
MLS# 2541734Listed by: TALBOT REALTY GROUP $399,000Active2 beds 2 baths941 sq. ft.
835 Royal Street #835, New Orleans, LA 70116
MLS# NO2539523Listed by: MIRAMBELL REALTY $349,900Pending2 beds 2 baths773 sq. ft.
618 Dauphine Street #2A, New Orleans, LA 70112
MLS# NO2541991Listed by: PARALEX GROUP LLC $439,000Active1 beds 1 baths755 sq. ft.
936 Conti Street #5, New Orleans, LA 70112
MLS# 2541877Listed by: FQR REALTORS $1,500,000Active3 beds 4 baths1,828 sq. ft.
1001 Julia Street #9E, New Orleans, LA 70113
MLS# NO2541163Listed by: KELLER WILLIAMS REALTY NEW ORLEANS $255,000Active1 beds 1 baths716 sq. ft.
333 Julia Street #408, New Orleans, LA 70130
MLS# NO2534265Listed by: TRELORA REALTY, INC. $544,950Active2 beds 2 baths1,557 sq. ft.
938 St Louis Street #938, New Orleans, LA 70112
MLS# 2541164Listed by: REMAX CRESCENT COLLECTIVE LLC $749,900Active2 beds 2 baths1,583 sq. ft.
731 St Charles Avenue #510, New Orleans, LA 70130
MLS# 2529604Listed by: TALBOT REALTY GROUP $319,500Active2 beds 2 baths965 sq. ft.
760 Magazine Street #207, New Orleans, LA 70130
MLS# 2536221Listed by: TALBOT REALTY GROUP $475,000Active2 beds 1 baths875 sq. ft.
518 Governor Nicholls Street #301, New Orleans, LA 70116
MLS# NO2530976Listed by: MCENERY RESIDENTIAL, LLC- $375,000Active2 beds 1 baths863 sq. ft.
415 Burgundy Street #3A, New Orleans, LA 70112
MLS# NO2538534Listed by: EXP REALTY, LLC  $250,000Active-- beds 1 baths100 sq. ft.
715 Royal Street #H, New Orleans, LA 70116
MLS# 2540673Listed by: COOL MURPHY, LLC $1,450,000Active3 beds 4 baths2,460 sq. ft.
888 Girod Street #201, New Orleans, LA 70113
MLS# 2540212Listed by: SRSA RESIDENTIAL, INC. $195,000Pending2 beds 2 baths902 sq. ft.
1201 Canal Street #562, New Orleans, LA 70112
MLS# 2540106Listed by: KELLER WILLIAMS REALTY NEW ORLEANS $450,000Active1 beds 1 baths901 sq. ft.
620 Decatur Street #S, New Orleans, LA 70130
MLS# NO2539928Listed by: FQR REALTORS $299,000Active1 beds 1 baths510 sq. ft.
433 Burgundy Street #1, New Orleans, LA 70112
MLS# 2539261Listed by: FQR REALTORS $699,000Active2 beds 2 baths1,300 sq. ft.
614 Baronne Street #304-B, New Orleans, LA 70113
MLS# NO2539576Listed by: TALBOT REALTY GROUP $355,000Active2 beds 1 baths677 sq. ft.
940 Orleans Ave #5, New Orleans, LA 70116
MLS# BR2025013194Listed by: LISTWITHFREEDOM.COM, INC $510,000Active-- beds 1 baths1,175 sq. ft.
332 Exchange Place #1, New Orleans, LA 70130
MLS# NO2418414Listed by: JOSIE RHODES REALTY COMPANY $2,390,000Active2 beds 3 baths2,639 sq. ft.
600 Port Of New Orleans Place #6F, New Orleans, LA 70130
MLS# NO2469967Listed by: COMPASS UPTOWN (LATT07) $259,000Active1 beds 1 baths717 sq. ft.
333 Julia Street #508, New Orleans, LA 70130
MLS# NO2470104Listed by: FORTE REALTY, LLC $250,000Active1 beds 1 baths896 sq. ft.
333 Julia Street #516, New Orleans, LA 70130
MLS# NO2475123Listed by: CRESCENT CITY LIVING, LLC $599,000Active1 beds 1 baths1,149 sq. ft.
700 Magazine Street #514, New Orleans, LA 70130
MLS# NO2477656Listed by: MCENERY RESIDENTIAL, LLC $240,000Active2 beds 2 baths807 sq. ft.
700 Commerce Street #311, New Orleans, LA 70130
MLS# NO2481651Listed by: BERKSHIRE HATHAWAY HOMESERVICES PREFERRED, REALTOR $2,349,000Active2 beds 3 baths1,865 sq. ft.
2 Canal Street #2301, New Orleans, LA 70130
MLS# NO2487934Listed by: FQR REALTORS $235,000Active1 beds 1 baths982 sq. ft.
1017 Conti Street #2, New Orleans, LA 70112
MLS# NO2490947Listed by: FQR REALTORS $349,900Active2 beds 2 baths1,014 sq. ft.
1201 Canal Street #511, New Orleans, LA 70112
MLS# NO2492539Listed by: PINTAT REALTY LLC $229,000Active1 beds 1 baths640 sq. ft.
1201 Canal Street #561, New Orleans, LA 70112
MLS# NO2492739Listed by: COMPASS HISTORIC (LATT09) $445,000Active2 beds 2 baths1,134 sq. ft.
220 Decatur Street #202, New Orleans, LA 70130
MLS# NO2495645Listed by: KELLER WILLIAMS REALTY 455-0100 $955,000Active2 beds 3 baths1,482 sq. ft.
1001 Julia Street #6D, New Orleans, LA 70113
MLS# NO2495898Listed by: COMPASS GARDEN DISTRICT (LATT18) $469,900Active1 beds 1 baths717 sq. ft.
716 Governor Nicholls Street #C, New Orleans, LA 70116
MLS# NO2497148Listed by: TALBOT REALTY GROUP $249,000Active2 beds 2 baths1,121 sq. ft.
412 Dauphine Street #4A, New Orleans, LA 70112
MLS# NO2497790Listed by: FQR REALTORS $395,000Active3 beds 3 baths1,070 sq. ft.
1020 Esplanade Avenue #204, New Orleans, LA 70116
MLS# NO2498625Listed by: FQR REALTORS $795,000Active2 beds 3 baths1,015 sq. ft.
911 Governor Nicholls Street #G, New Orleans, LA 70116
MLS# NO2499210Listed by: BURK BROKERAGE, LLC $240,000Active1 beds 1 baths555 sq. ft.
1201 Canal Street #416, New Orleans, LA 70112
MLS# NO2499313Listed by: COMPASS UPTOWN-MAPLE ST (LATT28) $1,495,000Active5 beds 5 baths4,633 sq. ft.
842 Camp Street #7, New Orleans, LA 70130
MLS# NO2501612Listed by: KELLER WILLIAMS REALTY NEW ORLEANS $339,000Active1 beds 1 baths743 sq. ft.
627 Ursulines Avenue #9, New Orleans, LA 70116
MLS# NO2502231Listed by: JAMES HENDERSON PROPERTIES $845,000Active2 beds 3 baths1,102 sq. ft.
911 Governor Nicholls Street #J, New Orleans, LA 70116
MLS# NO2504093Listed by: BURK BROKERAGE, LLC $995,000Active2 beds 3 baths1,340 sq. ft.
911 Governor Nicholls Street #H, New Orleans, LA 70116
MLS# NO2504096Listed by: BURK BROKERAGE, LLC $1,295,000Active3 beds 4 baths1,805 sq. ft.
911 Governor Nicholls Street #I, New Orleans, LA 70116
MLS# NO2504100Listed by: BURK BROKERAGE, LLC $575,000Active2 beds 1 baths1,024 sq. ft.
732 Royal Street #C, New Orleans, LA 70116
MLS# NO2505055Listed by: ETHEL KIDD REAL ESTATE, L.L.C. $295,000Active2 beds 1 baths829 sq. ft.
760 Magazine Street #303, New Orleans, LA 70130
MLS# NO2508004Listed by: UNITED REAL ESTATE PARTNERS LLC $335,000Active1 beds 2 baths940 sq. ft.
1303 Burgundy Street #3, New Orleans, LA 70116
MLS# NO2508552Listed by: COMPASS HISTORIC (LATT09) $210,000Active1 beds 1 baths332 sq. ft.
1133 Royal Street #7, New Orleans, LA 70116
MLS# NO2511144Listed by: WURTH REAL ESTATE SERVICES $600,000Active4 beds 7 baths1,954 sq. ft.
620 Decatur Street #PHB3, New Orleans, LA 70130
MLS# NO2511153Listed by: WURTH REAL ESTATE SERVICES $270,000Active1 beds 1 baths593 sq. ft.
718 Barracks Street #6, New Orleans, LA 70116
MLS# NO2511157Listed by: WURTH REAL ESTATE SERVICES $499,000Active1 beds 1 baths841 sq. ft.
620 Decatur Street #P, New Orleans, LA 70130
MLS# NO2512649Listed by: WURTH REAL ESTATE SERVICES $2,299,000Active3 beds 4 baths3,610 sq. ft.
600 Port Of New Orleans Place #9CD, New Orleans, LA 70130
MLS# NO2514388Listed by: COMPASS UPTOWN (LATT07) $599,900Active2 beds 2 baths1,385 sq. ft.
917 Conti Street #102, New Orleans, LA 70112
MLS# NO2514683Listed by: TALBOT REALTY GROUP $560,000Active1 beds 1 baths947 sq. ft.
1001 Julia Street #13G, New Orleans, LA 70113
MLS# NO2515492Listed by: COMPASS UPTOWN-MAPLE ST (LATT28) $875,000Active2 beds 2 baths1,407 sq. ft.
1001 Julia Street #10F, New Orleans, LA 70113
MLS# NO2516235Listed by: COMPASS GARDEN DISTRICT (LATT18) $290,000Active2 beds 2 baths834 sq. ft.
1201 Canal Street #358, New Orleans, LA 70112
MLS# NO2516470Listed by: COMPASS HISTORIC (LATT09) $260,000Active1 beds 1 baths507 sq. ft.
727 Barracks Street #4, New Orleans, LA 70116
MLS# NO2516622Listed by: KELLER WILLIAMS REALTY 455-0100 $1,699,000Active3 beds 3 baths1,935 sq. ft.
208 Bienville Street #4, New Orleans, LA 70130
MLS# NO2517467Listed by: CORPORATE REALTY REALTY LEASING COMPANY, INC. $288,000Active1 beds 1 baths507 sq. ft.
727 Barracks Street #7, New Orleans, LA 70116
MLS# NO2517956Listed by: ETHEL KIDD REAL ESTATE, L.L.C. $599,000Active2 beds 2 baths1,740 sq. ft.
422 Notre Dame Street #1, New Orleans, LA 70130
MLS# NO2519470Listed by: EXP REALTY, LLC $2,980,000Active3 beds 3 baths2,071 sq. ft.
2 Canal Street #2402, New Orleans, LA 70130
MLS# NO2519633Listed by: COMPASS UPTOWN-MAPLE ST (LATT28) $395,000Active2 beds 2 baths1,137 sq. ft.
333 Julia Street #331, New Orleans, LA 70130
MLS# NO2520406Listed by: RAYMOND REAL ESTATE LLC $1,095,000Pending2 beds 2 baths2,014 sq. ft.
1022 St Peter Street #201, New Orleans, LA 70116
MLS# NO2520583Listed by: COMPASS UPTOWN-MAPLE ST (LATT28) $325,000Active1 beds 1 baths559 sq. ft.
611 Dauphine Street #E, New Orleans, LA 70112
MLS# NO2521046Listed by: REVE, REALTORS $499,900Active1 beds 1 baths1,328 sq. ft.
528 Baronne Street #504, New Orleans, LA 70113
MLS# NO2521538Listed by: TALBOT REALTY GROUP $500,000Active2 beds 3 baths1,422 sq. ft.
1225 Bourbon Street #E, New Orleans, LA 70116
MLS# NO2522919Listed by: FQR REALTORS $535,000Active2 beds 2 baths1,053 sq. ft.
740 Esplanade Avenue #7/11, New Orleans, LA 70116
MLS# NO2524419Listed by: ENGEL & VOELKERS NEW ORLEANS $599,900Active2 beds 2 baths1,421 sq. ft.
809 Burgundy Street #809, New Orleans, LA 70116
MLS# NO2524898Listed by: REGISTER REAL ESTATE, INC. $199,000Active-- beds 1 baths414 sq. ft.
1004 Governor Nicholls Street #G, New Orleans, LA 70116
MLS# NO2525531Listed by: REVE, REALTORS $215,000Active-- beds 1 baths281 sq. ft.
931 Royal Street #5, New Orleans, LA 70116
MLS# NO2525731Listed by: UNITED REAL ESTATE PARTNERS, LLC $6,200,000Active3 beds 4 baths3,158 sq. ft.
2 Canal Street #2505, New Orleans, LA 70130
MLS# NO2525896Listed by: CRESCENT SOTHEBY'S INTERNATIONAL $995,000Active2 beds 2 baths1,313 sq. ft.
625 St Charles Avenue #10C, New Orleans, LA 70130
MLS# NO2525945Listed by: REVE, REALTORS $260,000Active2 beds 2 baths831 sq. ft.
700 Commerce Street #314, New Orleans, LA 70130
MLS# NO2526272Listed by: CRESCENT CITY LIVING, LLC $249,000Active1 beds 1 baths626 sq. ft.
760 Magazine Street #117, New Orleans, LA 70130
MLS# NO2526703Listed by: KELLER WILLIAMS REALTY 455-0100 $250,000Active1 beds 1 baths432 sq. ft.
1112 Royal Street #A, New Orleans, LA 70116
MLS# NO2526880Listed by: WURTH REAL ESTATE SERVICES $350,000Active1 beds 1 baths881 sq. ft.
1114 Royal Street #A, New Orleans, LA 70116
MLS# NO2526887Listed by: WURTH REAL ESTATE SERVICES $410,000Active1 beds 1 baths564 sq. ft.
415 Burgundy Street #1B, New Orleans, LA 70112
MLS# NO2526898Listed by: EXP REALTY, LLC $350,000Active1 beds 1 baths846 sq. ft.
1116 Royal Street #A, New Orleans, LA 70116
MLS# NO2526914Listed by: WURTH REAL ESTATE SERVICES $350,000Active1 beds 1 baths911 sq. ft.
1116 Royal Street #B, New Orleans, LA 70116
MLS# NO2526918Listed by: WURTH REAL ESTATE SERVICES $3,800,000Active3 beds 4 baths2,680 sq. ft.
2 Canal Street #2308, New Orleans, LA 70130
MLS# NO2526951Listed by: COMPASS UPTOWN (LATT07) $265,000Active-- beds 1 baths591 sq. ft.
718 Barracks Street #2, New Orleans, LA 70116
MLS# NO2527000Listed by: ENGEL & VOELKERS NEW ORLEANS $484,000Active1 beds 1 baths782 sq. ft.
415 Burgundy Street #2A, New Orleans, LA 70112
MLS# NO2527630Listed by: EXP REALTY, LLC $795,000Active2 beds 3 baths1,500 sq. ft.
609 Governor Nicholls Street #19, New Orleans, LA 70116
MLS# NO2528312Listed by: WURTH REAL ESTATE SERVICES $799,900Active2 beds 2 baths1,245 sq. ft.
700 Magazine Street #515, New Orleans, LA 70130
MLS# NO2528379Listed by: COMPASS UPTOWN (LATT07) $459,000Active2 beds 2 baths1,170 sq. ft.
923 St Philip Street #A&B, New Orleans, LA 70116
MLS# NO2528590Listed by: REVE, REALTORS $389,000Active1 beds 1 baths1,374 sq. ft.
822 Governor Nicholls Street #4, New Orleans, LA 70116
MLS# NO2528767Listed by: WURTH REAL ESTATE SERVICES $209,000Active1 beds 1 baths425 sq. ft.
923 St Ann Street #2, New Orleans, LA 70116
MLS# NO2529121Listed by: KELLER WILLIAMS REALTY NEW ORLEANS $820,000Active3 beds 2 baths1,778 sq. ft.
909 Lafayette Street #6, New Orleans, LA 70113
MLS# NO2529244Listed by: REDFIN CORPORATION $419,000Active1 beds 1 baths767 sq. ft.
533 St Philip Street #1, New Orleans, LA 70116
MLS# NO2530038Listed by: REVE, REALTORS $429,900Active1 beds 1 baths640 sq. ft.
827 Burgundy Street #C, New Orleans, LA 70116
MLS# NO2530192Listed by: COMPASS HISTORIC (LATT09) $625,000Active4 beds 2 baths1,394 sq. ft.
1111 Tulane Avenue #601, New Orleans, LA 70112
MLS# NO2530313Listed by: BRIDGEWATER REALTY ADVISORS, LLC $440,000Active1 beds 1 baths1,265 sq. ft.
821 Perdido Street #3C, New Orleans, LA 70112
MLS# NO2530416Listed by: HOSPITALITY REALTY $499,000Active2 beds 2 baths1,127 sq. ft.
524 Governor Nicholls Street #201, New Orleans, LA 70116
MLS# NO2530715Listed by: MCENERY RESIDENTIAL, LLC $615,000Active3 beds 3 baths1,519 sq. ft.
528 St Louis Street #302, New Orleans, LA 70130
MLS# NO2530871Listed by: REVE, REALTORS $348,000Active1 beds 1 baths612 sq. ft.
524 Governor Nicholls Street #101, New Orleans, LA 70116
MLS# NO2530977Listed by: MCENERY RESIDENTIAL, LLC $299,000Active1 beds 1 baths912 sq. ft.
524 Governor Nicholls Street #401, New Orleans, LA 70116
MLS# NO2531299Listed by: MCENERY RESIDENTIAL, LLC $248,000Active1 beds 1 baths432 sq. ft.
524 Governor Nicholls Street #102, New Orleans, LA 70116
MLS# NO2531368Listed by: MCENERY RESIDENTIAL, LLC $275,000Active1 beds 2 baths963 sq. ft.
760 Magazine Street #214, New Orleans, LA 70130
MLS# NO2531559Listed by: COMPASS UPTOWN (LATT07) $355,000Active1 beds 1 baths549 sq. ft.
719 St. Ann Street #2, New Orleans, LA 70116
MLS# NO2531593Listed by: CHRISTIAN SHANE PROPERTIES $305,000Pending2 beds 1 baths851 sq. ft.
1224 Bourbon Street #1, New Orleans, LA 70116
MLS# NO2532448Listed by: FQR REALTORS $475,000Active2 beds 2 baths960 sq. ft.
220 Decatur Street #306, New Orleans, LA 70130
MLS# NO2532505Listed by: ENGEL & VOLKERS SLIDELL - MANDEVILLE $295,000Active1 beds 1 baths593 sq. ft.
718 Barracks Street #5, New Orleans, LA 70116
MLS# NO2532519Listed by: COMPASS HISTORIC (LATT09) $184,000Active1 beds 1 baths551 sq. ft.
1323 Dauphine Street #3, New Orleans, LA 70116
MLS# NO2532947Listed by: HOMESMART REALTY SOUTH $747,000Active2 beds 3 baths1,655 sq. ft.
627 Ursulines Street #6, New Orleans, LA 70116
MLS# NO2533120Listed by: LALLA REAL ESTATE, LLC $337,000Pending1 beds 1 baths681 sq. ft.
1022 Toulouse Street #PC-3, New Orleans, LA 70112
MLS# NO2533220Listed by: BERKSHIRE HATHAWAY HOMESERVICES PREFERRED, REALTOR $565,000Active2 beds 1 baths1,017 sq. ft.
610 N Rampart Street #C, New Orleans, LA 70112
MLS# NO2533229Listed by: WURTH REAL ESTATE SERVICES $395,000Active2 beds 2 baths683 sq. ft.
811 St Peter Street #811, New Orleans, LA 70116
MLS# NO2533241Listed by: COMPASS UPTOWN-MAPLE ST (LATT28) $389,000Active2 beds 2 baths842 sq. ft.
835 St Louis Street #A, New Orleans, LA 70112
MLS# NO2533269Listed by: COMPASS UPTOWN-MAPLE ST (LATT28) $23,000,000Active-- beds -- baths17,435 sq. ft.
2 Canal Street #3100, New Orleans, LA 70130
MLS# NO2533512Listed by: BRIDGEWATER REALTY ADVISORS, LLC $7,100,000Active-- beds -- baths4,413 sq. ft.
2 Canal Street #3101, New Orleans, LA 70130
MLS# NO2533519Listed by: BRIDGEWATER REALTY ADVISORS, LLC $7,100,000Active-- beds -- baths4,487 sq. ft.
2 Canal Street #3102, New Orleans, LA 70130
MLS# NO2533532Listed by: BRIDGEWATER REALTY ADVISORS, LLC $6,900,000Active-- beds -- baths4,288 sq. ft.
2 Canal Street #3103, New Orleans, LA 70130
MLS# NO2533543Listed by: BRIDGEWATER REALTY ADVISORS, LLC $485,000Active2 beds 1 baths875 sq. ft.
518 Governor Nicholls Street #201, New Orleans, LA 70116
MLS# NO2533762Listed by: MCENERY RESIDENTIAL, LLC $330,000Active2 beds 1 baths627 sq. ft.
940 Orleans Avenue #6, New Orleans, LA 70116
MLS# NO2533836Listed by: SNAP REALTY $349,000Pending2 beds 2 baths1,292 sq. ft.
1201 Canal Street #527, New Orleans, LA 70112
MLS# NO2534491Listed by: FQR REALTORS $199,500Active1 beds 1 baths365 sq. ft.
1204 Chartres Street #5, New Orleans, LA 70116
MLS# NO2534844Listed by: FQR REALTORS $375,000Active1 beds 1 baths620 sq. ft.
933 Chartres Street #17, New Orleans, LA 70116
MLS# NO2535031Listed by: ALC REALTY $215,000Active1 beds 1 baths327 sq. ft.
521 Saint Philip Street #7, New Orleans, LA 70116
MLS# NO2535673Listed by: FRERET REALTY $725,000Active2 beds 2 baths1,483 sq. ft.
829 Ursulines Avenue #7, New Orleans, LA 70116
MLS# NO2535762Listed by: SNAP REALTY $439,000Active1 beds 1 baths1,022 sq. ft.
411 Bienville. Street #401, New Orleans, LA 70130
MLS# NO2535825Listed by: REALTY RESOURCES, INC. $280,000Active2 beds 1 baths1,394 sq. ft.
933 Orleans Street #4, New Orleans, LA 70116
MLS# NO2536308Listed by: COMPASS HISTORIC (LATT09) $499,000Active2 beds 2 baths1,121 sq. ft.
1212 N Rampart Street #400, New Orleans, LA 70116
MLS# NO2536311Listed by: COMPASS UPTOWN-MAPLE ST (LATT28) $349,000Active2 beds 2 baths790 sq. ft.
631 Saint Peter Street #4, New Orleans, LA 70116
MLS# NO2536487Listed by: FQR REALTORS $314,800Active1 beds 2 baths645 sq. ft.
1210 N Rampart Street #1210, New Orleans, LA 70116
MLS# NO2536664Listed by: SHELNUTT REAL ESTATE ENTERPRISES $498,000Active3 beds 2 baths1,342 sq. ft.
1020 Esplanade Avenue #106, New Orleans, LA 70116
MLS# NO2536818Listed by: COMPASS HISTORIC (LATT09) $279,000Active2 beds 1 baths941 sq. ft.
612 N Rampart Street #612, New Orleans, LA 70112
MLS# NO2536823Listed by: COMPASS HISTORIC (LATT09) $389,000Active1 beds 2 baths1,020 sq. ft.
416 Burgundy Street #3, New Orleans, LA 70112
MLS# NO2537129Listed by: EXP REALTY, LLC $700,000Active3 beds 2 baths1,739 sq. ft.
501 Burgundy Street #501, New Orleans, LA 70112
MLS# NO2537146Listed by: MIRAMBELL REALTY $415,000Active1 beds 2 baths898 sq. ft.
911 St Peter Street #4, New Orleans, LA 70116
MLS# NO2537330Listed by: WURTH REAL ESTATE SERVICES $699,000Active2 beds 2 baths1,411 sq. ft.
909 Lafayette Street #10, New Orleans, LA 70113
MLS# NO2537404Listed by: REVE, REALTORS $495,000Active2 beds 2 baths1,196 sq. ft.
220 Decatur Street #405, New Orleans, LA 70130
MLS# NO2537737Listed by: COMPASS GARDEN DISTRICT (LATT18) $349,000Active2 beds 2 baths1,111 sq. ft.
926 Bourbon Street #4, New Orleans, LA 70116
MLS# NO2537826Listed by: FQR REALTORS $179,000Active1 beds 1 baths347 sq. ft.
827 Burgundy Street #D, New Orleans, LA 70116
MLS# NO2538203Listed by: GALIANO REALTY $1,090,000Active3 beds 3 baths3,908 sq. ft.
720 St Louis Street #3 & 4, New Orleans, LA 70130
MLS# NO2538573Listed by: COMPASS HISTORIC (LATT09) $225,000Active1 beds 1 baths365 sq. ft.
1204 Chartres Street #11, New Orleans, LA 70116
MLS# NO2538624Listed by: SHELNUTT REAL ESTATE ENTERPRISES $255,000Active1 beds 1 baths806 sq. ft.
760 Magazine Street #111, New Orleans, LA 70130
MLS# NO2545654Listed by: J. RELF REALTY, INC. $629,000Active4 beds 2 baths1,437 sq. ft.
1111 Tulane Avenue #818, New Orleans, LA 70112
MLS# NO2547140Listed by: REVE, REALTORS- $239,900Active-- beds 1 baths326 sq. ft.
818 Bourbon Street #1B, New Orleans, LA 70116
MLS# RANO2486221Listed by: TALBOT REALTY GROUP  $2,450,000Active2 beds 3 baths1,865 sq. ft.
2 Canal Street #2301, New Orleans, LA 70130
MLS# RANO2487934Listed by: FQR REALTORS $250,000Active1 beds 1 baths982 sq. ft.
1017 Conti Street #2, New Orleans, LA 70112
MLS# RANO2490947Listed by: FQR REALTORS $365,000Active2 beds 2 baths1,014 sq. ft.
1201 Canal Street #511, New Orleans, LA 70112
MLS# RANO2492539Listed by: PINTAT REALTY LLC $329,000Active2 beds 2 baths1,020 sq. ft.
418 Burgundy Street #8, New Orleans, LA 70112
MLS# RANO2492610Listed by: KELLER WILLIAMS REALTY NEW ORLEANS $690,000Active4 beds 2 baths1,586 sq. ft.
1111 Tulane Avenue #523, New Orleans, LA 70112
MLS# RANO2492834Listed by: CRESCENT CITY LIVING, LLC $299,900Active1 beds 1 baths497 sq. ft.
818 Bourbon Street #2D, New Orleans, LA 70116
MLS# RANO2495886Listed by: TALBOT REALTY GROUP $425,000Active1 beds 1 baths564 sq. ft.
415 Burgundy Street #1B, New Orleans, LA 70112
MLS# RANO2499840Listed by: TALBOT HISTORIC PROPERTIES $240,000Active1 beds 1 baths672 sq. ft.
760 Magazine Street #113, New Orleans, LA 70130
MLS# RANO2501245Listed by: REVE, REALTORS $479,000Active3 beds 2 baths1,130 sq. ft.
822 N Rampart Street #302, New Orleans, LA 70116
MLS# RANO2503619Listed by: COOL MURPHY, LLC $330,000Active1 beds 1 baths784 sq. ft.
633 Tchoupitoulas Street #4, New Orleans, LA 70130
MLS# RANO2503715Listed by: MCENERY RESIDENTIAL, LLC $380,000Active2 beds 2 baths935 sq. ft.
820 St Ann Street #A, New Orleans, LA 70116
MLS# RANO2504956Listed by: LATTER & BLUM (LATT09) $585,000Active3 beds 3 baths1,465 sq. ft.
820 Saint Ann Street #B, New Orleans, LA 70116
MLS# RANO2505108Listed by: REVE, REALTORS $425,000Active2 beds 2 baths1,043 sq. ft.
1022 St Peter Street #312, New Orleans, LA 70116
MLS# RANO2507342Listed by: REVE, REALTORS $499,900Active1 beds 1 baths650 sq. ft.
931 Chartres Street #13, New Orleans, LA 70116
MLS# RANO2511803Listed by: WURTH REAL ESTATE SERVICES $425,000Active1 beds 1 baths540 sq. ft.
931 Chartres Street #14, New Orleans, LA 70116
MLS# RANO2511823Listed by: WURTH REAL ESTATE SERVICES $312,000Active1 beds 1 baths510 sq. ft.
433 Burgundy Street #1, New Orleans, LA 70112
MLS# RANO2513229Listed by: FQR REALTORS $429,900Active2 beds 2 baths857 sq. ft.
923 Saint Philip Street #C, New Orleans, LA 70116
MLS# RANO2513429Listed by: 23 REALTY, LLC $475,000Active2 beds 2 baths1,055 sq. ft.
835 St Louis Street #PH I, New Orleans, LA 70112
MLS# RANO2515014Listed by: REVE, REALTORS $689,000Active2 beds 2 baths1,740 sq. ft.
422 Notre Dame Street #1, New Orleans, LA 70130
MLS# RANO2519470Listed by: EXP REALTY, LLC $279,000Active1 beds 2 baths509 sq. ft.
1206 Chartres Street #2, New Orleans, LA 70116
MLS# RANO2520061Listed by: EXP REALTY, LLC $430,000Active2 beds 2 baths1,137 sq. ft.
333 Julia Street #331, New Orleans, LA 70130
MLS# RANO2520406Listed by: RAYMOND REAL ESTATE LLC $345,000Active2 beds 2 baths955 sq. ft.
1201 Canal Street #413, New Orleans, LA 70112
MLS# RANO2520415Listed by: REVE, REALTORS $449,000Active1 beds 1 baths996 sq. ft.
1312 Chartres Street #1312, New Orleans, LA 70116
MLS# RANO2520940Listed by: REVE, REALTORS $265,000Active1 beds 1 baths717 sq. ft.
333 Julia Street #313, New Orleans, LA 70130
MLS# RANO2521340Listed by: CRESCENT CITY LIVING, LLC $789,000Active4 beds 2 baths1,586 sq. ft.
1111 Tulane Avenue #716, New Orleans, LA 70112
MLS# RANO2521466Listed by: MCENERY RESIDENTIAL, LLC $248,000Active1 beds 1 baths467 sq. ft.
812 Esplanade Avenue #6, New Orleans, LA 70116
MLS# RANO2522044Listed by: REVE, REALTORS $424,000Active1 beds 1 baths762 sq. ft.
817 Burgundy Street #B, New Orleans, LA 70116
MLS# RANO2522050Listed by: FQR REALTORS $274,900Active1 beds 1 baths657 sq. ft.
760 Magazine Street #210, New Orleans, LA 70130
MLS# RANO2522082Listed by: TALBOT REALTY GROUP $415,000Active1 beds 2 baths742 sq. ft.
420 Common Street #1A, New Orleans, LA 70130
MLS# RANO2522603Listed by: THE W GROUP REAL ESTATE LLC $829,000Active3 beds 4 baths1,542 sq. ft.
1225 Bourbon Street #G, New Orleans, LA 70116
MLS# RANO2481999Listed by: FQR REALTORS $200,000Active1 beds 1 baths352 sq. ft.
727 Conti Street #B, New Orleans, LA 70130
MLS# NO2537211Listed by: REDFIN CORPORATION $233,000Pending1 beds 1 baths858 sq. ft.
516 Governor Nicholls Street #401, New Orleans, LA 70116
MLS# RANO2493523Listed by: MCENERY RESIDENTIAL, LLC $259,000Active2 beds 1 baths853 sq. ft.
1201 Canal Street #251, New Orleans, LA 70112
MLS# NO2530438Listed by: NEXTHOME PREMIER REALTORS $599,000Active2 beds 2 baths1,059 sq. ft.
614 Baronne Street #102, New Orleans, LA 70113
MLS# NO2538389Listed by: TALBOT REALTY GROUP $279,000Active1 beds 1 baths556 sq. ft.
214 Chartres Street #3, New Orleans, LA 70130
MLS# NO2539494Listed by: LPT REALTY, LLC. $399,000Active2 beds 2 baths856 sq. ft.
425 Burgundy Street #6, New Orleans, LA 70112
MLS# NO2539501Listed by: LPT REALTY, LLC. $470,000Active1 beds 1 baths947 sq. ft.
1001 Julia Street #3G, New Orleans, LA 70113
MLS# 2537407Listed by: REVE, REALTORS $1,189,999Active3 beds 2 baths1,817 sq. ft.
610-616 Baronne Street #PH-2, New Orleans, LA 70113
MLS# 2539164Listed by: TALBOT REALTY GROUP $189,000Active1 beds 1 baths412 sq. ft.
1119 Dauphine Street #10, New Orleans, LA 70116
MLS# 2539416Listed by: FQR REALTORS $2,975,000Pending4 beds 5 baths3,243 sq. ft.
1220 Dauphine Street #B, New Orleans, LA 70116
MLS# 2539228Listed by: EXP REALTY, LLC $420,000Active3 beds 1 baths1,388 sq. ft.
921 Chartres Street #9, New Orleans, LA 70116
MLS# 2539295Listed by: REVE, REALTORS $1,090,000Active3 beds 3 baths3,908 sq. ft.
720 St Louis Street #3 & 4, New Orleans, LA 70130
MLS# 2538573Listed by: COMPASS HISTORIC (LATT09) $225,000Active1 beds 1 baths365 sq. ft.
1204 Chartres Street #11, New Orleans, LA 70116
MLS# 2538624Listed by: SHELNUTT REAL ESTATE ENTERPRISES $498,000Active3 beds 2 baths1,342 sq. ft.
1020 Esplanade Avenue #106, New Orleans, LA 70116
MLS# 2536818Listed by: COMPASS HISTORIC (LATT09) $425,000Active2 beds 2 baths1,125 sq. ft.
423 Gravier Street #3B, New Orleans, LA 70130
MLS# 2538370Listed by: RE/MAX N.O. PROPERTIES $599,000Active2 beds 2 baths1,059 sq. ft.
614 Baronne Street #102, New Orleans, LA 70113
MLS# 2538389Listed by: TALBOT REALTY GROUP
Local realty services provided by:CENTURY 21 Buelow-Miller Realty, CENTURY 21 Lakeshore, CENTURY 21 Action Realty
Popular neighborhoods near French Quarter, New Orleans, LA
Zip codes near French Quarter, New Orleans, LA
- 70001 homes for sale
- 70005 homes for sale
- 70032 homes for sale
- 70053 homes for sale
- 70056 homes for sale
- 70058 homes for sale
- 70112 homes for sale
- 70113 homes for sale
- 70114 homes for sale
- 70115 homes for sale
- 70116 homes for sale
- 70117 homes for sale
- 70118 homes for sale
- 70119 homes for sale
- 70121 homes for sale
- 70122 homes for sale
- 70124 homes for sale
- 70125 homes for sale
- 70126 homes for sale
- 70130 homes for sale
Counties near French Quarter, New Orleans, LA
- Ascension County homes for sale
- Assumption County homes for sale
- East Baton Rouge County homes for sale
- Hancock County homes for sale
- Harrison County homes for sale
- Jefferson County homes for sale
- Lafourche County homes for sale
- Livingston County homes for sale
- Orleans County homes for sale
- Pearl River County homes for sale
- Plaquemines County homes for sale
- St. Bernard County homes for sale
- St. Charles County homes for sale
- St. Helena County homes for sale
- St. James County homes for sale
- St. John the Baptist County homes for sale
- St. Tammany County homes for sale
- Tangipahoa County homes for sale
- Terrebonne County homes for sale
- Washington County homes for sale
Protect your home and budget from life's surprises with an Assurant Home Warranty, backed by a partner that supports you through every step of homeownership. Explore Plans.
©2026 Century 21 Real Estate LLC. All rights reserved. CENTURY 21®, the CENTURY 21 Logo and C21® are service marks owned by Century 21 Real Estate LLC. Century 21 Real Estate LLC fully supports the principles of the Fair Housing Act and the Equal Opportunity Act. Each office is independently owned and operated. Listing information is deemed reliable but not guaranteed accurate.