- Bethany homes for sale
- Bossier City homes for sale
- Coushatta homes for sale
- Doyline homes for sale
- Eastwood homes for sale
- Elm Grove homes for sale
- Frierson homes for sale
- Gloster homes for sale
- Grand Cane homes for sale
- Greenwood homes for sale
- Haughton homes for sale
- Keatchie homes for sale
- Keithville homes for sale
- Lakeview homes for sale
- Logansport homes for sale
- Mansfield homes for sale
- Red Chute homes for sale
- Ringgold homes for sale
- Shreveport homes for sale
- Stonewall homes for sale
71027, LA - homes for sale
20 of 20 results displayed
- New
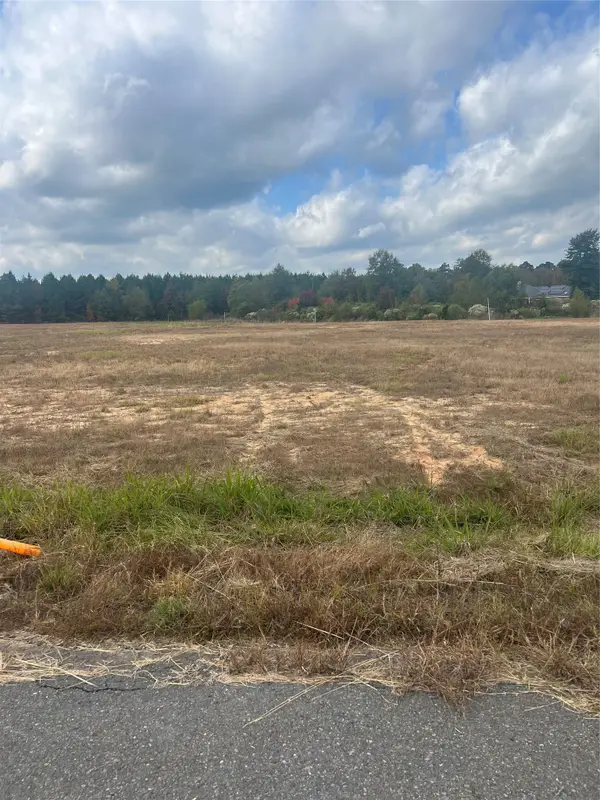
 $95,000Active2 Acres
310 Wallace Lake Road, Frierson, LA 71027
MLS# 21221329Listed by: RE/MAX REAL ESTATE SERVICES - New
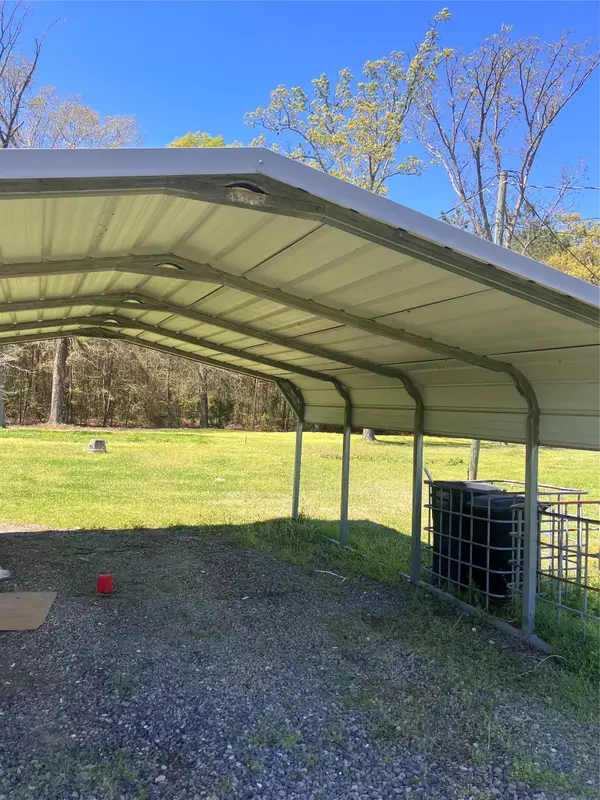
 $89,500Active2.17 Acres
0 Sweetlife Dr., Frierson, LA 71027
MLS# 21218280Listed by: PINNACLE REALTY ADVISORS - New
 $229,900Active4 beds 2 baths2,312 sq. ft.
167 Luther Lane, Frierson, LA 71027
MLS# 21217059Listed by: MARY HUCKABY REAL ESTATE - New
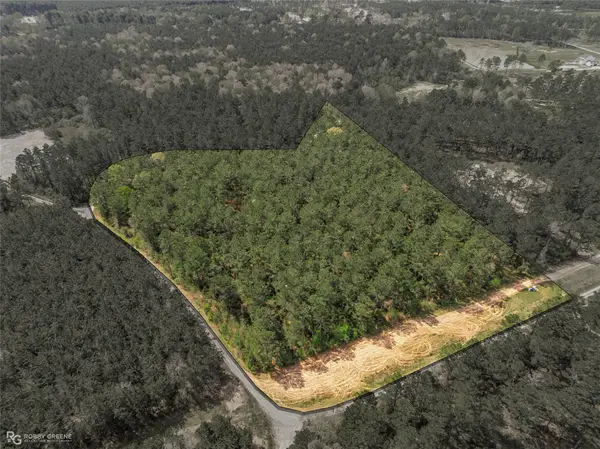 $260,000Active9.24 Acres
0 Providence Private Lane, Frierson, LA 71027
MLS# 21215432Listed by: HOMESMART REALTY SOUTH  $699,900Active5 beds 4 baths2,848 sq. ft.
1827 Gravel Point Road, Frierson, LA 71027
MLS# 21214094Listed by: EAST BANK REAL ESTATE
 $315,000Active3 beds 3 baths1,456 sq. ft.
544 Red Strong Road, Frierson, LA 71027
MLS# 21196521Listed by: CENTURY 21 ELITE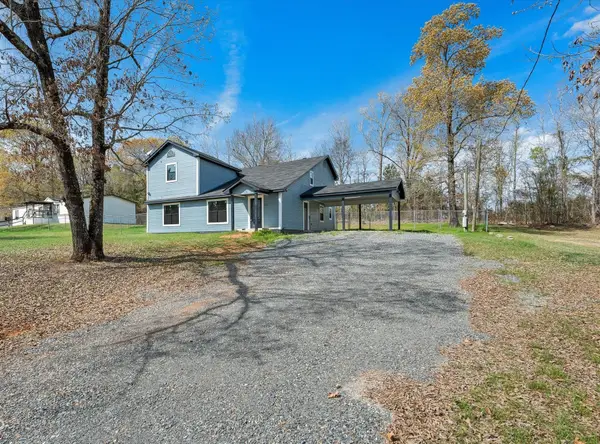 $349,900Active4 beds 3 baths2,802 sq. ft.
227 White Road, Frierson, LA 71027
MLS# 21200626Listed by: SPARTAN REALTY $600,000Active5 beds 3 baths3,858 sq. ft.
111 White Road, Frierson, LA 71027
MLS# 21182469Listed by: BETTER HOMES AND GARDENS RE LINDSEY REALTY $290,000Active35 Acres
0 Stonewall Frierson Road, Frierson, LA 71027
MLS# 21171722Listed by: EAST BANK REAL ESTATE $267,900Pending3 beds 2 baths1,786 sq. ft.
1121 Bayou Bay Court, Frierson, LA 71027
MLS# 21143767Listed by: EAST BANK REAL ESTATE $599,900Pending5 beds 3 baths2,621 sq. ft.
363 Bella Court Pvt Drive, Frierson, LA 71027
MLS# 21113789Listed by: CENTURY 21 ELITE $85,000Active4.1 Acres
0 Cottonwood, Frierson, LA 71027
MLS# 21070097Listed by: COLDWELL BANKER APEX, REALTORS $74,900Active2.02 Acres
0 Bradleigh Boulevard, Frierson, LA 71027
MLS# 21063380Listed by: KELLER WILLIAMS NORTHWEST $465,000Active3 beds 2 baths2,062 sq. ft.
5905 Highway 175, Frierson, LA 71027
MLS# 21194890Listed by: CENTURY 21 ELITE $64,000Active3 beds 2 baths1,376 sq. ft.
214 Springs Road, Frierson, LA 71027
MLS# 21029590Listed by: COLDWELL BANKER APEX, REALTORS $353,800Pending61 Acres
0 Bethel Road, Frierson, LA 71027
MLS# 20927829Listed by: EAST BANK REAL ESTATE $478,000Pending78.36 Acres
000 Bethel Road, Frierson, LA 71027
MLS# 20927888Listed by: EAST BANK REAL ESTATE $259,450Pending3 beds 2 baths1,751 sq. ft.
1221 Bayou Bay Court, Frierson, LA 71027
MLS# 21061803Listed by: COLDWELL BANKER APEX, REALTORS $259,950Pending3 beds 2 baths1,751 sq. ft.
1210 Bayou Bay Court, Frierson, LA 71027
MLS# 21028097Listed by: COLDWELL BANKER APEX, REALTORS $140,000Active8.67 Acres
0 Friendship, Frierson, LA 71027
MLS# 21146794Listed by: PELICAN REALTY ADVISORS
Local realty services provided by:CENTURY 21 Mike Bowman, Inc.
Information provided, in part, by North Texas Real Estate Information Systems, Inc. Last Updated March 31, 2026 Listings with the NTREIS logo are listed by brokerages other than CENTURY 21 Mike Bowman, Inc..
Popular searches near 71027
Popular neighborhoods near 71027
- Boggy Bayou, Keithville homes for sale
- Brookwood, Shreveport homes for sale
- Cargill Park, Shreveport homes for sale
- Cedar Grove, Shreveport homes for sale
- East Ridge, Shreveport homes for sale
- Huckleberry Ridge, Shreveport homes for sale
- Hyde Park, Shreveport homes for sale
- Keith Road, Keithville homes for sale
- Pierremont, Shreveport homes for sale
- Pinecroft, Shreveport homes for sale
- Robson Plantation, Shreveport homes for sale
- South Broadmoor, Shreveport homes for sale
- Southern Hills, Shreveport homes for sale
- Spring Lake, Shreveport homes for sale
- Suburban Acres, Shreveport homes for sale
- Summer Grove, Shreveport homes for sale
- Town South, Shreveport homes for sale
- Wallace Lake, Shreveport homes for sale
- Wallace Lake Heights, Shreveport homes for sale
- West Cedar Grove, Shreveport homes for sale
Counties near Frierson, 71027
- Bienville County homes for sale
- Bossier County homes for sale
- Caddo County homes for sale
- Claiborne County homes for sale
- De Soto County homes for sale
- Harrison County homes for sale
- Jackson County homes for sale
- Lafayette County homes for sale
- Lincoln County homes for sale
- Marion County homes for sale
- Natchitoches County homes for sale
- Panola County homes for sale
- Red River County homes for sale
- Rusk County homes for sale
- Sabine County homes for sale
- Sabine County homes for sale
- San Augustine County homes for sale
- Shelby County homes for sale
- Webster County homes for sale
- Winn County homes for sale
Protect your home and budget from life's surprises with an Assurant Home Warranty, backed by a partner that supports you through every step of homeownership. Explore Plans.
©2026 Century 21 Real Estate LLC. All rights reserved. CENTURY 21®, the CENTURY 21 Logo and C21® are service marks owned by Century 21 Real Estate LLC. Century 21 Real Estate LLC fully supports the principles of the Fair Housing Act and the Equal Opportunity Act. Each office is independently owned and operated. Listing information is deemed reliable but not guaranteed accurate.