- Cobb Hill, Frisco homes for sale
- Cypress Lake At Stonebriar, Frisco homes for sale
- Estates On Legacy Drive, Frisco homes for sale
- Griffin Parc, Frisco homes for sale
- Heather Ridge Estates, Frisco homes for sale
- Historic Downtown Frisco, Frisco homes for sale
- Newman Village, Frisco homes for sale
- Park Place, Frisco homes for sale
- Pearson Farms, Frisco homes for sale
- Preston Highlands North, Frisco homes for sale
- Preston Lakes, Frisco homes for sale
- Preston Manor, Frisco homes for sale
- Preston Vineyards, Frisco homes for sale
- Ranch Estates, Frisco homes for sale
- Shaddock Creek, Frisco homes for sale
- Starwood, Frisco homes for sale
- Tuscany, Frisco homes for sale
- Village Lakes, Frisco homes for sale
- Willow Pond, Frisco homes for sale
- Woodstream, Frisco homes for sale
Frisco, TX - homes for rent
3 of 3 results displayed
 $2,900 per monthActive3 beds 4 baths1,939 sq. ft.
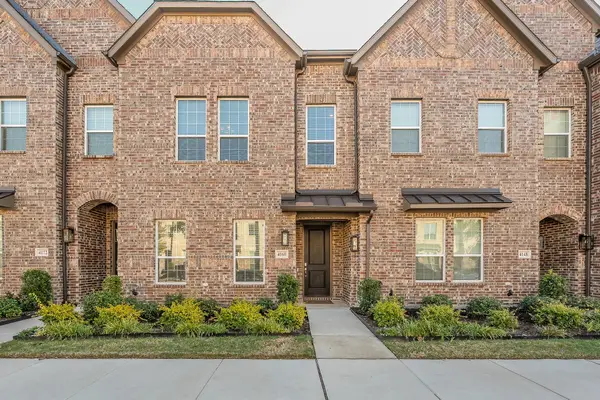
4160 Wetstone Lane, Frisco, TX 75034
MLS# 21126744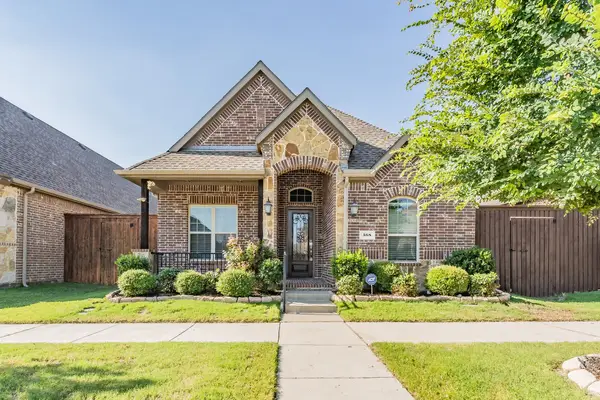 $2,700 per monthActive3 beds 3 baths1,944 sq. ft.
568 Enfield Drive, Frisco, TX 75036
MLS# 21118953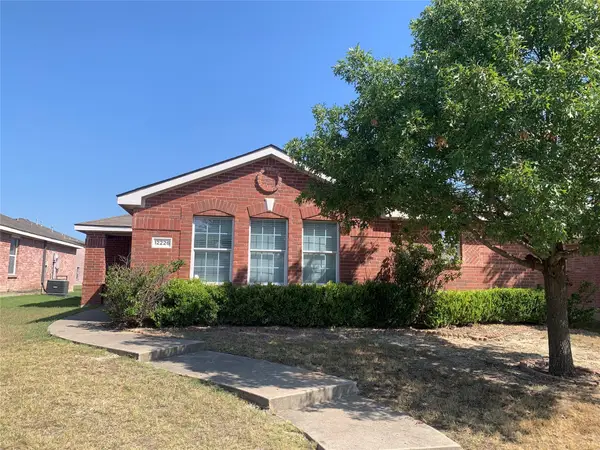 $2,225 per monthActive3 beds 2 baths1,881 sq. ft.
12226 Peak Circle, Frisco, TX 75035
MLS# 21037227
Neighborhoods near Frisco, TX
Zip codes near Frisco, TX
- 75010 homes for sale
- 75013 homes for sale
- 75023 homes for sale
- 75024 homes for sale
- 75025 homes for sale
- 75033 homes for sale
- 75034 homes for sale
- 75035 homes for sale
- 75036 homes for sale
- 75056 homes for sale
- 75068 homes for sale
- 75070 homes for sale
- 75071 homes for sale
- 75072 homes for sale
- 75075 homes for sale
- 75078 homes for sale
- 75093 homes for sale
- 75252 homes for sale
- 75287 homes for sale
- 76227 homes for sale
Popular searches near Frisco, TX
- Allen homes for sale
- Aubrey homes for sale
- Carrollton homes for sale
- Cross Roads homes for sale
- Hackberry homes for sale
- Hebron homes for sale
- Lakewood Village homes for sale
- Lewisville homes for sale
- Little Elm homes for sale
- McKinney homes for sale
- Oak Point homes for sale
- Paloma Creek homes for sale
- Paloma Creek South homes for sale
- Pilot Point homes for sale
- Pilot Point-Aubrey homes for sale
- Plano homes for sale
- Prosper homes for sale
- Providence Village homes for sale
- Savannah homes for sale
- The Colony homes for sale
Protect your home and budget from life's surprises with an Assurant Home Warranty, backed by a partner that supports you through every step of homeownership. Explore Plans.
©2026 Century 21 Real Estate LLC. All rights reserved. CENTURY 21®, the CENTURY 21 Logo and C21® are service marks owned by Century 21 Real Estate LLC. Century 21 Real Estate LLC fully supports the principles of the Fair Housing Act and the Equal Opportunity Act. Each office is independently owned and operated. Listing information is deemed reliable but not guaranteed accurate.