- Avondale, Sacramento homes for sale
- Center Crossroads Neighborhood Association, Sacramento homes for sale
- College/Glen, Sacramento homes for sale
- Colonial Heights, Sacramento homes for sale
- Colonial Manor, Sacramento homes for sale
- Colonial Village, Sacramento homes for sale
- Fruitridge Manor, Sacramento homes for sale
- Fruitridge Oaks, Sacramento homes for sale
- Fruitridge Vista, Sacramento homes for sale
- Lawrence Park, Sacramento homes for sale
- Parkway, Sacramento homes for sale
- Pollack Ranch Neighborhood Association, Sacramento homes for sale
- South Area, Sacramento homes for sale
- South Oak Park, Sacramento homes for sale
- Southeast Village, Sacramento homes for sale
- Southgate Meadows Neighborhood Association, Sacramento homes for sale
- Tahoe Park, Sacramento homes for sale
- Tahoe Park South, Sacramento homes for sale
- Tallac Village, Sacramento homes for sale
- Woodbine, Sacramento homes for sale
Fruitridge, Sacramento, CA - homes for sale
18 of 18 results displayed
- Open Sat, 12 to 2pmNew
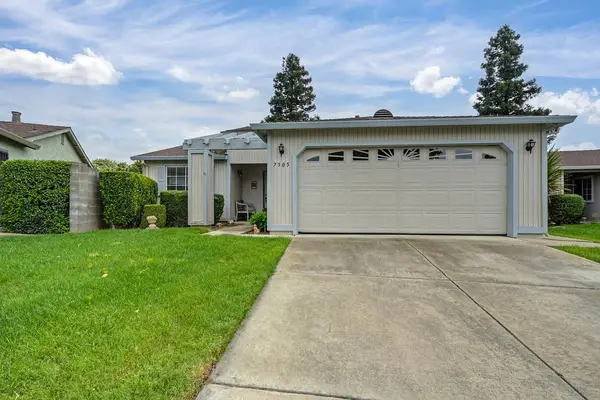 $310,000Active2 beds 2 baths1,282 sq. ft.
7505 Sunwest Lane, Sacramento, CA 95828
MLS# 226038835Listed by: COMPASS - Open Sat, 1 to 3pmNew
 $775,000Active4 beds 3 baths2,287 sq. ft.
2124 Gerber Avenue, Sacramento, CA 95817
MLS# 226038691Listed by: COLDWELL BANKER REALTY - Open Sat, 1 to 3pmNew
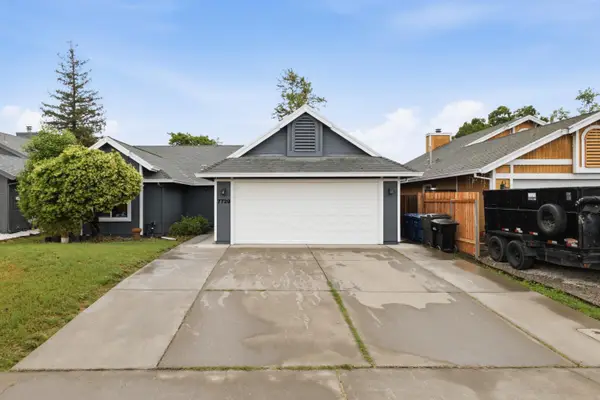
 $499,000Active4 beds 2 baths1,819 sq. ft.
7729 Gyan Way, Sacramento, CA 95828
MLS# 226038474Listed by: CENTURY 21 SELECT REAL ESTATE - Open Sat, 11am to 2pmNew
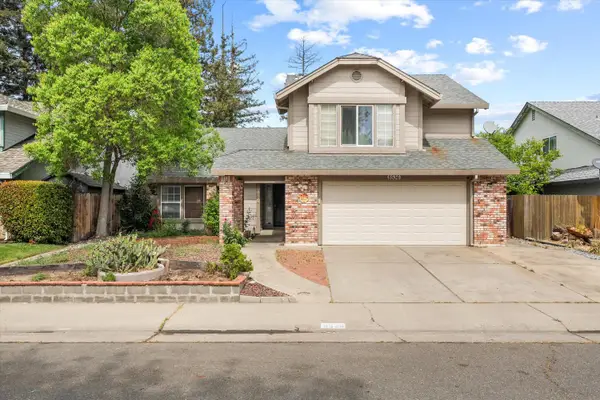 $450,000Active4 beds 3 baths2,060 sq. ft.
8536 Cord Way, Sacramento, CA 95828
MLS# 226038269Listed by: REALTY ONE GROUP COMPLETE - Open Sat, 11am to 3pmNew
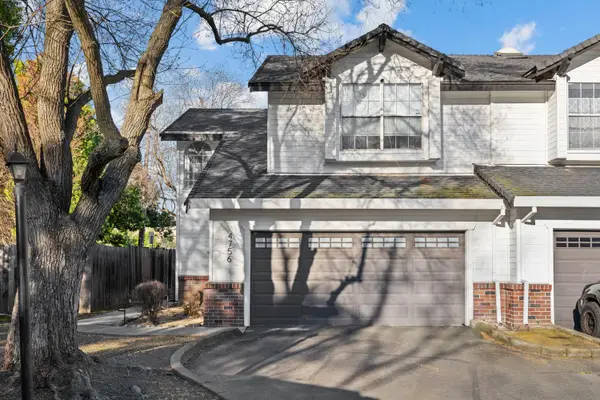 $435,000Active3 beds 3 baths1,247 sq. ft.
4756 67th Street, Sacramento, CA 95820
MLS# 226028296Listed by: KW SAC METRO - Open Fri, 12 to 2pmNew
 $419,999Active2 beds 1 baths1,036 sq. ft.
3541 38th Street, Sacramento, CA 95817
MLS# 226028946Listed by: NICK SADEK SOTHEBY'S INTERNATIONAL REALTY - Open Sat, 12 to 3pmNew
 $498,000Active4 beds 3 baths1,719 sq. ft.
6975 Casa Del Este Way, Sacramento, CA 95828
MLS# 226038627Listed by: GRAND REALTY GROUP - Open Sat, 12 to 3pmNew
 $389,000Active3 beds 1 baths1,259 sq. ft.
6039 34th Avenue, Sacramento, CA 95824
MLS# 226038346Listed by: KEES HOMES - Open Sat, 1 to 3pmNew
 $450,000Active3 beds 2 baths1,482 sq. ft.
8009 Parkgate Way, Sacramento, CA 95828
MLS# 226038175Listed by: GRAND REALTY GROUP - Open Sat, 2 to 4pmNew
 $950,000Active3 beds 2 baths1,414 sq. ft.
3332 Truckee Way, Sacramento, CA 95817
MLS# 226034826Listed by: HENRY UNG INC - Open Sat, 11am to 3pm
 $305,000Active2 beds 2 baths1,282 sq. ft.
7419 Sunborough Lane, Sacramento, CA 95828
MLS# 226033723Listed by: EXP REALTY OF NORTHERN CALIFORNIA, INC. - Open Sat, 1 to 4pm
 $439,888Active3 beds 2 baths1,226 sq. ft.
7304 Fletcher Farm Drive, Sacramento, CA 95828
MLS# 226033524Listed by: LPT REALTY, INC - Open Fri, 4 to 6pm
 $656,000Active3 beds 2 baths1,124 sq. ft.
4201 56th Street, Sacramento, CA 95820
MLS# 226027451Listed by: PORTFOLIO REAL ESTATE - Open Sat, 2 to 4pm
 $450,000Active4 beds 3 baths1,714 sq. ft.
7765 Twain Court, Sacramento, CA 95828
MLS# 226013849Listed by: HOMESMART ICARE REALTY  $439,000Active2 beds 1 baths1,000 sq. ft.
3435 Trio Lane, Sacramento, CA 95817
MLS# 226023553Listed by: REALTY ONE GROUP ZOOM- Open Sat, 11am to 4pm
 $494,990Active3 beds -- baths1,925 sq. ft.
8069 Cottonwood Drive, Friant, CA 93626
MLS# 644303Listed by: K. HOVNANIAN CALIFORNIA OPERATIONS, INC - Open Sat, 12 to 2pm
 $340,000Active2 beds 1 baths885 sq. ft.
4551 Orinda Way, Sacramento, CA 95820
MLS# 226016023Listed by: BEAR FLAG REALTY - Open Sat, 11am to 2pm
 $569,900Active3 beds 2 baths1,552 sq. ft.
6920 Maita Circle, Sacramento, CA 95820
MLS# 226014652Listed by: LPT REALTY, INC
Local realty services provided by:CENTURY 21 Sierra Properties, CENTURY 21 Select Real Estate, Inc.
MetroList MLS 2026. This information is being provided by MetroList MLS. All measurements and calculations of area are approximate. Information provided by Seller/Other sources, not verified by Broker. All interested persons should independently verify accuracy of information. Provided properties may or may not be listed by the office/agent presenting the information. Data Updated: March 28, 2026. Information being provided is for consumers' personal, non-commercial use and may not be used for any purpose other than to identify prospective properties consumers may be interested in purchasing. Information deemed reliable but not guaranteed. Any offer of compensation is made only to Participants of MLS where the subject listing is filed and in accordance with such MLS's regulations or rules.
Popular neighborhoods near Fruitridge, Sacramento, CA
Zip codes near Fruitridge, Sacramento, CA
- 95624 homes for sale
- 95758 homes for sale
- 95811 homes for sale
- 95814 homes for sale
- 95815 homes for sale
- 95816 homes for sale
- 95817 homes for sale
- 95818 homes for sale
- 95819 homes for sale
- 95820 homes for sale
- 95822 homes for sale
- 95823 homes for sale
- 95824 homes for sale
- 95825 homes for sale
- 95826 homes for sale
- 95827 homes for sale
- 95828 homes for sale
- 95829 homes for sale
- 95831 homes for sale
- 95864 homes for sale
Counties near Fruitridge, Sacramento, CA
- Alameda County homes for sale
- Alpine County homes for sale
- Amador County homes for sale
- Butte County homes for sale
- Calaveras County homes for sale
- Colusa County homes for sale
- Contra Costa County homes for sale
- El Dorado County homes for sale
- Marin County homes for sale
- Napa County homes for sale
- Nevada County homes for sale
- Placer County homes for sale
- Sacramento County homes for sale
- San Joaquin County homes for sale
- Solano County homes for sale
- Sonoma County homes for sale
- Stanislaus County homes for sale
- Sutter County homes for sale
- Yolo County homes for sale
- Yuba County homes for sale
Protect your home and budget from life's surprises with an Assurant Home Warranty, backed by a partner that supports you through every step of homeownership. Explore Plans.
©2026 Century 21 Real Estate LLC. All rights reserved. CENTURY 21®, the CENTURY 21 Logo and C21® are service marks owned by Century 21 Real Estate LLC. Century 21 Real Estate LLC fully supports the principles of the Fair Housing Act and the Equal Opportunity Act. Each office is independently owned and operated. Listing information is deemed reliable but not guaranteed accurate.