- Boulevard, Cleveland homes for sale
- Broadway - Slavic Village, Cleveland homes for sale
- Brooklyn Center, Cleveland homes for sale
- Buckeye - Shaker, Cleveland homes for sale
- Woodland Hills, Cleveland homes for sale
- Eaton Estate, Northfield homes for sale
- Fairfax, Cleveland homes for sale
- Fernway, Beachwood homes for sale
- Kinsman, Cleveland homes for sale
- Lee - Harvard, Cleveland homes for sale
- Lee - Seville, Cleveland homes for sale
- Lomond, Beachwood homes for sale
- Mercer, Beachwood homes for sale
- Moreland, Cleveland homes for sale
- Mt Pleasant, Cleveland homes for sale
- Old Brooklyn, Cleveland homes for sale
- Onaway, Cleveland homes for sale
- Sussex, Beachwood homes for sale
- Tremont, Cleveland homes for sale
- Union - Miles Park, Cleveland homes for sale
Garfield Heights, OH - homes for sale
99 of 99 results displayed
- New
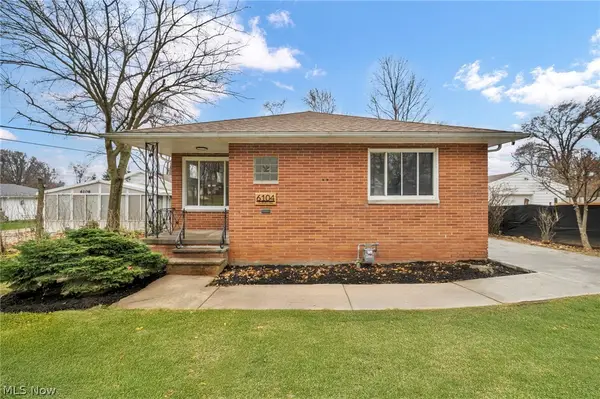
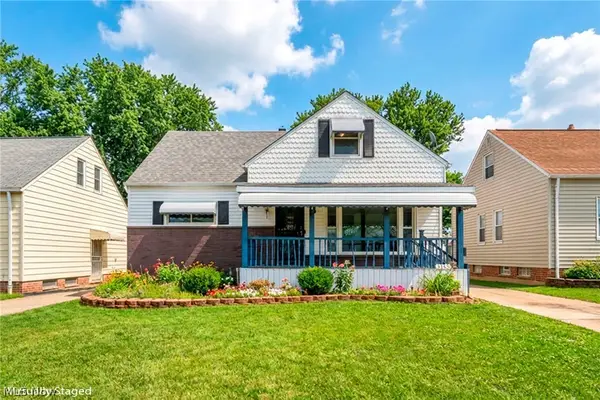
 $175,000Active4 beds 2 baths1,370 sq. ft.
5212 E 105 Street, Garfield Heights, OH 44125
MLS# 5197733Listed by: CENTURY 21 ASA COX HOMES - New
 $139,900Active3 beds 2 baths1,588 sq. ft.
5287 E 117th Street, Garfield Heights, OH 44125
MLS# 5197230Listed by: KELLER WILLIAMS CHERVENIC RLTY - New
 $149,900Active3 beds 2 baths2,052 sq. ft.
10506 Park Heights Avenue, Garfield Heights, OH 44125
MLS# 5178719Listed by: RE/MAX REVEALTY - New
 $185,000Active3 beds 1 baths2,594 sq. ft.
13300 Carpenter Road, Garfield Heights, OH 44125
MLS# 5197042Listed by: RE/MAX MARKET SOLUTIONS - New
 $198,995Active3 beds 1 baths2,338 sq. ft.
6104 Turney Road, Garfield Heights, OH 44125
MLS# 5196599Listed by: KELLER WILLIAMS LIVING - New
 $159,900Active3 beds 1 baths1,882 sq. ft.
13620 S Parkway Drive, Garfield Heights, OH 44105
MLS# 5196725Listed by: COLDWELL BANKER SCHMIDT REALTY  $90,000Pending3 beds 2 baths1,540 sq. ft.
4868 E 88th Street, Garfield Heights, OH 44125
MLS# 5196788Listed by: KELLER WILLIAMS GREATER METROPOLITAN- New
 $89,900Active3 beds 1 baths1,125 sq. ft.
13815 Cranwood Park Boulevard, Garfield Heights, OH 44125
MLS# 5196581Listed by: T. LEWIS REALTY, LLC - New
 $134,900Active3 beds 1 baths1,376 sq. ft.
5365 E 131st Street, Garfield Heights, OH 44125
MLS# 5195960Listed by: KELLER WILLIAMS CITYWIDE - New
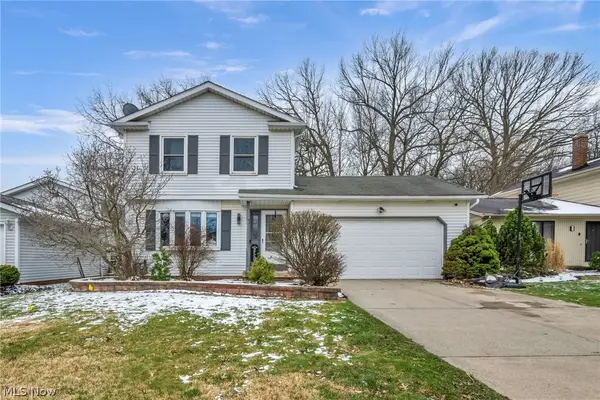
 $189,900Active3 beds 2 baths1,950 sq. ft.
13513 York Boulevard, Garfield Heights, OH 44125
MLS# 5196129Listed by: RE/MAX ABOVE & BEYOND - New
 $175,000Active4 beds 1 baths
10606 Langton Avenue, Garfield Heights, OH 44125
MLS# 5196047Listed by: CENTURY 21 HOMESTAR  $120,000Pending3 beds 1 baths1,675 sq. ft.
9722 Robinson Avenue, Garfield Heights, OH 44125
MLS# 5196010Listed by: EXP REALTY, LLC.- New
 $239,900Active3 beds 3 baths
13800 Milo Road, Garfield Heights, OH 44125
MLS# 5193338Listed by: RICHFIELD REALTY GROUP LLC 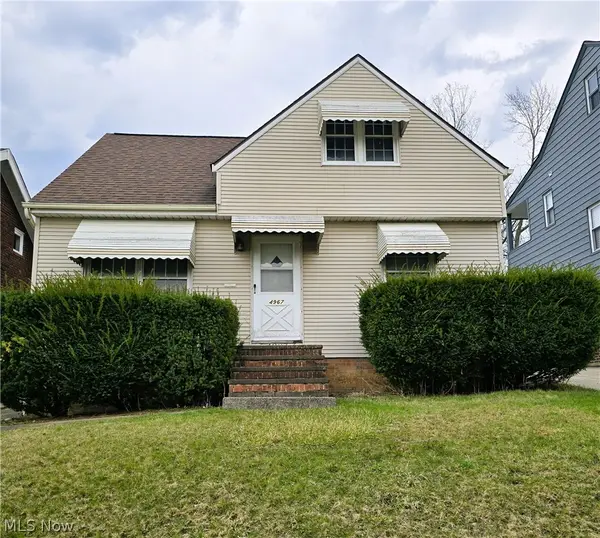 $59,900Pending3 beds 1 baths1,131 sq. ft.
4967 E 88th Street, Garfield Heights, OH 44125
MLS# 5194991Listed by: JMG OHIO- New
 $102,500Active3 beds 1 baths
12612 Christine Avenue, Garfield Heights, OH 44105
MLS# 5194462Listed by: BHR & ASSOCIATES  $89,900Active3 beds 1 baths2,070 sq. ft.
12704 Christine Avenue, Garfield Heights, OH 44105
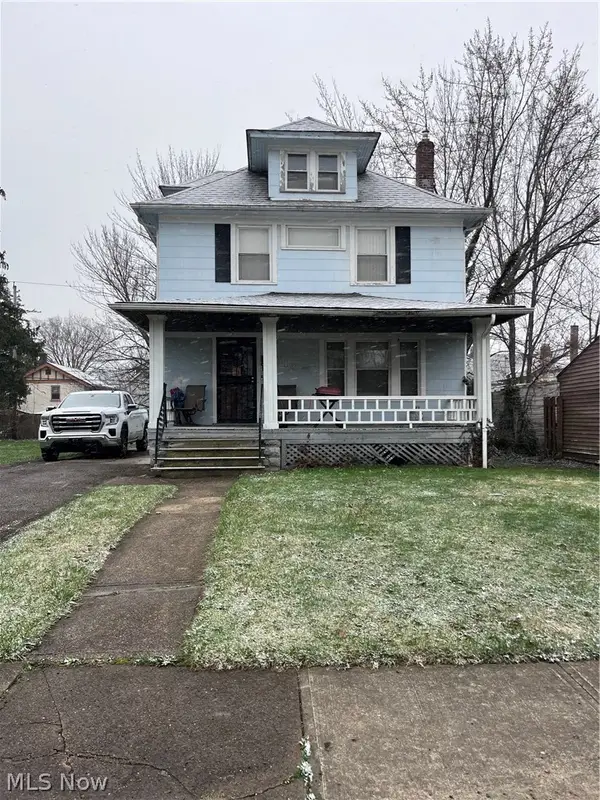
MLS# 5194988Listed by: KEY REALTY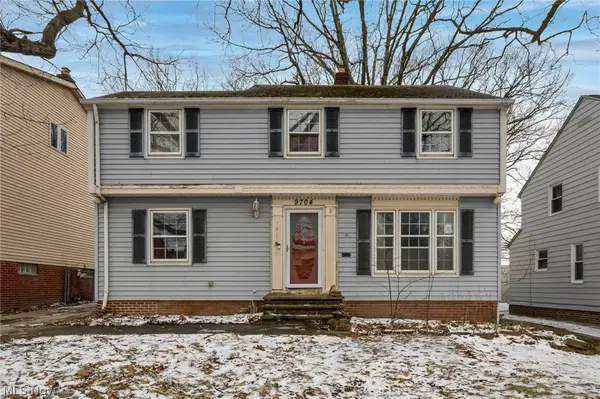 $124,900Active3 beds 1 baths
9704 S Highland Avenue, Garfield Heights, OH 44125
MLS# 5193347Listed by: RICHFIELD REALTY GROUP LLC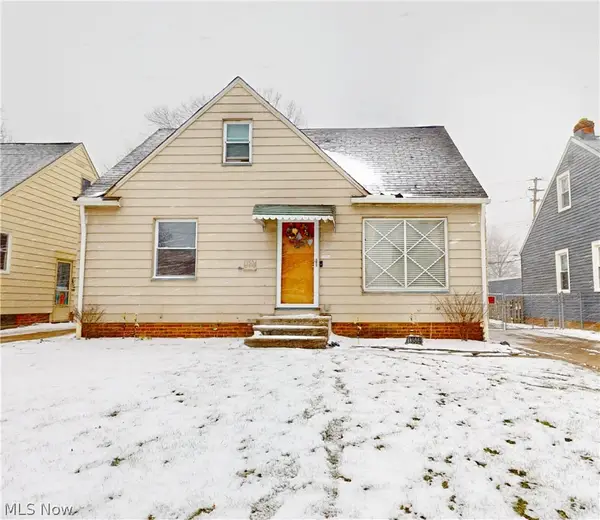 $155,000Pending3 beds 2 baths1,950 sq. ft.
13504 Maple Leaf Drive, Garfield Heights, OH 44125
MLS# 5192991Listed by: MCDOWELL HOMES REAL ESTATE SERVICES $129,900Pending3 beds 1 baths1,404 sq. ft.
4955 E 141st Street, Garfield Heights, OH 44125
MLS# 5167121Listed by: CENTURY 21 CAROLYN RILEY RL. EST. SRVCS, INC.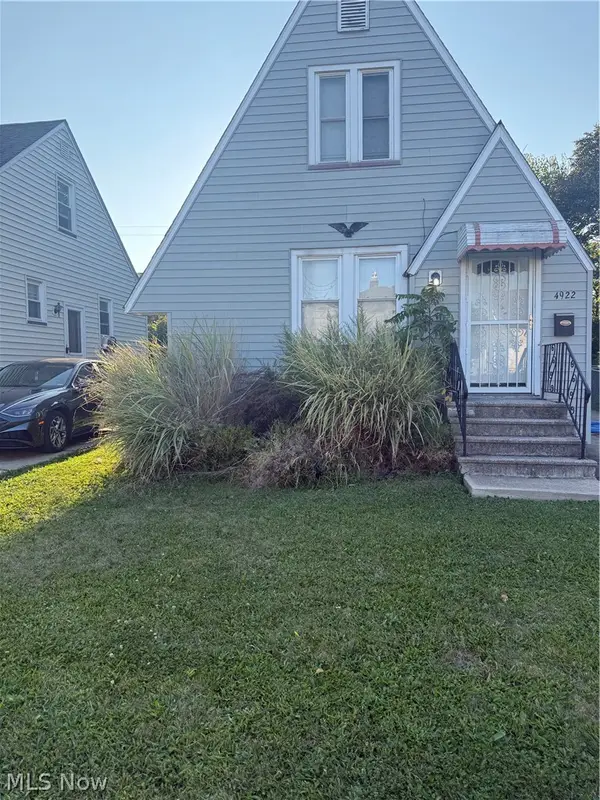 $120,000Active2 beds 1 baths1,377 sq. ft.
4922 E 109th Street, Garfield Heights, OH 44125
MLS# 5194468Listed by: PLUM TREE REALTY, LLC $169,900Active3 beds 2 baths2,165 sq. ft.
5853 Monica Lane, Garfield Heights, OH 44125
MLS# 5178648Listed by: REGAL REALTY, INC. $194,900Pending3 beds 2 baths1,772 sq. ft.
13600 Royal Boulevard, Garfield Heights, OH 44125
MLS# 5192246Listed by: EXP REALTY, LLC. $139,900Pending3 beds 1 baths
4691 Burleigh Road, Garfield Heights, OH 44125
MLS# 5192868Listed by: REALUXE OHIO $169,900Pending3 beds 2 baths1,773 sq. ft.
4847 E 94th Street, Garfield Heights, OH 44125
MLS# 5193756Listed by: KELLER WILLIAMS CHERVENIC RLTY $154,999Pending3 beds 2 baths
13019 Darlington Avenue, Garfield Heights, OH 44125
MLS# 5193633Listed by: CENTURY 21 HOMESTAR $169,000Active3 beds 2 baths
9602 Plymouth Avenue, Garfield Heights, OH 44125
MLS# 5193448Listed by: RUSSELL REAL ESTATE SERVICES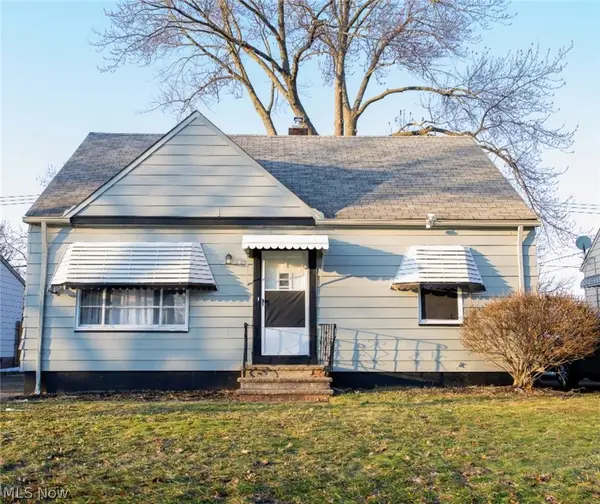 $174,900Active3 beds 1 baths1,602 sq. ft.
12307 Shady Oak Boulevard, Garfield Heights, OH 44125
MLS# 5187525Listed by: KEY REALTY $199,900Active3 beds 2 baths1,564 sq. ft.
11412 Hempstead Road, Cleveland, OH 44125
MLS# 5187041Listed by: REAL ESTATE QUEST, INC. $265,000Active3 beds 2 baths1,881 sq. ft.
5087 E 86th Street, Garfield Heights, OH 44125
MLS# 5193179Listed by: KELLER WILLIAMS GREATER METROPOLITAN $158,000Pending3 beds 2 baths1,212 sq. ft.
4863 E 93rd Street, Garfield Heights, OH 44125
MLS# 5193014Listed by: MCDOWELL HOMES REAL ESTATE SERVICES $169,900Pending3 beds 2 baths2,378 sq. ft.
5504 Carol Jean Boulevard, Garfield Heights, OH 44125
MLS# 5191921Listed by: KELLER WILLIAMS CHERVENIC RLTY $149,900Pending3 beds 1 baths1,448 sq. ft.
11604 Bradwell Road, Garfield Heights, OH 44125
MLS# 5192705Listed by: ASPIRE COMMUNITY REALTY, LLC $129,900Active2 beds 2 baths800 sq. ft.
4816 E 135th Street, Garfield Heights, OH 44125
MLS# 5192489Listed by: KELLER WILLIAMS LIVING $119,000Pending2 beds 2 baths1,976 sq. ft.
9717 David Road, Garfield Heights, OH 44125
MLS# 5182842Listed by: RE/MAX REAL ESTATE GROUP $149,900Pending3 beds 2 baths2,052 sq. ft.
5731 Andover Boulevard, Garfield Heights, OH 44125
MLS# 5191414Listed by: KELLER WILLIAMS GREATER METROPOLITAN $168,000Active3 beds 2 baths1,872 sq. ft.
4754 Lawrence Avenue, Garfield Heights, OH 44125
MLS# 5177912Listed by: EXP REALTY, LLC. $194,900Pending3 beds 2 baths1,765 sq. ft.
12416 Eastwood Boulevard, Garfield Heights, OH 44125
MLS# 5192095Listed by: SOLID GOLD PROPERTIES $135,000Pending3 beds 1 baths1,080 sq. ft.
13206 Shady Oak Boulevard, Garfield Heights, OH 44125
MLS# 5176295Listed by: MIA BROWN REALTY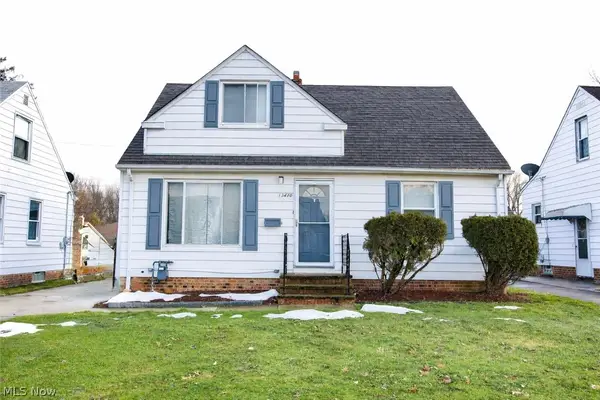 $178,000Active3 beds 2 baths2,015 sq. ft.
13410 Hathaway Road, Garfield Heights, OH 44125
MLS# 5188709Listed by: KELLER WILLIAMS CITYWIDE $170,000Active3 beds 2 baths2,229 sq. ft.
13616 Oakview Boulevard, Garfield Heights, OH 44125
MLS# 5168094Listed by: COLDWELL BANKER SCHMIDT REALTY $140,000Active3 beds 1 baths1,740 sq. ft.
12908 York Boulevard, Garfield Heights, OH 44125
MLS# 5185757Listed by: MCDOWELL HOMES REAL ESTATE SERVICES $120,000Pending3 beds 1 baths
9518 Plymouth Avenue, Garfield Heights, OH 44125
MLS# 5189219Listed by: EXP REALTY, LLC. $159,900Pending3 beds 1 baths1,564 sq. ft.
13801 Bangor Avenue, Garfield Heights, OH 44125
MLS# 5190051Listed by: KELLER WILLIAMS CHERVENIC RLTY $119,900Pending4 beds 2 baths1,730 sq. ft.
12512 York Boulevard, Garfield Heights, OH 44125
MLS# 5189932Listed by: RUSSELL REAL ESTATE SERVICES $149,900Pending3 beds 1 baths1,518 sq. ft.
4915 E 111th Street, Garfield Heights, OH 44125
MLS# 5189409Listed by: REALUXE OHIO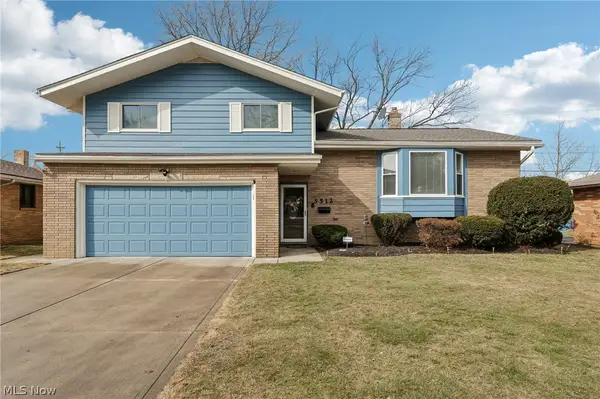 $200,000Pending3 beds 2 baths1,589 sq. ft.
5512 Carol Jean Boulevard, Garfield Heights, OH 44125
MLS# 5188284Listed by: PREMIER AGENT NETWORK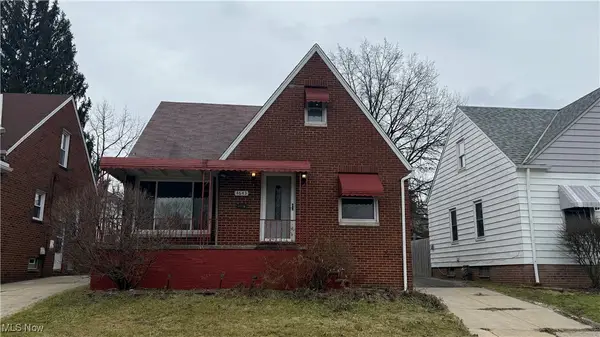 $149,500Active3 beds 1 baths1,616 sq. ft.
4643 E 90th Street, Garfield Heights, OH 44125
MLS# 5181391Listed by: RE/MAX ABOVE & BEYOND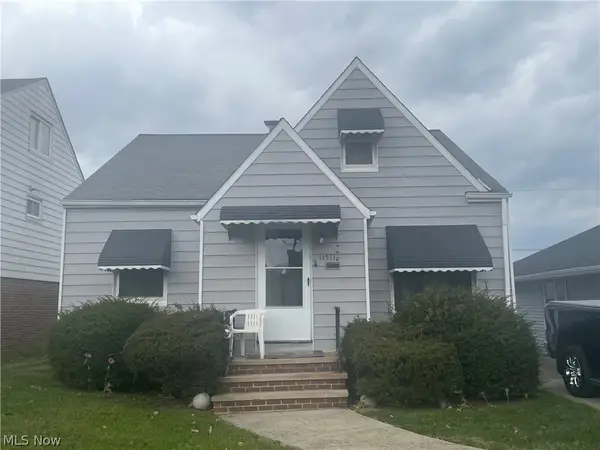 $129,000Pending3 beds 2 baths
11511 Bradwell Road, Garfield Heights, OH 44125
MLS# 5188864Listed by: CENTURY 21 HOMESTAR $229,900Pending3 beds 3 baths1,728 sq. ft.
12955 Milo Road, Cleveland, OH 44125
MLS# 5162504Listed by: KELLER WILLIAMS CHERVENIC RLTY $145,000Pending3 beds 1 baths
9516 Alexander Road, Garfield Heights, OH 44125
MLS# 5188331Listed by: COLDWELL BANKER SCHMIDT REALTY $219,000Pending3 beds 2 baths
13810 Martin Drive, Cleveland, OH 44125
MLS# 5186467Listed by: KELLER WILLIAMS ELEVATE $155,000Pending3 beds 2 baths1,554 sq. ft.
13009 Willard Avenue, Cleveland, OH 44125
MLS# 5186970Listed by: PLUM TREE REALTY, LLC $135,000Pending3 beds 1 baths1,152 sq. ft.
5213 E 119th Street, Cleveland, OH 44125
MLS# 5183041Listed by: RE/MAX HAVEN REALTY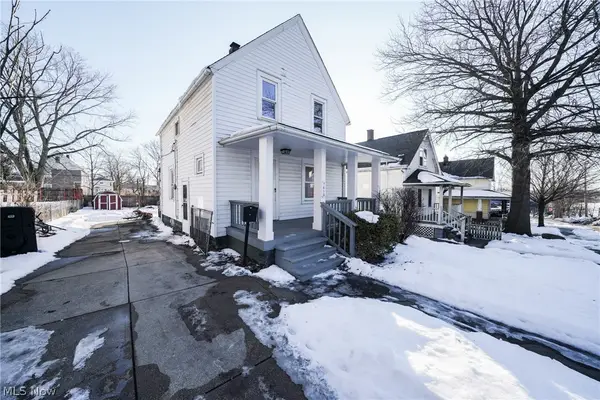 $110,000Pending3 beds 2 baths
7610 Rosewood Avenue, Garfield Heights, OH 44105
MLS# 5186977Listed by: ELITE SOTHEBY'S INTERNATIONAL REALTY $116,500Active3 beds 1 baths
4680 Beechgrove Avenue, Cleveland, OH 44125
MLS# 5187680Listed by: KELLER WILLIAMS CITYWIDE $149,000Pending5 beds 2 baths1,776 sq. ft.
10201 Robinson Avenue, Garfield Heights, OH 44125
MLS# 5186262Listed by: C&D REALTY, LLP $155,000Pending2 beds 1 baths1,632 sq. ft.
5380 E 131st Street, Cleveland, OH 44125
MLS# 5186351Listed by: KELLER WILLIAMS GREATER METROPOLITAN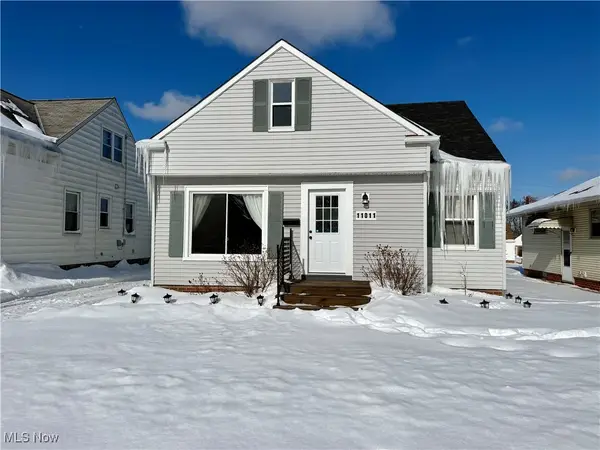 $159,900Active3 beds 1 baths1,308 sq. ft.
11011 Wallingford Avenue, Garfield Heights, OH 44125
MLS# 5185094Listed by: KELLER WILLIAMS CHERVENIC RLTY $204,900Pending3 beds 2 baths1,896 sq. ft.
6425 Farmington Drive, Garfield Heights, OH 44125
MLS# 5184875Listed by: E & D REALTY & INVESTMENT CO. $115,000Pending3 beds 1 baths
13305 Rockside Road, Garfield Heights, OH 44125
MLS# 5184631Listed by: KELLER WILLIAMS GREATER METROPOLITAN $150,000Pending3 beds 2 baths1,728 sq. ft.
13905 Thraves Avenue, Garfield Heights, OH 44125
MLS# 5184361Listed by: RE/MAX CROSSROADS PROPERTIES $115,000Active3 beds 2 baths1,160 sq. ft.
13809 Christine Avenue, Garfield Heights, OH 44105
MLS# 5184451Listed by: NEIGHBORHOOD PARTNERS, LLC. $99,900Active3 beds 1 baths1,926 sq. ft.
13710 Thornhurst Avenue, Garfield Heights, OH 44105
MLS# 5184363Listed by: CENTURY 21 HOMESTAR $125,000Pending3 beds 2 baths1,288 sq. ft.
9717 Alexander Road, Garfield Heights, OH 44125
MLS# 5183616Listed by: LPT REALTY $95,000Pending2 beds 1 baths
11017 Vernon Avenue, Garfield Heights, OH 44125
MLS# 5183630Listed by: PLATINUM REAL ESTATE $154,900Active2 beds 2 baths1,170 sq. ft.
12328 Granger Road, Cleveland, OH 44125
MLS# 5182644Listed by: RE/MAX ABOVE & BEYOND $162,500Active3 beds 1 baths1,152 sq. ft.
12908 Shadyway Road, Garfield Heights, OH 44125
MLS# 5181662Listed by: RE/MAX CROSSROADS PROPERTIES $99,900Active3 beds 1 baths1,357 sq. ft.
13203 Alvin Avenue, Garfield Heights, OH 44105
MLS# 5179690Listed by: METRO SPACE REALTY $144,500Pending3 beds 1 baths1,160 sq. ft.
5408 Roland Drive, Garfield Heights, OH 44125
MLS# 5180730Listed by: KELLER WILLIAMS CHERVENIC RLTY $80,000Active2 beds 1 baths824 sq. ft.
4723 E 94th Street, Garfield Heights, OH 44125
MLS# 5177720Listed by: RE/MAX HAVEN REALTY $159,900Active4 beds 2 baths
8220 Garfield Boulevard, Garfield Heights, OH 44125
MLS# 5177704Listed by: PLUM TREE REALTY, LLC $138,000Active3 beds 1 baths1,650 sq. ft.
11412 Granger Road, Garfield Heights, OH 44125
MLS# 5171358Listed by: RE/MAX HAVEN REALTY $176,000Active3 beds 1 baths1,064 sq. ft.
5270 E 135th Street, Garfield Heights, OH 44125
MLS# 5170409Listed by: RE/MAX HAVEN REALTY $138,000Active3 beds 1 baths1,584 sq. ft.
12817 Thraves Avenue, Garfield Heights, OH 44125
MLS# 5170431Listed by: RE/MAX HAVEN REALTY $168,000Active3 beds 1 baths2,192 sq. ft.
10713 Mountview Avenue, Garfield Heights, OH 44125
MLS# 5171081Listed by: RE/MAX HAVEN REALTY $185,000Active4 beds 2 baths2,504 sq. ft.
9809 Sladden Avenue, Garfield Heights, OH 44125
MLS# 5171087Listed by: RE/MAX HAVEN REALTY $168,000Active4 beds 2 baths1,411 sq. ft.
6039 E 135th Street, Garfield Heights, OH 44125
MLS# 5171110Listed by: RE/MAX HAVEN REALTY- Open Sat, 12 to 1:30pm
 $158,000Active3 beds 2 baths1,218 sq. ft.
4864 E 94th Street, Garfield Heights, OH 44125
MLS# 5171509Listed by: KELLER WILLIAMS CHERVENIC RLTY  $149,900Pending3 beds 2 baths
13116 Oak Park Boulevard, Garfield Heights, OH 44125
MLS# 5171046Listed by: NEW ERA REAL ESTATE GROUP, INC. $124,000Pending2 beds 1 baths1,040 sq. ft.
9435 Dorothy Avenue, Garfield Heights, OH 44125
MLS# 5170418Listed by: RE/MAX HAVEN REALTY $164,900Active3 beds 1 baths1,885 sq. ft.
4839 E 94th Street, Garfield Heights, OH 44125
MLS# 5170287Listed by: MCDOWELL HOMES REAL ESTATE SERVICES $199,900Pending3 beds 3 baths
4885 E 107th Street, Garfield Heights, OH 44125
MLS# 5167399Listed by: RUFFIN REAL ESTATE CO. $164,500Pending3 beds 1 baths1,473 sq. ft.
13804 Rockside Road, Garfield Heights, OH 44125
MLS# 5167165Listed by: EXP REALTY, LLC. $159,900Active4 beds 2 baths1,350 sq. ft.
11813 Willard Avenue, Garfield Heights, OH 44125
MLS# 5166518Listed by: REAL ESTATE QUEST, INC. $120,000Pending3 beds 1 baths1,675 sq. ft.
9722 Robinson Avenue, Garfield Heights, OH 44125
MLS# 5165430Listed by: EXP REALTY, LLC. $139,900Pending3 beds 2 baths1,575 sq. ft.
5069 Henry Street, Garfield Heights, OH 44125
MLS# 5165321Listed by: REALTY NOW, INC.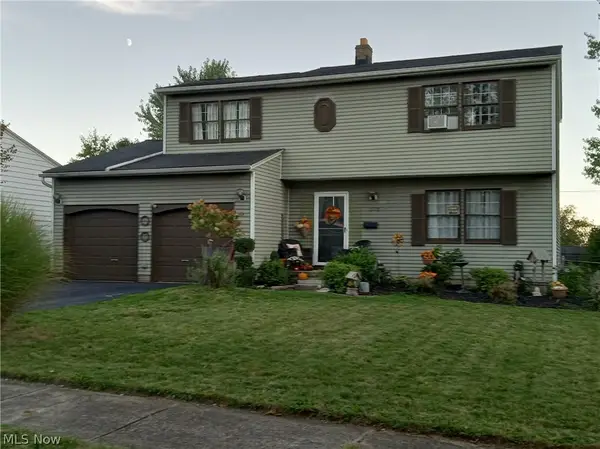 $219,900Pending4 beds 2 baths1,560 sq. ft.
13578 Foxcroft Drive, Garfield Heights, OH 44125
MLS# 5193474Listed by: WILKES REALTY, LLC.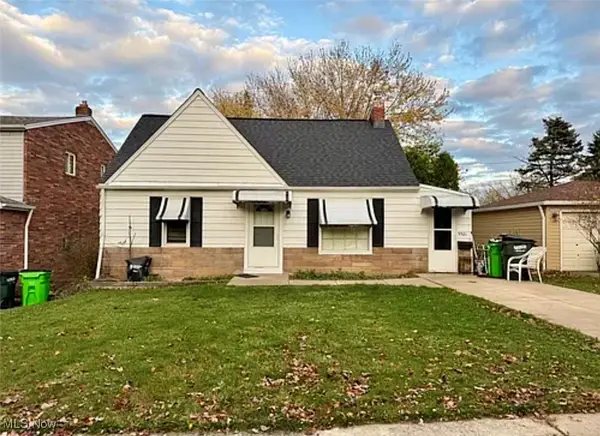 $145,000Pending3 beds 2 baths1,800 sq. ft.
5581 Saxon Drive, Garfield Heights, OH 44125
MLS# 5185383Listed by: RE/MAX MARKET SOLUTIONS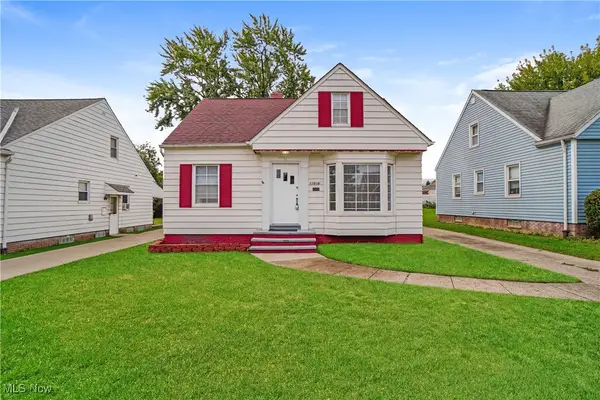 $145,000Pending3 beds 2 baths
11016 Mccracken Road, Garfield Heights, OH 44125
MLS# 5160159Listed by: PLUM TREE REALTY, LLC- New
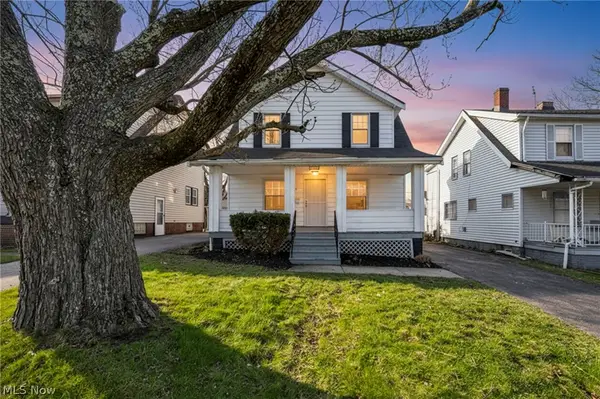
 $150,000Active4 beds 2 baths
13315 Thornhurst Avenue, Garfield Heights, OH 44105
MLS# 5195275Listed by: BHR & ASSOCIATES  $130,000Active4 beds 1 baths
5139 E 114th Street, Garfield Heights, OH 44125
MLS# 5156645Listed by: BHR & ASSOCIATES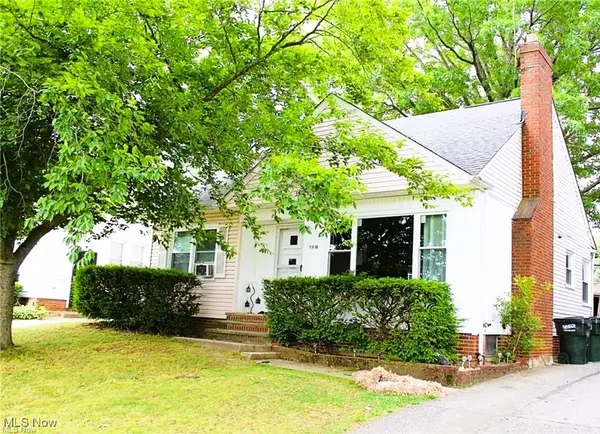 $155,000Active4 beds 2 baths2,525 sq. ft.
11100 Wallingford Avenue, Garfield Heights, OH 44125
MLS# 5144146Listed by: KELLER WILLIAMS GREATER METROPOLITAN $72,000Active3 beds 1 baths
13208 Maplerow Avenue, Cleveland, OH 44105
MLS# 5144253Listed by: KELLER WILLIAMS CITYWIDE $122,500Pending5 beds 4 baths
4846 Edgepark Drive, Garfield Heights, OH 44125
MLS# 5143291Listed by: HOMESMART REAL ESTATE MOMENTUM LLC $170,000Active3 beds 2 baths1,155 sq. ft.
9611 Mccracken Road, Garfield Heights, OH 44125
MLS# 225019282Listed by: BUCKEYE ROOTS REALTY, LLC $335,000Active3 beds 2 baths1,367 sq. ft.
12940 Fruitside Road, Garfield Heights, OH 44125
MLS# 5111953Listed by: EXP REALTY, LLC. $335,000Active3 beds 2 baths1,367 sq. ft.
TBD Meadowbrook Road, Garfield Heights, OH 44125
MLS# 5112062Listed by: EXP REALTY, LLC. $85,000Pending3 beds 1 baths
10916 Mccracken Road, Garfield Heights, OH 44125
MLS# 5107921Listed by: RUSSELL REAL ESTATE SERVICES $110,000Pending3 beds 2 baths2,378 sq. ft.
11206 Park Heights Avenue, Garfield Heights, OH 44125
MLS# 5090861Listed by: REAL OF OHIO
Local realty services provided by:CENTURY 21 Lakeside Realty, CENTURY 21 DeAnna Realty
All information deemed reliable but not guaranteed and should be independently verified. All properties are subject to prior sale, change or withdrawal. Neither listing broker(s) nor CENTURY 21 DeAnna Realty shall be responsible for any typographical errors, misinformation, misprints and shall be held totally harmless.
Neighborhoods near Garfield Heights, OH
Zip codes near Garfield Heights, OH
- 44067 homes for sale
- 44103 homes for sale
- 44104 homes for sale
- 44105 homes for sale
- 44106 homes for sale
- 44109 homes for sale
- 44113 homes for sale
- 44115 homes for sale
- 44118 homes for sale
- 44120 homes for sale
- 44122 homes for sale
- 44125 homes for sale
- 44127 homes for sale
- 44128 homes for sale
- 44129 homes for sale
- 44131 homes for sale
- 44134 homes for sale
- 44137 homes for sale
- 44144 homes for sale
- 44146 homes for sale
Popular searches near Garfield Heights, OH
- Beachwood homes for sale
- Bedford homes for sale
- Bedford Heights homes for sale
- Brecksville homes for sale
- Brooklyn Heights homes for sale
- Cleveland homes for sale
- Independence homes for sale
- Maple Heights homes for sale
- Newburgh Heights homes for sale
- Northfield homes for sale
- Oakwood homes for sale
- Orange homes for sale
- Parma homes for sale
- Seven Hills homes for sale
- Shaker Heights homes for sale
- University Heights homes for sale
- Valley View homes for sale
- Walton Hills homes for sale
- Warrensville Heights homes for sale
- Woodmere homes for sale
Protect your home and budget from life's surprises with an Assurant Home Warranty, backed by a partner that supports you through every step of homeownership. Explore Plans.
©2026 Century 21 Real Estate LLC. All rights reserved. CENTURY 21®, the CENTURY 21 Logo and C21® are service marks owned by Century 21 Real Estate LLC. Century 21 Real Estate LLC fully supports the principles of the Fair Housing Act and the Equal Opportunity Act. Each office is independently owned and operated. Listing information is deemed reliable but not guaranteed accurate.