- Baden, Saint Louis homes for sale
- Behlmann Farms, Florissant homes for sale
- Bellefontaine Neighbors, Saint Louis homes for sale
- Berkeley, Saint Louis homes for sale
- Black Jack, Florissant homes for sale
- Calverton Park, Saint Louis homes for sale
- Castle Point, Saint Louis homes for sale
- Cool Valley, Saint Louis homes for sale
- Dellwood, Saint Louis homes for sale
- Ferguson, Saint Louis homes for sale
- Florissant, Florissant homes for sale
- Glasgow Village, Saint Louis homes for sale
- Hazelwood, Hazelwood homes for sale
- Jennings, Saint Louis homes for sale
- Moline Acres, Saint Louis homes for sale
- North County, Saint Louis homes for sale
- North Point, Saint Louis homes for sale
- Old Jamestown, Florissant homes for sale
- Spanish Lake, Saint Louis homes for sale
- The Villages at Barrington Downs, Florissant homes for sale
Godfrey, IL - homes for sale
75 of 75 results displayed
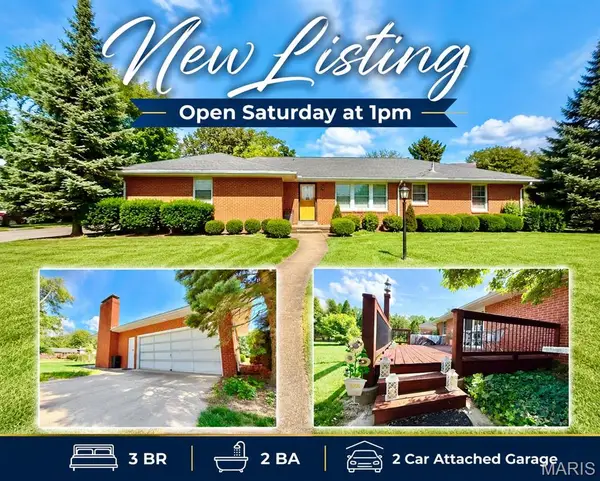
- New
 $185,900Active3 beds 2 baths1,348 sq. ft.
4809 Dadrian Drive, Godfrey, IL 62035
MLS# 26032695Listed by: RE/MAX RIVER BEND - New
 $850,000Active4 beds 5 baths3,086 sq. ft.
52 Fairmount Drive, Alton, IL 62002
MLS# 26033349Listed by: RE/MAX ALLIANCE - New
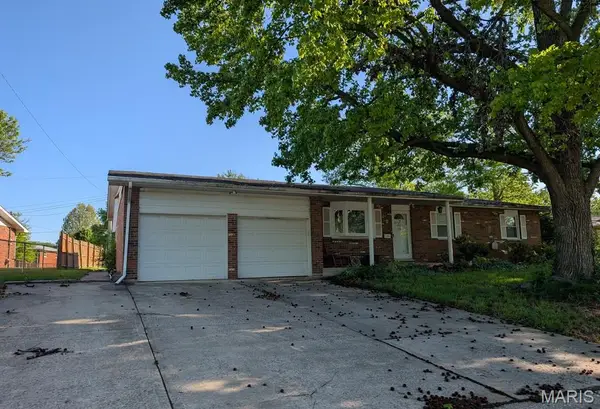
 $125,000Active2 beds 1 baths840 sq. ft.
1113 Mcpherson Avenue, Alton, IL 62002
MLS# 26032541Listed by: RE/MAX ALLIANCE - New
 $210,000Active4 beds 3 baths2,068 sq. ft.
5204 Pin Oak Drive, Alton, IL 62002
MLS# 26033446Listed by: TARRANT AND HARMAN REAL ESTATE AND AUCTION CO - New
 $250,000Active3 beds 2 baths1,925 sq. ft.
3215 Morkel Drive, Godfrey, IL 62035
MLS# 26033366Listed by: RE/MAX ALLIANCE - New
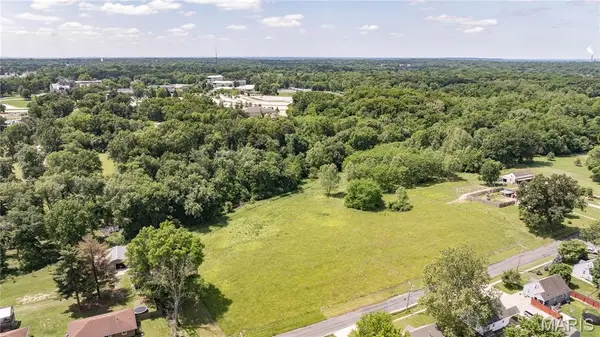 $310,000Active25 Acres
0 Winter Lane, Godfrey, IL 62035
MLS# 26031879Listed by: TARRANT AND HARMAN REAL ESTATE AND AUCTION CO - New
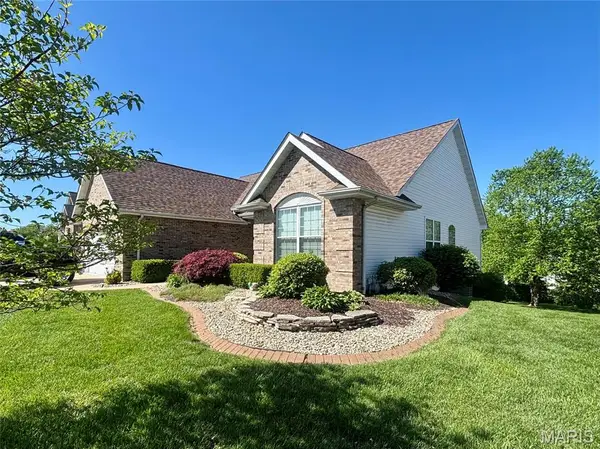
 $450,000Active4 beds 3 baths2,665 sq. ft.
1221 Bridge Park Drive, Alton, IL 62002
MLS# 26030613Listed by: RE/MAX ALLIANCE  $269,900Active3 beds 4 baths1,500 sq. ft.
4723 Brecht Lane, Godfrey, IL 62035
MLS# 26031717Listed by: KELLER WILLIAMS MARQUEE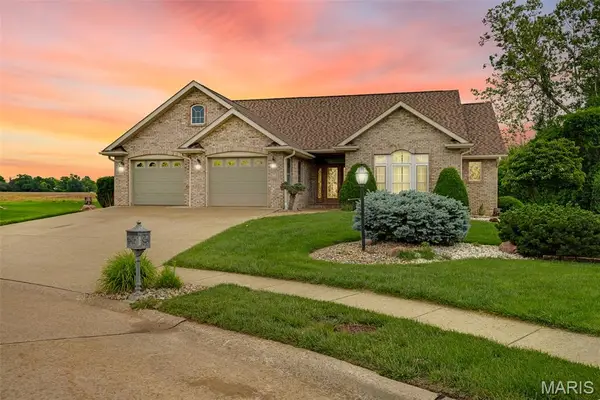 $300,000Pending2 beds 2 baths1,924 sq. ft.
5301 Deer Creek Court, Godfrey, IL 62035
MLS# 26031603Listed by: KELLER WILLIAMS MARQUEE- Coming Soon
 $369,900Coming Soon3 beds 3 baths
4632 Magnolia Place, Alton, IL 62002
MLS# 26031196Listed by: KELLER WILLIAMS MARQUEE 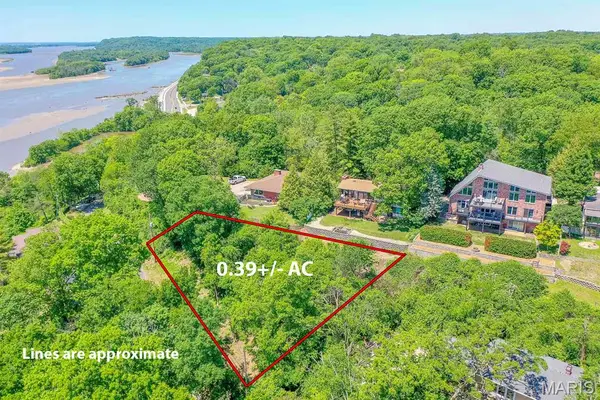 $10,000Active0.39 Acres
3100 Illini Trail, Godfrey, IL 62035
MLS# 26030890Listed by: ADAMS AUCTION & REAL ESTATE SERVICES INC. $185,000Active3 beds 2 baths985 sq. ft.
5105 Staten Drive, Godfrey, IL 62035
MLS# 26030952Listed by: KELLER WILLIAMS MARQUEE $279,000Pending3 beds 2 baths2,124 sq. ft.
5013 Crystal Lake Dr. Drive, Godfrey, IL 62035
MLS# 26030055Listed by: RE/MAX ALLIANCE $200,000Active3 beds 2 baths3,004 sq. ft.
333 Straube Lane, Godfrey, IL 62035
MLS# 26030653Listed by: KELLER WILLIAMS MARQUEE $399,000Pending3 beds 2 baths1,833 sq. ft.
403 Northfork Drive, Brighton, IL 62012
MLS# 26030300Listed by: MARKET PRO REALTY, INC- Coming Soon
 $150,000Coming Soon3 beds 3 baths
4904 Paris Drive, Godfrey, IL 62035
MLS# 26030239Listed by: LANDMARK REALTY 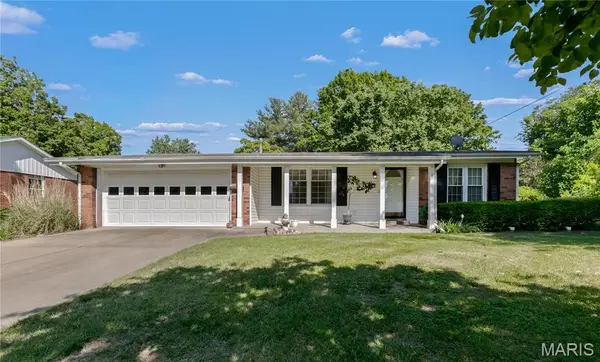 $195,000Pending3 beds 2 baths1,343 sq. ft.
5013 Staten Drive, Godfrey, IL 62035
MLS# 26029302Listed by: RE/MAX ALLIANCE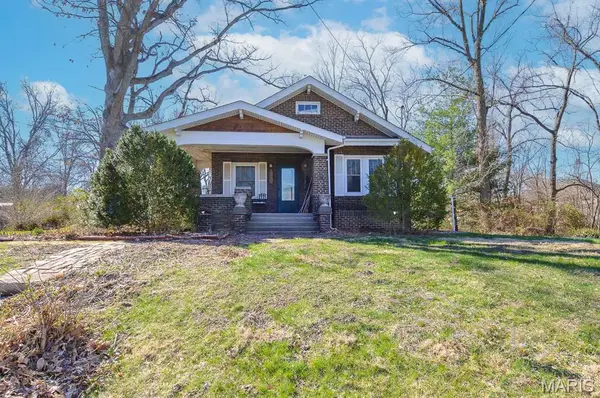 $40,000Active3 beds 2 baths1,344 sq. ft.
717 Crestwood Drive, Godfrey, IL 62035
MLS# 26030151Listed by: ADAMS AUCTION & REAL ESTATE SERVICES INC.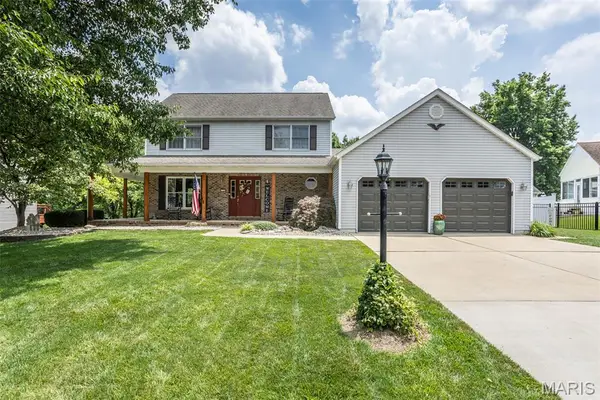 $395,000Pending3 beds 4 baths2,784 sq. ft.
1729 Seminole Lane, Godfrey, IL 62035
MLS# 26029387Listed by: COLDWELL BANKER BROWN REALTORS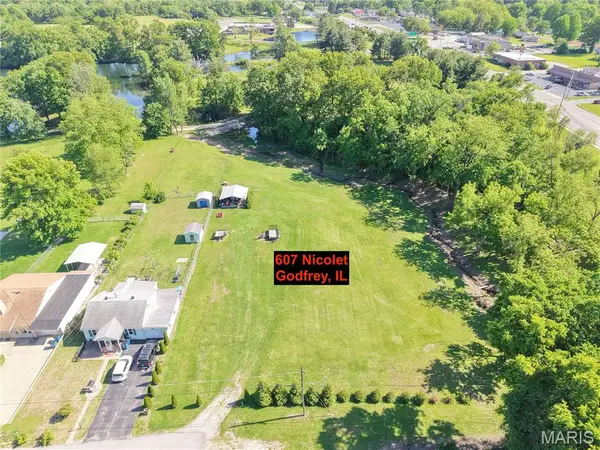 $55,000Active3 Acres
607 Nicolet Drive, Godfrey, IL 62035
MLS# 26029705Listed by: DREAM HOME REALTY CENTRE, WR $335,000Active3 beds 4 baths2,962 sq. ft.
4432 Thatcher Road, Alton, IL 62002
MLS# 26029602Listed by: TARRANT AND HARMAN REAL ESTATE AND AUCTION CO $198,500Pending3 beds 2 baths1,300 sq. ft.
4441 Chantel Drive, Alton, IL 62002
MLS# 26029434Listed by: RE/MAX RIVER BEND $174,900Pending2 beds 1 baths882 sq. ft.
806 Taylor Avenue, Godfrey, IL 62035
MLS# 26029533Listed by: MARKET PRO REALTY, INC $285,000Pending4 beds 2 baths2,014 sq. ft.
5419 Wenzel Road, Alton, IL 62002
MLS# 26026035Listed by: COLDWELL BANKER BROWN REALTORS $169,000Active3 beds 2 baths1,312 sq. ft.
5014 Alicia Drive, Alton, IL 62002
MLS# 26029427Listed by: TARRANT AND HARMAN REAL ESTATE AND AUCTION CO $228,500Pending3 beds 2 baths1,923 sq. ft.
907 Taylor Avenue, Godfrey, IL 62035
MLS# 26029035Listed by: LANDMARK REALTY $130,000Active1 beds 1 baths714 sq. ft.
509 Pearl Street, Godfrey, IL 62035
MLS# 26028173Listed by: TARRANT AND HARMAN REAL ESTATE AND AUCTION CO $130,000Pending1 beds 1 baths884 sq. ft.
300 Nelder Drive, Godfrey, IL 62035
MLS# 26028355Listed by: LANDMARK REALTY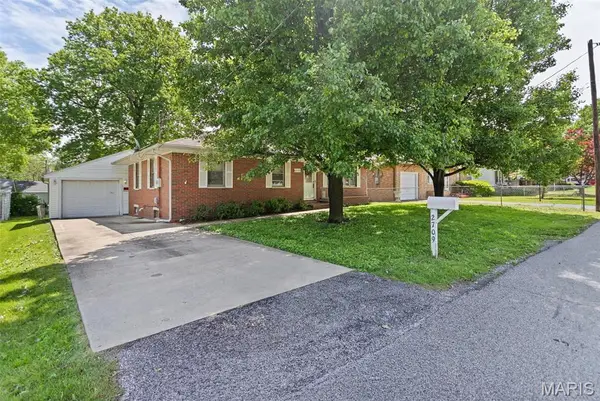 $160,000Pending3 beds 2 baths1,325 sq. ft.
2709 Greenwood Lane, Godfrey, IL 62035
MLS# 26027768Listed by: LANDMARK REALTY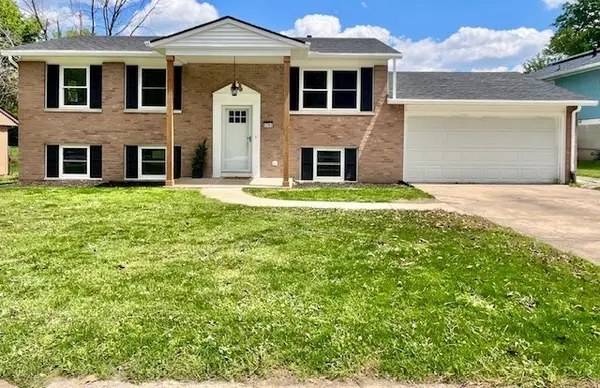 $225,000Active4 beds 2 baths1,998 sq. ft.
5703 Sir Gawain Drive, Godfrey, IL 62035
MLS# 12640824Listed by: CIRCLE ONE REALTY
 $209,000Active3 beds 2 baths1,680 sq. ft.
328 Venus Drive, Godfrey, IL 62035
MLS# 26027358Listed by: KELLER WILLIAMS MARQUEE $172,000Pending4 beds 2 baths1,910 sq. ft.
4900 Hill Drive, Godfrey, IL 62035
MLS# 12635921Listed by: BAIRD & WARNER FOX VALLEY - GENEVA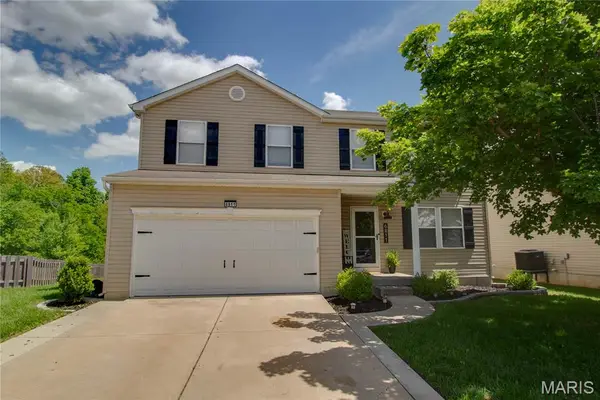 $345,000Active5 beds 3 baths2,760 sq. ft.
6811 Beall Court, Godfrey, IL 62035
MLS# 26026091Listed by: TARRANT AND HARMAN REAL ESTATE AND AUCTION CO $390,000Pending3 beds 3 baths2,630 sq. ft.
1010 Robert Drive, Godfrey, IL 62035
MLS# 26025158Listed by: BERKSHIRE HATHAWAY HOMESERVICES SELECT PROPERTIES $29,000Active0.32 Acres
1826 Sycamore Hill Drive, Godfrey, IL 62035
MLS# 26019124Listed by: TARRANT AND HARMAN REAL ESTATE AND AUCTION CO $54,900Active0.3 Acres
0 Sycamore Hills Drive, Godfrey, IL 62035
MLS# 26019126Listed by: TARRANT AND HARMAN REAL ESTATE AND AUCTION CO $188,000Active4 beds 2 baths1,655 sq. ft.
5803 Piasa Trail, Godfrey, IL 62035
MLS# 26023847Listed by: COLDWELL BANKER BROWN REALTORS $200,000Pending3 beds 3 baths2,166 sq. ft.
5004 Castlegate Lane, Godfrey, IL 62035
MLS# 26022619Listed by: ADAMS AUCTION & REAL ESTATE SERVICES INC. $210,000Pending3 beds 2 baths1,700 sq. ft.
400 Saint Rose Drive, Godfrey, IL 62035
MLS# 26021608Listed by: RE/MAX ALLIANCE $299,000Pending3 beds 2 baths1,716 sq. ft.
1409 Elmwood Drive, Alton, IL 62002
MLS# 26022087Listed by: TARRANT AND HARMAN REAL ESTATE AND AUCTION CO $71,000Active2.24 Acres
0 Deer Run Drive, Alton, IL 62002
MLS# 26021751Listed by: RE/MAX ALLIANCE $134,900Pending3 beds 1 baths960 sq. ft.
201 Pine Ridge Drive, Godfrey, IL 62035
MLS# 26019162Listed by: KELLER WILLIAMS MARQUEE $275,000Active2.63 Acres
6901 Godfrey Road, Godfrey, IL 62035
MLS# 26018979Listed by: MARKET PRO REALTY, INC $175,000Pending2 beds 1 baths964 sq. ft.
1324 Normandy Drive, Godfrey, IL 62035
MLS# 26018824Listed by: MARKET PRO REALTY, INC $185,000Pending3 beds 2 baths2,095 sq. ft.
4917 W Hill Drive, Godfrey, IL 62035
MLS# 26017108Listed by: LANDMARK REALTY $550,000Active2.5 Acres
0 Montclair / Hwy 255, Godfrey, IL 62035
MLS# 26012707Listed by: TARRANT AND HARMAN REAL ESTATE AND AUCTION CO $159,900Active2 beds 2 baths1,296 sq. ft.
4821 Wick Mor Drive, Alton, IL 62002
MLS# 26016323Listed by: KELLER WILLIAMS MARQUEE $235,000Active3 beds 2 baths1,744 sq. ft.
2305 W Delmar Avenue, Godfrey, IL 62035
MLS# 26015069Listed by: COLDWELL BANKER BROWN REALTORS $289,900Pending4 beds 3 baths2,176 sq. ft.
1707 Cordell Court, Godfrey, IL 62035
MLS# 26011994Listed by: TARRANT AND HARMAN REAL ESTATE AND AUCTION CO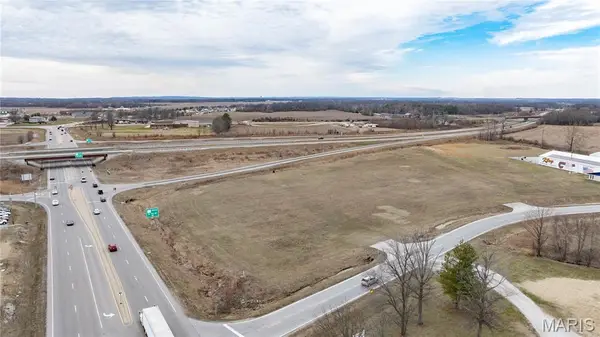 $950,000Active5.01 Acres
0 Montclair / Hwy 255, Godfrey, IL 62035
MLS# 26010866Listed by: TARRANT AND HARMAN REAL ESTATE AND AUCTION CO $35,000Active0.41 Acres
4802 Blu Fountain Drive, Godfrey, IL 62035
MLS# 26012221Listed by: LANDMARK REALTY $189,900Active4 beds 2 baths2,108 sq. ft.
1606 Paris Drive, Godfrey, IL 62035
MLS# 26011699Listed by: RE/MAX ALLIANCE $247,900Pending3 beds 3 baths2,284 sq. ft.
801 Stamper Lane, Godfrey, IL 62035
MLS# 26009722Listed by: H3 CAPITAL REAL ESTATE, LLC $248,000Pending3 beds 2 baths1,040 sq. ft.
2903 Airport Road, Godfrey, IL 62035
MLS# 26003575Listed by: GENSTONE REALTY $249,000Active3 beds 3 baths2,716 sq. ft.
1809 Montview Avenue, Godfrey, IL 62035
MLS# 26000514Listed by: MARKET PRO REALTY, INC $347,500Pending3 beds 3 baths2,776 sq. ft.
406 Celesta Street, Godfrey, IL 62035
MLS# 25081285Listed by: COLDWELL BANKER BROWN REALTORS $205,000Pending4 beds 4 baths1,954 sq. ft.
369 Hand Drive, Godfrey, IL 62035
MLS# 25078721Listed by: BOTTERBUSH & ASSOCIATES $65,000Pending3 beds 1 baths1,215 sq. ft.
5006 Staten Drive, Godfrey, IL 62035
MLS# 25075954Listed by: KELLER WILLIAMS MARQUEE $165,000Active4 beds 3 baths2,676 sq. ft.
4443 Delta Queen Lane, Godfrey, IL 62035
MLS# 25078602Listed by: RE/MAX ALLIANCE $999,500Active4 beds 5 baths4,346 sq. ft.
4715 Richland Woods Court, Alton, IL 62002
MLS# 25078367Listed by: LANDMARK REALTY $195,000Active3 beds 1 baths1,000 sq. ft.
3412 Emma Ln Lane, Godfrey, IL 62035
MLS# 25073297Listed by: EXP REALTY $54,000Active4.41 Acres
100 & 101 Sheffield Place, Alton, IL 62002
MLS# 25066398Listed by: TARRANT AND HARMAN REAL ESTATE AND AUCTION CO $215,000Active3 beds 2 baths1,272 sq. ft.
5667 Humbert Road, Godfrey, IL 62035
MLS# 25066473Listed by: KELLER WILLIAMS MARQUEE $749,000Active-- beds -- baths
3808 Stanka, Godfrey, IL 62035
MLS# 25062243Listed by: GORI REALTORS, LLC $279,000Pending6.75 Acres
0 Humbert Road, Godfrey, IL 62035
MLS# 25052876Listed by: TARRANT AND HARMAN REAL ESTATE AND AUCTION CO $45,000Active0.29 Acres
5404 Woodland Meadows Drive, Godfrey, IL 62035
MLS# 25052114Listed by: LANDMARK REALTY $45,000Active0.29 Acres
1403 Ryan Drive, Godfrey, IL 62035
MLS# 25052117Listed by: LANDMARK REALTY $39,000Active0.29 Acres
5402 Woodland Meadows Drive, Godfrey, IL 62035
MLS# 25052124Listed by: LANDMARK REALTY $1,990Active0.16 Acres
00 Pine Ridge Lot#52 Drive, Godfrey, IL 62035
MLS# 25036959Listed by: BEYCOME BROKERAGE REALTY LLC $18,500Active0.39 Acres
5221 Sundrop, Godfrey, IL 62035
MLS# 25018162Listed by: RE/MAX ALLIANCE $279,000Pending0 Acres
4803 Azalea Place #1, Godfrey, IL 62035
MLS# 25005612Listed by: LANDMARK REALTY $350,000Active-- beds -- baths
0 Humbert Road, Alton, IL 62002
MLS# 25003159Listed by: LANDMARK REALTY $2,200,000Active18.16 Acres
6713 Godfrey Road, Godfrey, IL 62035
MLS# 24071760Listed by: NATIONAL LAND REALTY EASTERN MO, LLC $17,000Active0 Acres
1900 Cheyenne Drive, Godfrey, IL 62035
MLS# 22024650Listed by: COLDWELL BANKER BROWN REALTORS $10,000Active0 Acres
3 Summerfield, Godfrey, IL 62035
MLS# 26008250Listed by: LANDMARK REALTY
Local realty services provided by:CENTURY 21 Broughton Team, CENTURY 21 North East
Copyright 2026 Mid-America Regional Information Systems. All rights reserved. Listings courtesy of Mid-America Regional Information Systems as distributed by MLS GRID <Last Updated May 31, 2026. Mid-America Regional Information Systems provides content displayed here (“provided content”) on an “as is” basis and makes no representations or warranties regarding the provided content, including, but not limited to those of non-infringement, timeliness, accuracy, or completeness. Individuals and companies using information presented are responsible for verification and validation of information they utilize and present to their customers and clients. Mid-America Regional Information Systems will not be liable for any damage or loss resulting from use of the provided content or the products available through Portals, IDX, VOW, and/or Syndication. Recipients of this information shall not resell, redistribute, reproduce, modify, or otherwise copy any portion thereof without the expressed written consent of Mid-America Regional Information Systems.
Copyright 2026 Midwest Real Estate Data LLC. All rights reserved. The data relating to real estate for sale on this web site comes in part from the Broker Reciprocity Program of the Midwest Real Estate Data LLC. Listing information is deemed reliable but not guaranteed. MLSNI Member Broker: Nate Brown
Neighborhoods near Godfrey, IL
Zip codes near Godfrey, IL
- 62002 homes for sale
- 62010 homes for sale
- 62012 homes for sale
- 62018 homes for sale
- 62024 homes for sale
- 62035 homes for sale
- 62037 homes for sale
- 62048 homes for sale
- 62052 homes for sale
- 62067 homes for sale
- 62084 homes for sale
- 62087 homes for sale
- 62095 homes for sale
- 63031 homes for sale
- 63033 homes for sale
- 63034 homes for sale
- 63042 homes for sale
- 63136 homes for sale
- 63137 homes for sale
- 63138 homes for sale
Popular searches near Godfrey, IL
- Alton homes for sale
- Bethalto homes for sale
- Black Jack homes for sale
- Brighton homes for sale
- Brighton township homes for sale
- Cottage Hills homes for sale
- East Alton homes for sale
- Elsah Township homes for sale
- Foster homes for sale
- Grafton homes for sale
- Lewis and Clark homes for sale
- Mississippi homes for sale
- Moro homes for sale
- Old Jamestown homes for sale
- Piasa homes for sale
- Rosewood Heights homes for sale
- Spanish Lake township homes for sale
- Spanish Lake homes for sale
- Wood River homes for sale
- Wood River Township homes for sale
Protect your home and budget from life's surprises with an Assurant Home Warranty, backed by a partner that supports you through every step of homeownership. Explore Plans.
©2026 Century 21 Real Estate LLC. All rights reserved. CENTURY 21®, the CENTURY 21 Logo and C21® are service marks owned by Century 21 Real Estate LLC. Century 21 Real Estate LLC fully supports the principles of the Fair Housing Act and the Equal Opportunity Act. Each office is independently owned and operated. Listing information is deemed reliable but not guaranteed accurate.