Grant County, ND - homes for sale
2 of 2 results displayed
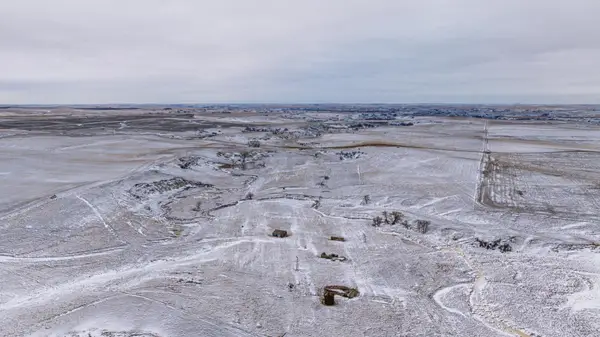 $700,000Active158.22 Acres
TBD SW 49 St 200a, Hebron, ND 58638
MLS# 7022055Listed by: DAKOTA PLAINS REALTY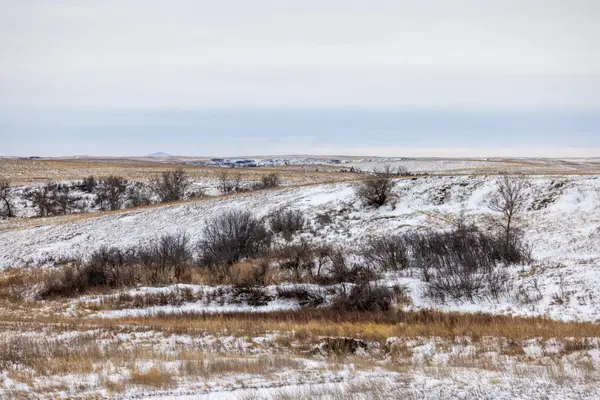 $742,350Active212 Acres
TBD 49 St SW 212a, Hebron, ND 58638
MLS# 7022140Listed by: DAKOTA PLAINS REALTY
Local realty services provided by:CENTURY 21 Brainerd Realty, Inc.
Popular searches near Grant County, ND
Zip codes near Grant County, ND
Protect your home and budget from life's surprises with an Assurant Home Warranty, backed by a partner that supports you through every step of homeownership. Explore Plans.
©2026 Century 21 Real Estate LLC. All rights reserved. CENTURY 21®, the CENTURY 21 Logo and C21® are service marks owned by Century 21 Real Estate LLC. Century 21 Real Estate LLC fully supports the principles of the Fair Housing Act and the Equal Opportunity Act. Each office is independently owned and operated. Listing information is deemed reliable but not guaranteed accurate.