- Alta homes for sale
- Alta Sierra homes for sale
- Applegate homes for sale
- Colfax homes for sale
- Colfax-Monumental Ridge homes for sale
- Foresthill homes for sale
- Gold Run homes for sale
- Grass Valley homes for sale
- Iowa Hill homes for sale
- Lake Of The Pines homes for sale
- Lake Wildwood homes for sale
- Meadow Vista homes for sale
- Nevada City homes for sale
- North San Juan homes for sale
- North San Juan homes for sale
- Penn Valley homes for sale
- Pike homes for sale
- Rough And Ready homes for sale
- Smartsville homes for sale
- Washington homes for sale
95945, CA - homes for sale
180 of 180 results displayed
- New
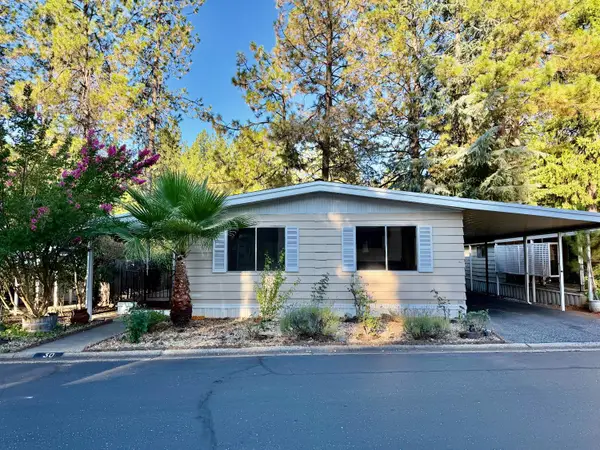 $59,000Active2 beds 2 baths1,344 sq. ft.
30 Candy Lane, Grass Valley, CA 95945
MLS# 226093431Listed by: RE/MAX GOLD - New
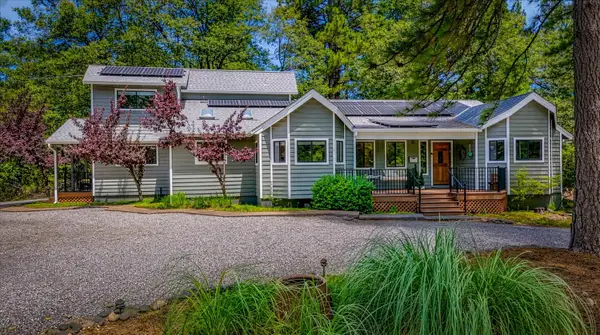
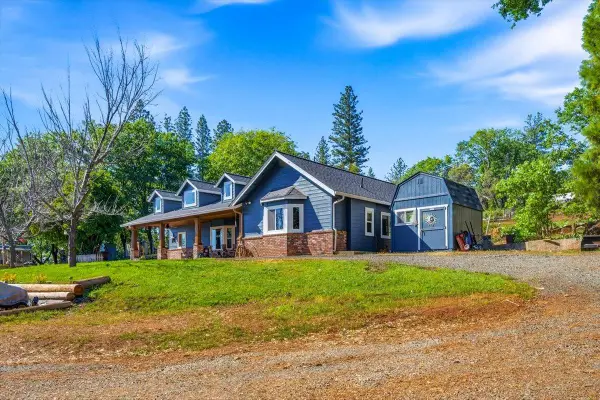
 $845,000Active3 beds 3 baths2,879 sq. ft.
14333 Brooks Road, Grass Valley, CA 95945
MLS# 226094261Listed by: CENTURY 21 CORNERSTONE REALTY - New
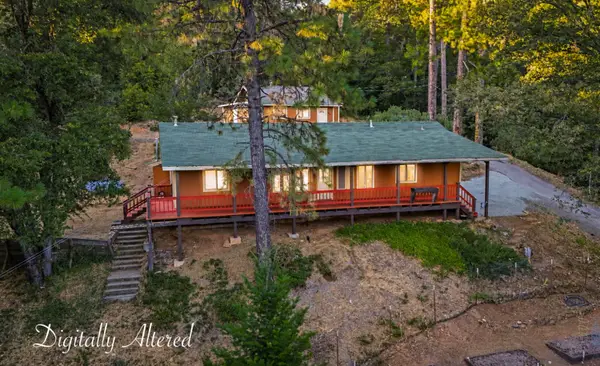 $439,000Active2 beds 2 baths1,344 sq. ft.
17934 Knoll Top Drive, Grass Valley, CA 95945
MLS# 226093377Listed by: RE/MAX GOLD - New
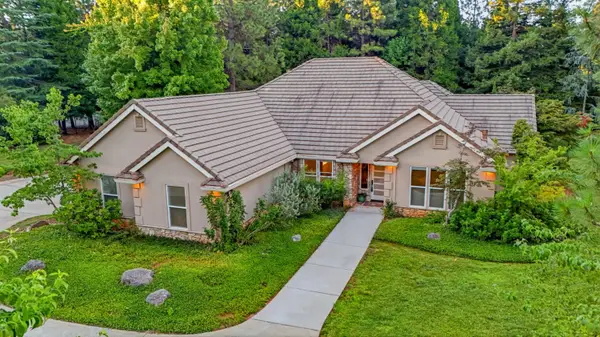 $799,000Active3 beds 3 baths2,895 sq. ft.
12893 Chatsworth Lane, Grass Valley, CA 95945
MLS# 226092993Listed by: RE/MAX GOLD - New
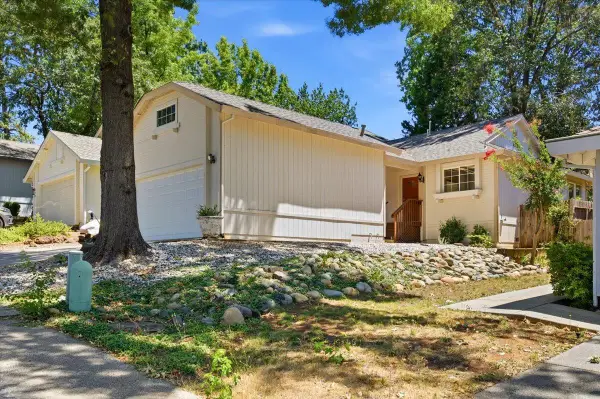
 $440,000Active3 beds 2 baths1,136 sq. ft.
534 Fawcett Street, Grass Valley, CA 95945
MLS# 226092763Listed by: EXP REALTY OF NORTHERN CALIFORNIA, INC. - New
 $410,000Active3 beds 2 baths1,260 sq. ft.
579 Delia Court, Grass Valley, CA 95945
MLS# 226091340Listed by: COLDWELL BANKER GRASS ROOTS REALTY - New
 $699,000Active3 beds 3 baths2,211 sq. ft.
131 Race Street, Grass Valley, CA 95945
MLS# 226093443Listed by: MASTERS TEAM MORTGAGE - New
 $350,000Active2 beds 2 baths1,386 sq. ft.
198 Rockwood Drive, Grass Valley, CA 95945
MLS# 226092098Listed by: CENTURY 21 CORNERSTONE REALTY - New
 $799,500Active3 beds 5 baths1,689 sq. ft.
10740 Cole Way, Grass Valley, CA 95945
MLS# 226092737Listed by: RE/MAX GOLD - New
 $420,000Active2 beds 2 baths1,042 sq. ft.
344 Horizon Circle, Grass Valley, CA 95945
MLS# 226089242Listed by: COLDWELL BANKER GRASS ROOTS REALTY - New
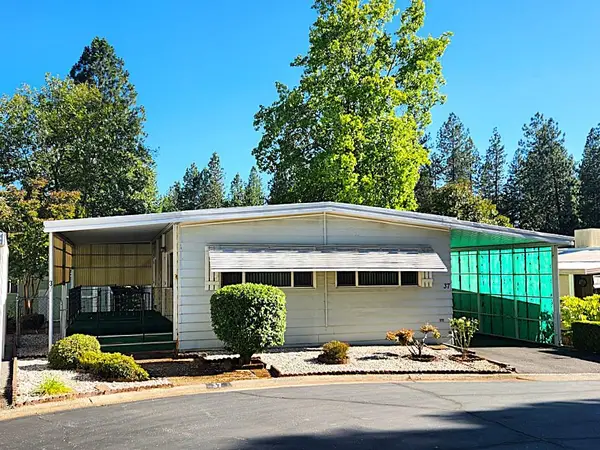 $67,000Active2 beds 2 baths1,152 sq. ft.
37 Wendy Circle, Grass Valley, CA 95945
MLS# 226072985Listed by: CENTURY 21 CORNERSTONE REALTY - New
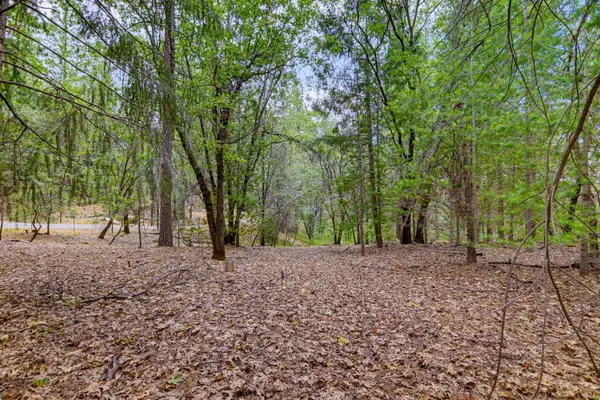 $95,000Active1.97 Acres
16020 Brooks Road, Grass Valley, CA 95945
MLS# 226089438Listed by: RE/MAX GOLD - New
 $650,000Active3 beds 2 baths1,670 sq. ft.
15775 Rattlesnake Road, Grass Valley, CA 95945
MLS# 226078064Listed by: EXP REALTY OF CALIFORNIA INC. 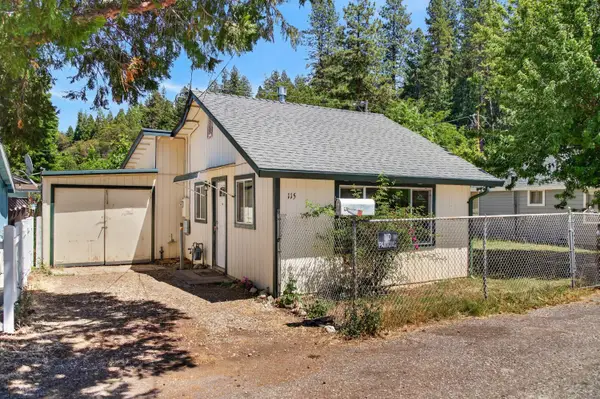 $250,000Pending1 beds 1 baths616 sq. ft.
115 Stennett Street, Grass Valley, CA 95945
MLS# 226090198Listed by: LPT REALTY, INC- New
 $589,000Active2 beds 3 baths1,760 sq. ft.
10388 Partridge Road, Grass Valley, CA 95945
MLS# 226089660Listed by: RE/MAX GOLD  $749,000Active3 beds 2 baths1,949 sq. ft.
12176 E Bennett Road, Grass Valley, CA 95945
MLS# 226089720Listed by: CLA REALTY $350,000Active1 beds 1 baths776 sq. ft.
10379 Carey Drive, Grass Valley, CA 95945
MLS# 226089041Listed by: EXP REALTY OF NORTHERN CALIFORNIA, INC. $235,000Active1 beds 1 baths630 sq. ft.
239 Mill Street #6, Grass Valley, CA 95945
MLS# 226088762Listed by: RE/MAX GOLD $585,000Active3 beds 2 baths1,789 sq. ft.
14207 Tim Burr Lane, Grass Valley, CA 95945
MLS# 226087573Listed by: RECREATION REALTY $500,000Active3 beds 2 baths1,404 sq. ft.
610 Le Duc, Grass Valley, CA 95945
MLS# 226084948Listed by: BETTER HOMES AND GARDENS RE $699,000Active3 beds 2 baths2,061 sq. ft.
15241 Birch Meadows Circle, Grass Valley, CA 95945
MLS# 226087037Listed by: COLDWELL BANKER GRASS ROOTS REALTY $665,000Active3 beds 3 baths2,204 sq. ft.
124 Ruby Ledge Court, Grass Valley, CA 95945
MLS# 226087575Listed by: CENTURY 21 CORNERSTONE REALTY $249,000Active28.93 Acres
17506 Lowell Hill Road, Grass Valley, CA 95945
MLS# 226086800Listed by: DIAMOND REAL ESTATE GROUP $230,000Active2.5 Acres
13025 Wild Life Lane, Grass Valley, CA 95945
MLS# 226085968Listed by: DALTON WADE, INC. $425,000Pending2 beds 2 baths1,440 sq. ft.
12759 Squirrel Creek Road, Grass Valley, CA 95945
MLS# 226082902Listed by: SIERRA HOMES REALTY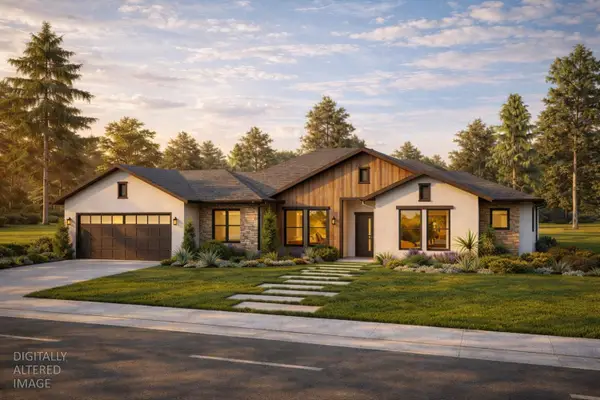 $975,000Active4 beds 3 baths2,260 sq. ft.
12429 New Brunswick Court, Grass Valley, CA 95945
MLS# 226086496Listed by: USKO REALTY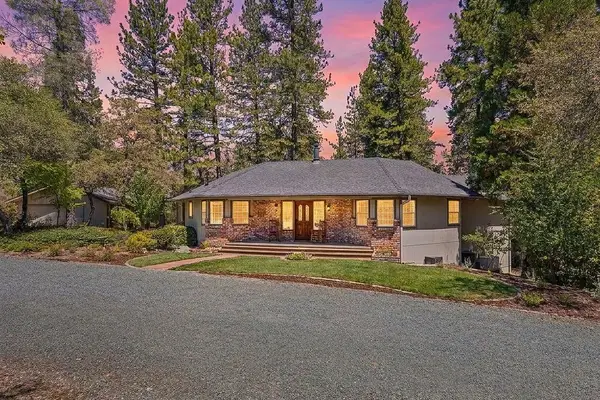 $650,000Pending3 beds 2 baths2,264 sq. ft.
13234 Squirrel Creek Road, Grass Valley, CA 95945
MLS# 226084293Listed by: REALTY ONE GROUP COMPLETE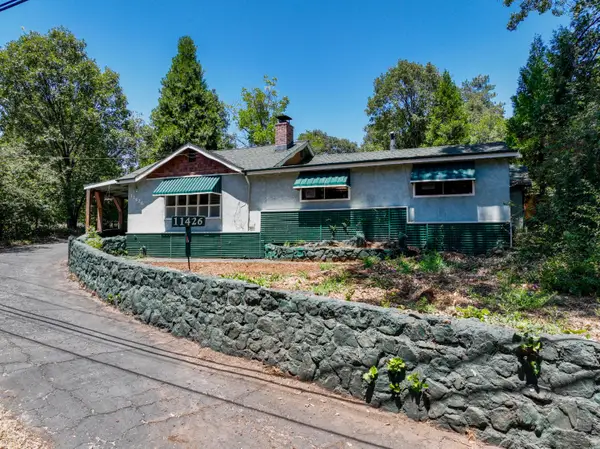 $410,000Active2 beds 2 baths1,705 sq. ft.
11410 Squirrel Creek Road, Grass Valley, CA 95945
MLS# 226084777Listed by: COLDWELL BANKER GRASS ROOTS REALTY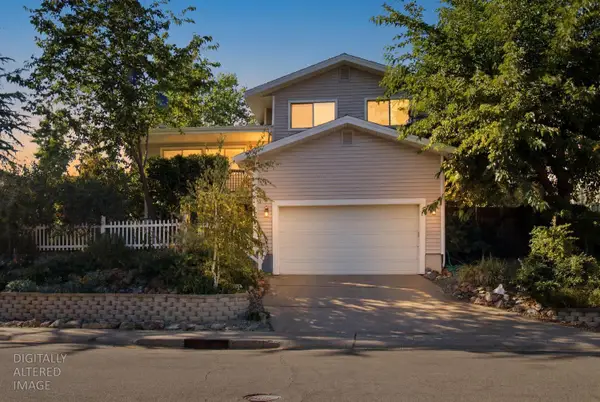 $555,000Active3 beds 2 baths1,511 sq. ft.
204 Celesta Dr., Grass Valley, CA 95945
MLS# 226075451Listed by: REALTY ONE GROUP COMPLETE $849,000Active3 beds 3 baths2,417 sq. ft.
15570 Bella Sera Court, Grass Valley, CA 95945
MLS# 226084376Listed by: HOMESMART ICARE REALTY $640,000Active2 beds 2 baths2,526 sq. ft.
13015 Lee Lane, Nevada City, CA 95959
MLS# 226077124Listed by: EMPIRE REALTY $129,000Active2 beds 2 baths1,392 sq. ft.
31 Candy Lane, Grass Valley, CA 95945
MLS# 226083938Listed by: RE/MAX GOLD $443,500Active2 beds 2 baths960 sq. ft.
407 Richardson Street, Grass Valley, CA 95945
MLS# 226084309Listed by: RE/MAX GOLD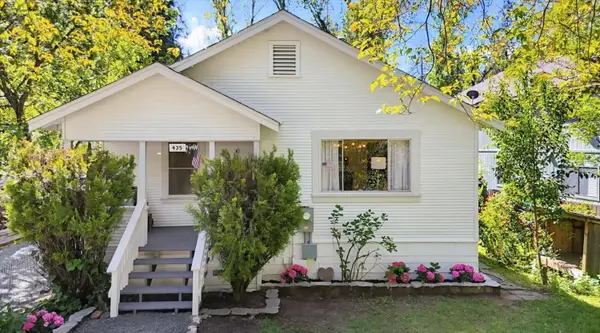 $519,000Active3 beds 2 baths1,477 sq. ft.
435 Mill Street, Grass Valley, CA 95945
MLS# 226084188Listed by: MITCHELL REAL ESTATE $549,000Active5 beds 3 baths1,858 sq. ft.
20292 Killarney Lane, Grass Valley, CA 95945
MLS# 226083887Listed by: REFINED REALTY GROUP $1,125,000Active3 beds 4 baths3,110 sq. ft.
19539 Mountain Lion Road, Grass Valley, CA 95945
MLS# 226043637Listed by: COLDWELL BANKER REALTY $275,000Active3 beds 2 baths1,664 sq. ft.
16404 Greenhorn Road, Grass Valley, CA 95945
MLS# 226066666Listed by: GUIDE REAL ESTATE $635,000Active4 beds 2 baths2,600 sq. ft.
11312 Alpine Lane, Grass Valley, CA 95945
MLS# 226082848Listed by: CENTURY 21 CORNERSTONE REALTY $265,000Active2 beds 1 baths1,110 sq. ft.
819 Annex Avenue, Grass Valley, CA 95945
MLS# 226079395Listed by: KELLER WILLIAMS REALTY GOLD COUNTRY $485,000Active3 beds 2 baths1,385 sq. ft.
13581 Schooner Hill Drive, Grass Valley, CA 95945
MLS# 226063224Listed by: WINDERMERE SIGNATURE PROPERTIES AUBURN $489,000Active1 beds 2 baths758 sq. ft.
134 E Empire Street, Grass Valley, CA 95945
MLS# 226066128Listed by: NICK SADEK SOTHEBY'S INTERNATIONAL REALTY $555,000Pending3 beds 3 baths2,464 sq. ft.
116 Lidster, Grass Valley, CA 95945
MLS# 226081148Listed by: KELLER WILLIAMS REALTY GOLD COUNTRY $475,000Pending3 beds 2 baths1,446 sq. ft.
19623 Casa Loma, Grass Valley, CA 95945
MLS# 226075382Listed by: CENTURY 21 CORNERSTONE REALTY $114,500Active2 beds 2 baths1,320 sq. ft.
73 Primrose Lane, Grass Valley, CA 95945
MLS# 226068201Listed by: NICK SADEK SOTHEBY'S INTERNATIONAL REALTY $399,999Active2 beds 2 baths1,350 sq. ft.
11680 Hidden Hollow Place, Grass Valley, CA 95945
MLS# 226079525Listed by: EXP REALTY OF CALIFORNIA INC $615,000Pending4 beds 2 baths2,403 sq. ft.
15269 Orchard Springs Road, Grass Valley, CA 95945
MLS# 226079999Listed by: REAL BROKERAGE TECHNOLOGIES, INC. $399,000Active3 beds 3 baths2,332 sq. ft.
13971 Ryans Ranch Road, Grass Valley, CA 95945
MLS# 226079517Listed by: LPT REALTY, INC $340,000Pending2 beds 1 baths1,775 sq. ft.
14405 Talking Pines Road, Grass Valley, CA 95945
MLS# 226064275Listed by: COLDWELL BANKER GRASS ROOTS REALTY $625,000Active3 beds 3 baths2,162 sq. ft.
11575 Shockley Road, Grass Valley, CA 95945
MLS# 226077875Listed by: COLDWELL BANKER GRASS ROOTS REALTY $325,000Pending3 beds 2 baths1,150 sq. ft.
14175 Rollins Park Drive, Grass Valley, CA 95945
MLS# 226077146Listed by: EXP REALTY OF CALIFORNIA INC. $625,000Pending3 beds 2 baths2,182 sq. ft.
14240 Hollydale Road, Grass Valley, CA 95945
MLS# 226071915Listed by: RE/MAX GOLD $394,000Active4 beds 3 baths1,902 sq. ft.
159 Harris Street, Grass Valley, CA 95945
MLS# 226077691Listed by: REALTY ONE GROUP COMPLETE $339,000Active2 beds 1 baths580 sq. ft.
638 Leduc Street, Grass Valley, CA 95945
MLS# 226077514Listed by: SIERRA HOMES REALTY $118,000Pending0.44 Acres
10693 Alta Street, Grass Valley, CA 95945
MLS# 226076407Listed by: EXP REALTY OF CALIFORNIA INC. $519,900Active2 beds 2 baths1,279 sq. ft.
108 Pintail Place, Grass Valley, CA 95945
MLS# 226075916Listed by: GOLD COUNTRY RANCHES AND REALTY $349,000Active10 Acres
12226 Pine Cone Circle, Grass Valley, CA 95945
MLS# 226075891Listed by: SIERRA HOMES REALTY $499,000Pending3 beds 2 baths1,618 sq. ft.
10524 Alta Street, Grass Valley, CA 95945
MLS# 226070234Listed by: REDFIN CORPORATION $625,000Active2 beds 2 baths1,135 sq. ft.
11456 Mirror Lake Court, Grass Valley, CA 95945
MLS# 226040698Listed by: CENTURY 21 CORNERSTONE REALTY $249,500Active2 beds 2 baths932 sq. ft.
218 Depot Street, Grass Valley, CA 95945
MLS# 226066268Listed by: CENTURY 21 CORNERSTONE REALTY $875,000Pending3 beds 3 baths2,084 sq. ft.
13636 Vincent Court, Grass Valley, CA 95945
MLS# 226075285Listed by: COLDWELL BANKER GRASS ROOTS REALTY $357,500Active2 beds 2 baths1,344 sq. ft.
11154 Vista Avenue, Grass Valley, CA 95945
MLS# 226073805Listed by: COLDWELL BANKER REALTY $414,500Active2 beds 2 baths1,131 sq. ft.
230 June Drive, Grass Valley, CA 95945
MLS# 226073423Listed by: COLDWELL BANKER GRASS ROOTS REALTY $599,000Pending3 beds 2 baths1,820 sq. ft.
12669 Greenfields Way, Grass Valley, CA 95945
MLS# 226073426Listed by: RE/MAX GOLD $346,000Pending2 beds 1 baths864 sq. ft.
112 Kendall Street, Grass Valley, CA 95945
MLS# 226073115Listed by: REAL BROKER TECHNOLOGIES $449,000Active6.21 Acres
13987 Lee Lane, Nevada City, CA 95959
MLS# 226072981Listed by: JARED ENGLISH, BROKER $1,450,000Active5 beds 4 baths3,100 sq. ft.
18339 Colfax Highway, Grass Valley, CA 95945
MLS# 226072743Listed by: REAL BROKERAGE TECHNOLOGIES, INC. $695,000Active3 beds 2 baths1,913 sq. ft.
417 Chapel Street, Grass Valley, CA 95945
MLS# 226072647Listed by: RE/MAX GOLD $659,000Active4 beds 6 baths2,751 sq. ft.
549 Glenwood Road, Grass Valley, CA 95945
MLS# 226071149Listed by: RE/MAX GOLD $718,000Active3 beds 3 baths2,021 sq. ft.
14400 Cherokee Lane, Grass Valley, CA 95945
MLS# 226071410Listed by: GOLD COUNTRY RANCHES AND REALTY $849,000Active4 beds 4 baths3,588 sq. ft.
13031 Cedar Crest Lane, Grass Valley, CA 95945
MLS# 226046430Listed by: COLDWELL BANKER GRASS ROOTS REALTY $525,000Active-- beds -- baths1,692 sq. ft.
291 Cornwall Avenue, Grass Valley, CA 95945
MLS# 226069001Listed by: DISCOVERY PROPERTY GROUP, INC. $214,900Active2 beds 1 baths935 sq. ft.
135 Mainhart Drive, Grass Valley, CA 95945
MLS# 226067869Listed by: COLDWELL BANKER GRASS ROOTS REALTY $699,000Pending3 beds 2 baths1,835 sq. ft.
970 Morgan Ranch Drive, Grass Valley, CA 95945
MLS# 226065134Listed by: CENTURY 21 CORNERSTONE REALTY $1,150,000Active4 beds 5 baths3,108 sq. ft.
14624 Cherokee Lane, Grass Valley, CA 95945
MLS# 226065699Listed by: RE/MAX GOLD $665,045Active4 beds 3 baths2,380 sq. ft.
132 Pascoe Way, Grass Valley, CA 95945
MLS# 226014857Listed by: RICHMOND AMERICAN HOMES OF MARYLAND, INC $165,000Active10 Acres
14599 Tumbling Creek, Nevada City, CA 95959
MLS# 226065518Listed by: COLDWELL BANKER GRASS ROOTS REALTY $470,000Active3 beds 2 baths1,344 sq. ft.
10819 Walker Drive, Grass Valley, CA 95945
MLS# 226065743Listed by: REMAX DREAM HOMES $647,000Pending4 beds 3 baths3,121 sq. ft.
21349 Leslie Drive, Grass Valley, CA 95945
MLS# 226046586Listed by: CENTURY 21 CORNERSTONE REALTY $409,000Active1 beds 2 baths800 sq. ft.
232 Upper Slate Creek, Grass Valley, CA 95945
MLS# 226064323Listed by: RE/MAX GOLD $1,198,800Active3 beds 3 baths2,660 sq. ft.
20111 Tanglewood Road, Grass Valley, CA 95945
MLS# 226064367Listed by: CENTURY 21 CORNERSTONE REALTY $859,000Active3 beds 4 baths3,147 sq. ft.
114 Margretta Court, Grass Valley, CA 95945
MLS# 226065281Listed by: COLE MILLER, BROKER $939,000Active4 beds 3 baths2,185 sq. ft.
280 Jan Road, Grass Valley, CA 95945
MLS# 226065572Listed by: WESELY & ASSOCIATES $700,000Active4 beds 2 baths3,196 sq. ft.
303 Bennett Street, Grass Valley, CA 95945
MLS# 226061611Listed by: ARMON BATISTE, BROKER $229,000Active3.08 Acres
15834 Ladera Lane, Grass Valley, CA 95945
MLS# 226062922Listed by: MITCHELL REAL ESTATE $825,000Active3 beds 4 baths2,318 sq. ft.
15890 Orchard Springs Road, Grass Valley, CA 95945
MLS# 226063227Listed by: RE/MAX GOLD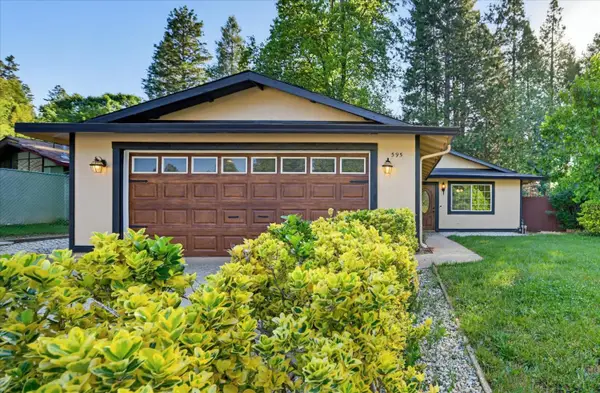 $440,000Active3 beds 2 baths1,064 sq. ft.
595 Packard Drive, Grass Valley, CA 95945
MLS# 226063376Listed by: GOLD COUNTRY RANCHES AND REALTY $50,000Active1.5 Acres
13604 Axle Court, Grass Valley, CA 95945
MLS# 226061724Listed by: RE/MAX GOLD $255,000Pending2 beds 1 baths748 sq. ft.
11314 Squirrel Creek Road, Grass Valley, CA 95945
MLS# 226060909Listed by: KELLER WILLIAMS REALTY $620,000Active5 beds 4 baths3,104 sq. ft.
19170 Tiger Lily Lane, Grass Valley, CA 95945
MLS# 226059169Listed by: REED BLOCK REALTY $2,190,000Active3 beds 3 baths2,909 sq. ft.
19698 View Forever Lane, Grass Valley, CA 95945
MLS# 226045268Listed by: COLDWELL BANKER GRASS ROOTS REALTY $800,000Active3 beds 2 baths1,700 sq. ft.
14792 Wabash Avenue, Grass Valley, CA 95945
MLS# 226056035Listed by: KELLER WILLIAMS REALTY $70,000Active0.26 Acres
984 Slate Creek Road, Grass Valley, CA 95945
MLS# 226049506Listed by: CENTURY 21 CORNERSTONE REALTY $85,000Active3 beds 2 baths1,320 sq. ft.
975 Amber Loop, Grass Valley, CA 95945
MLS# 226052600Listed by: WINDERMERE SIGNATURE PROPERTIES AUBURN $99,900Active3.32 Acres
15367 Lakewood Lane, Grass Valley, CA 95945
MLS# 226053239Listed by: WESELY & ASSOCIATES $360,000Pending3 beds 2 baths1,980 sq. ft.
11678 Otting Court, Grass Valley, CA 95945
MLS# 226049837Listed by: A 2 Z HOMES, INC. $875,000Pending4 beds 5 baths4,296 sq. ft.
12735 Davis Lane, Nevada City, CA 95959
MLS# 226037767Listed by: CENTURY 21 CORNERSTONE REALTY $423,500Pending3 beds 2 baths1,379 sq. ft.
13608 Day Road, Grass Valley, CA 95945
MLS# 226045706Listed by: CENTURY 21 CORNERSTONE REALTY $849,000Pending4 beds 3 baths3,543 sq. ft.
14838 Christophers Place, Grass Valley, CA 95945
MLS# 226045772Listed by: WESELY & ASSOCIATES $1,298,600Active3 beds 3 baths2,598 sq. ft.
13629 Oak Forest Drive, Grass Valley, CA 95945
MLS# 226046231Listed by: RE/MAX GOLD $70,000Active4.97 Acres
13928 Manion Canyon Road, Grass Valley, CA 95945
MLS# 226044903Listed by: WALT WILSON REAL ESTATE $489,000Active3 beds 2 baths1,381 sq. ft.
10624 Silver Way, Grass Valley, CA 95945
MLS# 226039826Listed by: CENTURY 21 CORNERSTONE REALTY $670,000Pending2 beds 2 baths2,238 sq. ft.
526 Mill Street #1, Grass Valley, CA 95945
MLS# 226040466Listed by: CROSBY REAL ESTATE $679,000Active1.5 Acres
13004 Somerset Drive, Grass Valley, CA 95945
MLS# 226039886Listed by: RE/MAX GOLD $670,000Pending-- beds -- baths2,238 sq. ft.
526 Mill Street, Grass Valley, CA 95945
MLS# 226039985Listed by: CROSBY REAL ESTATE $680,000Active3 beds 3 baths2,413 sq. ft.
15580 Kitkitdizze Drive, Grass Valley, CA 95945
MLS# 226036120Listed by: REAL BROKER TECHNOLOGIES $445,000Active2 beds 1 baths1,092 sq. ft.
190 Upper Slate Creek Road, Grass Valley, CA 95945
MLS# 226021048Listed by: CENTURY 21 CORNERSTONE REALTY $739,000Active5 beds 3 baths2,896 sq. ft.
12528 Rattlesnake Road, Grass Valley, CA 95945
MLS# 226038730Listed by: LANDMARK PROPERTIES $250,000Active6.79 Acres
1349 Idaho Maryland Road, Grass Valley, CA 95945
MLS# 226000756Listed by: CENTURY 21 CORNERSTONE REALTY $567,000Active3 beds 3 baths1,549 sq. ft.
331 Horizon Circle, Grass Valley, CA 95945
MLS# 226031432Listed by: CALI-LINK REALTY & MORTGAGE INC. $69,900Active1.5 Acres
13637 Capitol Drive, Grass Valley, CA 95945
MLS# 226037619Listed by: RE/MAX GOLD $695,000Active3 beds 2 baths1,907 sq. ft.
11000 Bubbling Wells Road, Grass Valley, CA 95945
MLS# 226036764Listed by: GOLD GROUP REALTY $470,000Pending3 beds 2 baths1,470 sq. ft.
11782 Brunswick Pines Road, Grass Valley, CA 95945
MLS# 226036855Listed by: MITCHELL REAL ESTATE $659,000Active3 beds 2 baths2,568 sq. ft.
13709 Capitol Drive, Grass Valley, CA 95945
MLS# 226034486Listed by: RE/MAX GOLD $799,000Pending4 beds 2 baths2,700 sq. ft.
12562 Rough And Ready Highway, Grass Valley, CA 95945
MLS# 226010593Listed by: CENTURY 21 CORNERSTONE REALTY $99,000Pending2.46 Acres
0 Pleasant St., Grass Valley, CA 95945
MLS# 226035306Listed by: EXP REALTY OF NORTHERN CALIFORNIA, INC. $149,000Active9.46 Acres
17414 You Bet Road, Grass Valley, CA 95945
MLS# 226036069Listed by: GRANITE RE COMMERCIAL $53,000Pending0.14 Acres
0 Eureka Street, Grass Valley, CA 95945
MLS# 226036256Listed by: CENTURY 21 CORNERSTONE REALTY $560,000Active3 beds 2 baths1,706 sq. ft.
10901 Footwall Drive, Grass Valley, CA 95945
MLS# 226034022Listed by: RE/MAX GOLD $695,000Active30.25 Acres
13685 Idaho Maryland Road, Nevada City, CA 95959
MLS# 226027219Listed by: RE/MAX GOLD $549,950Active2 beds 3 baths2,038 sq. ft.
12383 Rough And Ready Highway, Grass Valley, CA 95945
MLS# 226025946Listed by: COLDWELL BANKER GRASS ROOTS REALTY $49,900Active0 Acres
15052 Red Hill Spring, Nevada City, CA 95959
MLS# PI26051668Listed by: DAVID NORWOOD CENTRAL COAST REAL ESTATE $185,000Active40 Acres
18148 Greenhorn Road, Grass Valley, CA 95945
MLS# 226018111Listed by: HOMESMART ICARE REALTY $115,000Active8.29 Acres
14037 Arrowhead Mine Road, Grass Valley, CA 95945
MLS# 225148646Listed by: EXP REALTY OF CALIFORNIA INC. $155,000Active20.11 Acres
18100 Greenhorn Road, Grass Valley, CA 95945
MLS# 226018128Listed by: HOMESMART ICARE REALTY $75,000Pending2.23 Acres
16571 Meadow Way, Grass Valley, CA 95945
MLS# 226016148Listed by: EXP REALTY OF NORTHERN CALIFORNIA, INC. $1,285,000Active4 beds 4 baths3,672 sq. ft.
12933 Elk Lane, Grass Valley, CA 95945
MLS# 226013334Listed by: RE/MAX GOLD $449,000Active2 beds 1 baths1,025 sq. ft.
10149 East Drive, Grass Valley, CA 95945
MLS# 226009802Listed by: CHRISTIE'S INTERNATIONAL REAL ESTATE SERENO $575,000Active2 beds 2 baths1,904 sq. ft.
14752 Little Greenhorn Road, Grass Valley, CA 95945
MLS# 226008778Listed by: RE/MAX GOLD $77,000Pending3.41 Acres
16621 Greenhorn Road, Grass Valley, CA 95945
MLS# 226004527Listed by: RE/MAX GOLD $630,950Active4 beds 3 baths2,680 sq. ft.
235 Shamrock Dr, Grass Valley, CA 95945
MLS# 226002615Listed by: RICHMOND AMERICAN HOMES OF MARYLAND, INC $669,000Active3 beds 1 baths1,737 sq. ft.
203 Race Street, Grass Valley, CA 95945
MLS# 225154210Listed by: EXP REALTY OF CALIFORNIA INC. $75,000Active4.86 Acres
13787 Manion Canyon Road, Grass Valley, CA 95945
MLS# 225154220Listed by: EXP REALTY OF NORTHERN CALIFORNIA, INC. $40,000Active5.74 Acres
17631 Greenhorn Road, Grass Valley, CA 95945
MLS# 225149640Listed by: SIERRA HOMES REALTY $265,000Pending3 beds 2 baths1,260 sq. ft.
10819 Gold Hill Drive, Grass Valley, CA 95945
MLS# 225145377Listed by: RUBIO REAL ESTATE $179,500Active2 beds 2 baths1,324 sq. ft.
14822 Ryder Court #278, Grass Valley, CA 95945
MLS# 225025579Listed by: COLDWELL BANKER GRASS ROOTS REALTY $160,000Active3 beds 2 baths1,440 sq. ft.
46 Wendy Circle, Grass Valley, CA 95945
MLS# 225107994Listed by: KELLER WILLIAMS REALTY GOLD COUNTRY $360,000Active4.85 Acres
16949 Jones Ridge Road, Grass Valley, CA 95945
MLS# 225142949Listed by: EXP REALTY OF CALIFORNIA INC. $615,950Active4 beds 3 baths2,380 sq. ft.
311 Shamrock Dr, Grass Valley, CA 95949
MLS# 225137456Listed by: RICHMOND AMERICAN HOMES OF MARYLAND, INC $544,000Pending3 beds 3 baths1,486 sq. ft.
210 Elysian Place, Grass Valley, CA 95945
MLS# 225132345Listed by: COLDWELL BANKER GRASS ROOTS REALTY $50,000Active0.14 Acres
605 Cold Spring Court, Grass Valley, CA 95945
MLS# 225131863Listed by: CENTURY 21 CORNERSTONE REALTY $50,000Active0.19 Acres
611 Cold Spring Court, Grass Valley, CA 95945
MLS# 225131897Listed by: CENTURY 21 CORNERSTONE REALTY $50,000Active0.17 Acres
606 Cold Spring Court, Grass Valley, CA 95945
MLS# 225131946Listed by: CENTURY 21 CORNERSTONE REALTY $839,000Active4 beds 3 baths3,297 sq. ft.
12401 Old Mine Road, Grass Valley, CA 95945
MLS# 225131966Listed by: TUCKER COMMERCIAL $50,000Active0.23 Acres
614 Cold Spring Court, Grass Valley, CA 95945
MLS# 225132248Listed by: CENTURY 21 CORNERSTONE REALTY $50,000Active0.28 Acres
106 Jackrabbit Road, Grass Valley, CA 95945
MLS# 225132253Listed by: CENTURY 21 CORNERSTONE REALTY $50,000Active0.11 Acres
110 Jackrabbit Road, Grass Valley, CA 95945
MLS# 225132263Listed by: CENTURY 21 CORNERSTONE REALTY $50,000Active0.11 Acres
114 Jackrabbit Road, Grass Valley, CA 95945
MLS# 225132268Listed by: CENTURY 21 CORNERSTONE REALTY $50,000Active0.11 Acres
118 Jackrabbit Road, Grass Valley, CA 95945
MLS# 225132279Listed by: CENTURY 21 CORNERSTONE REALTY $50,000Active0.11 Acres
122 Jackrabbit Road, Grass Valley, CA 95945
MLS# 225132282Listed by: CENTURY 21 CORNERSTONE REALTY $50,000Active0.2 Acres
126 Jackrabbit Road, Grass Valley, CA 95945
MLS# 225132285Listed by: CENTURY 21 CORNERSTONE REALTY $50,000Active0.15 Acres
136 Jackrabbit Road, Grass Valley, CA 95945
MLS# 225132343Listed by: CENTURY 21 CORNERSTONE REALTY $50,000Active0.13 Acres
111 Lone Jack Place, Grass Valley, CA 95945
MLS# 225132344Listed by: CENTURY 21 CORNERSTONE REALTY $2,750,000Active-- beds -- baths
10530 Walker, Grass Valley, CA 95945
MLS# 225125423Listed by: TWO FEATHERS REALTY $349,000Active5 Acres
14788 Arrowhead Mine Road, Grass Valley, CA 95945
MLS# 225123629Listed by: SIERRA HERITAGE REALTY $579,950Active4 beds 2 baths1,740 sq. ft.
314 Shamrock Dr, Grass Valley, CA 95949
MLS# 225119134Listed by: RICHMOND AMERICAN HOMES OF MARYLAND, INC $669,950Active5 beds 3 baths3,050 sq. ft.
310 Shamrock Dr, Grass Valley, CA 95949
MLS# 225119103Listed by: RICHMOND AMERICAN HOMES OF MARYLAND, INC $609,950Active4 beds 3 baths2,380 sq. ft.
318 Shamrock Dr, Grass Valley, CA 95949
MLS# 225119107Listed by: RICHMOND AMERICAN HOMES OF MARYLAND, INC $159,000Active2.09 Acres
13821 Golden Lily Court, Grass Valley, CA 95945
MLS# 225115439Listed by: COLDWELL BANKER GRASS ROOTS REALTY $230,000Active2.9 Acres
0 Bitney Springs Road, Rough and Ready, CA 95975
MLS# 225113714Listed by: L.E. ORMSBY, BROKER $79,000Active4.17 Acres
10680 Success Cross Road, Nevada City, CA 95959
MLS# 225106574Listed by: RECREATION REALTY $675,000Active4 beds 2 baths2,080 sq. ft.
306 Lone Jack Court #24, Grass Valley, CA 95945
MLS# 226006181Listed by: CENTURY 21 CORNERSTONE REALTY $549,000Pending2 beds 3 baths1,890 sq. ft.
133 Brunswick Road, Grass Valley, CA 95945
MLS# 225109368Listed by: CENTURY 21 SELECT REAL ESTATE, INC. $499,000Pending4 beds 2 baths1,850 sq. ft.
302 S Auburn Street, Grass Valley, CA 95945
MLS# 225102235Listed by: CENTURY 21 CORNERSTONE REALTY $129,000Active35.91 Acres
17721 Knoll Top Drive, Grass Valley, CA 95945
MLS# 226033858Listed by: SUNNYHILL REALTY $450,000Active5.44 Acres
262 W Olympia Drive, Grass Valley, CA 95945
MLS# 225088927Listed by: MITCHELL REAL ESTATE $1,700,000Active3 beds 3 baths2,310 sq. ft.
10978 Squirrel Creek, Grass Valley, CA 95945
MLS# 225087033Listed by: EXP REALTY OF CALIFORNIA INC. $60,000Active4.25 Acres
16297 Dog Bar Road, Grass Valley, CA 95949
MLS# 225086863Listed by: COLDWELL BANKER GRASS ROOTS REALTY $190,000Active0 Acres
11780 W Brookview, Grass Valley, CA 94545
MLS# OC25083515Listed by: NEWPORT PACIFIC CAPITAL CO. $400,000Pending3 beds 2 baths1,217 sq. ft.
12189 Sunset Avenue, Grass Valley, CA 95945
MLS# ML81997792Listed by: DREAM HOUSE REALTY $1,237,500Active135.09 Acres
0 Cedar Ridge Drive, Grass Valley, CA 95945
MLS# 225010238Listed by: CENTURY 21 CORNERSTONE REALTY $62,500Active1.92 Acres
12195 E Bennett Road, Grass Valley, CA 95945
MLS# 225010256Listed by: CENTURY 21 CORNERSTONE REALTY $295,000Active2 Acres
17871 Rollins View Drive, Grass Valley, CA 95945
MLS# 226016257Listed by: CENTURY 21 CORNERSTONE REALTY $139,500Active0.62 Acres
410 W Marshall Street, Grass Valley, CA 95945
MLS# 225004349Listed by: CENTURY 21 CORNERSTONE REALTY $1,000,000Active26.56 Acres
14652 Carman Court, Grass Valley, CA 95945
MLS# 224152580Listed by: EXP REALTY OF CALIFORNIA INC. $24,900Active0.41 Acres
348 Marshall Street, Grass Valley, CA 95945
MLS# 225053909Listed by: ERA CARLILE REALTY GROUP $289,000Active1.5 Acres
13028 Somerset Drive, Grass Valley, CA 95945
MLS# 225124853Listed by: HOLDERBEIN REAL ESTATE $87,000Active5 Acres
19344 Louis Road, Grass Valley, CA 95945
MLS# 225037641Listed by: WINDERMERE SIGNATURE PROPERTIES ROSEVILLE/GRANITE BAY $98,000Active5.24 Acres
14008 Sontag Hill Road, Grass Valley, CA 95945
MLS# 225013560Listed by: WESELY & ASSOCIATES $1,399,000Active4 beds 4 baths5,159 sq. ft.
13383 Bass Trail, Grass Valley, CA 95945
MLS# 223040162Listed by: COLDWELL BANKER GRASS ROOTS REALTY $74,900Pending1.51 Acres
12618 High Sierra Way, Grass Valley, CA 95945
MLS# 223034142Listed by: EXP REALTY OF CALIFORNIA INC.
Local realty services provided by:CENTURY 21 Sierra Properties, CENTURY 21 Kobetz Realty, CENTURY 21 Masters, CENTURY 21 Baldini Real Estate, Inc., CENTURY 21 Adams & Barnes
MetroList MLS 2026. This information is being provided by MetroList MLS. All measurements and calculations of area are approximate. Information provided by Seller/Other sources, not verified by Broker. All interested persons should independently verify accuracy of information. Provided properties may or may not be listed by the office/agent presenting the information. Data Updated: July 27, 2026. Information being provided is for consumers' personal, non-commercial use and may not be used for any purpose other than to identify prospective properties consumers may be interested in purchasing. Information deemed reliable but not guaranteed. Any offer of compensation is made only to Participants of MLS where the subject listing is filed and in accordance with such MLS's regulations or rules. MFMLS Member Broker: Jesse Gibbs
The information being provided by Bay Area Real Estate Information Service is for the consumer's personal, non-commercial use and may not be used for any purpose other than to identify prospective properties consumer may be interested in purchasing. Any information relating to real estate for sale referenced on this web site comes from the Internet Data Exchange (IDX) program of the Bay Area Real Estate Information Service. CENTURY 21 Kobetz Realty is not a Multiple Listing Service (MLS), nor does it offer MLS access. This website is a service of CENTURY 21 Kobetz Realty, a broker participant of Bay Area Real Estate Information Service. This web site may reference real estate listing(s) held by a brokerage firm other than the broker and/or agent who owns this web site.
The accuracy of all information, regardless of source, including but not limited to open house information, square footages and lot sizes, is deemed reliable but not guaranteed and should be personally verified through personal inspection by and/or with the appropriate professionals. The data contained herein is copyrighted by Bay Area Real Estate Information Service and is protected by all applicable copyright laws. Any unauthorized dissemination of this information is in violation of copyright laws and is strictly prohibited.
Properties in listings may have been sold or may no longer be available.
Copyright 2026 Bay Area Real Estate Information Service. All rights reserved.
This information is deemed reliable but not guaranteed. You should rely on this information only to decide whether or not to further investigate a particular property. BEFORE MAKING ANY OTHER DECISION, YOU SHOULD PERSONALLY INVESTIGATE THE FACTS (e.g. square footage and lot size) with the assistance of an appropriate professional. You may use this information only to identify properties you may be interested in investigating further. All uses except for personal, non-commercial use in accordance with the foregoing purpose are prohibited. Redistribution or copying of this information, any photographs or video tours is strictly prohibited. This information is derived from the Internet Data Exchange (IDX) service provided by San Diego MLS®. Displayed property listings may be held by a brokerage firm other than the broker and/or agent responsible for this display. The information and any photographs and video tours and the compilation from which they are derived is protected by copyright. Compilation © 2020 San Diego MLS®, Inc. SANDICOR Member Broker: Randy Thompson
The information being provided by San Francisco Association of REALTORS is for the consumer's personal, non-commercial use and may not be used for any purpose other than to identify prospective properties consumer may be interested in purchasing. Any information relating to real estate for sale referenced on this web site comes from the Internet Data Exchange (IDX) program of the San Francisco Association of REALTORS. This web site may reference real estate listing(s) held by a brokerage firm other than the broker and/or agent who owns this web site. The accuracy of all information, regardless of source, including but not limited to open house information, square footages and lot sizes, is deemed reliable but not guaranteed and should be personally verified through personal inspection by and/or with the appropriate professionals. The data contained herein is copyrighted by San Francisco Association of REALTORS and is protected by all applicable copyright laws. Any unauthorized dissemination of this information is in violation of copyright laws and is strictly prohibited.
The information being provided by California Regional MLS (Southern California) is for the consumer's personal, non-commercial use and may not be used for any purpose other than to identify prospective properties consumer may be interested in purchasing. Any information relating to real estate for sale referenced on this web site comes from the Internet Data Exchange (IDX) program of the California Regional MLS (Southern California). CENTURY 21 Adams & Barnes is not a Multiple Listing Service (MLS), nor does it offer MLS access. This website is a service of CENTURY 21 Adams & Barnes, a broker participant of California Regional MLS (Southern California). This web site may reference real estate listing(s) held by a brokerage firm other than the broker and/or agent who owns this web site.
The accuracy of all information, regardless of source, including but not limited to open house information, square footages and lot sizes, is deemed reliable but not guaranteed and should be personally verified through personal inspection by and/or with the appropriate professionals. The data contained herein is copyrighted by California Regional MLS (Southern California) and is protected by all applicable copyright laws. Any unauthorized dissemination of this information is in violation of copyright laws and is strictly prohibited.
Copyright 2021 California Regional MLS (Southern California). All rights reserved. CRMLS Member Broker: Thomas Adams
Popular searches near 95945
Popular neighborhoods near 95945
- Alta Sierra Estates, Grass Valley homes for sale
- Auburn Lake Trails, Cool homes for sale
- Auburn Valley Golf Club, Auburn homes for sale
- Donner Summit, Soda Springs homes for sale
- Foskett Ranch, Lincoln homes for sale
- Graystone, Loomis homes for sale
- Highland Park, Roseville homes for sale
- Lincoln Crossing, Lincoln homes for sale
- Los Lagos, Granite Bay homes for sale
- Rocklin Highlands, Rocklin homes for sale
- Stanford Ranch, Rocklin homes for sale
- Sun City Lincoln Hills, Lincoln homes for sale
- Sunset West, Rocklin homes for sale
- Sunset Whitney, Rocklin homes for sale
- Swansboro Country, Placerville homes for sale
- Twelve Bridges, Lincoln homes for sale
- Verdera Village, Lincoln homes for sale
- Whitney Oaks, Rocklin homes for sale
- Whitney Ranch, Rocklin homes for sale
- Winchester Country Club, Meadow Vista homes for sale
Counties near Grass Valley, 95945
- Alpine County homes for sale
- Amador County homes for sale
- Butte County homes for sale
- Calaveras County homes for sale
- Carson City County homes for sale
- Colusa County homes for sale
- Douglas County homes for sale
- El Dorado County homes for sale
- Glenn County homes for sale
- Napa County homes for sale
- Nevada County homes for sale
- Placer County homes for sale
- Plumas County homes for sale
- Sacramento County homes for sale
- Sierra County homes for sale
- Solano County homes for sale
- Storey County homes for sale
- Sutter County homes for sale
- Yolo County homes for sale
- Yuba County homes for sale
Protect your home and budget from life's surprises with an Assurant Home Warranty, backed by a partner that supports you through every step of homeownership. Explore Plans.
©2026 Century 21 Real Estate LLC. All rights reserved. CENTURY 21®, the CENTURY 21 Logo and C21® are service marks owned by Century 21 Real Estate LLC. Century 21 Real Estate LLC fully supports the principles of the Fair Housing Act and the Equal Opportunity Act. Each office is independently owned and operated. Listing information is deemed reliable but not guaranteed accurate.