- Alta Sierra Estates, Grass Valley homes for sale
- Auburn Lake Trails, Cool homes for sale
- Auburn Valley Golf Club, Auburn homes for sale
- Blue Oaks, Roseville homes for sale
- Forestwood Estates, Yuba City homes for sale
- Foskett Ranch, Lincoln homes for sale
- Graystone, Loomis homes for sale
- Lincoln Crossing, Lincoln homes for sale
- Los Lagos, Granite Bay homes for sale
- Rocklin Highlands, Rocklin homes for sale
- Stanford, Roseville homes for sale
- Stanford Ranch, Rocklin homes for sale
- Sun City Lincoln Hills, Lincoln homes for sale
- Sunset West, Rocklin homes for sale
- Sunset Whitney, Rocklin homes for sale
- Twelve Bridges, Lincoln homes for sale
- Verdera Village, Lincoln homes for sale
- Whitney Oaks, Rocklin homes for sale
- Whitney Ranch, Rocklin homes for sale
- Winchester Country Club, Meadow Vista homes for sale
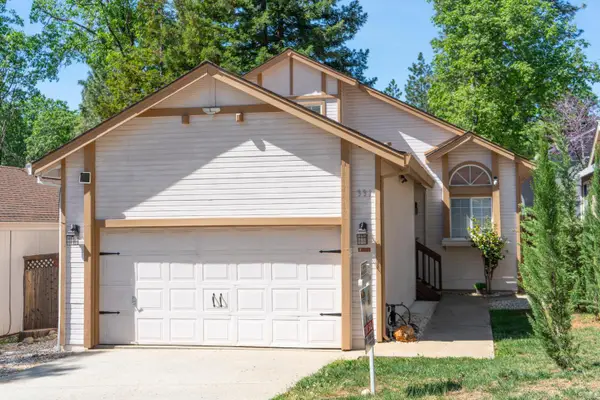
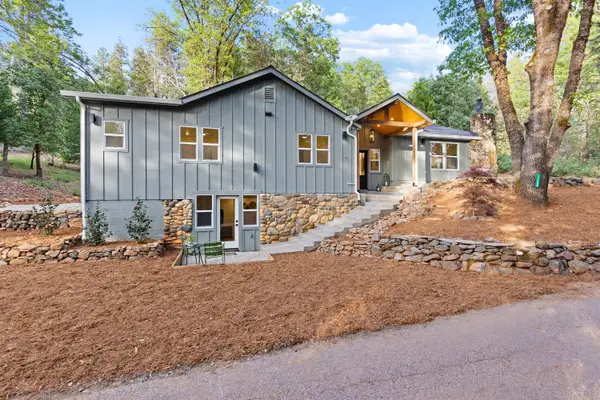
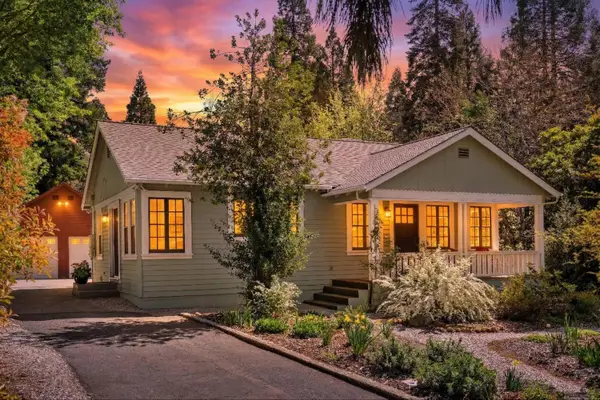
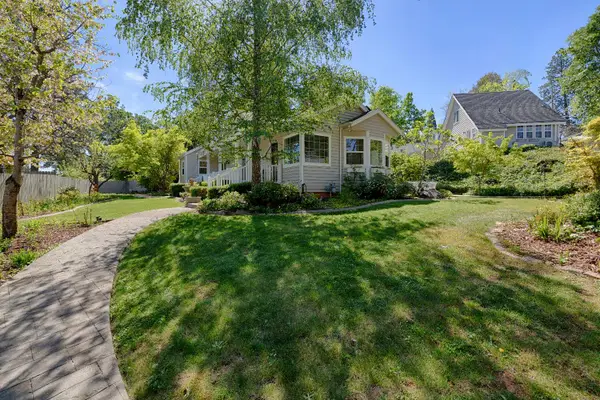
Grass Valley, CA - homes for sale
93 of 93 results displayed
- New
 $599,000Active3 beds 3 baths1,549 sq. ft.
331 Horizon Circle, Grass Valley, CA 95945
MLS# 226031432Listed by: CALI-LINK REALTY & MORTGAGE INC. - New
 $735,000Active3 beds 2 baths1,907 sq. ft.
11000 Bubbling Wells Road, Grass Valley, CA 95945
MLS# 226036764Listed by: GOLD GROUP REALTY - New
 $549,950Active2 beds 1 baths936 sq. ft.
10041 Greenwood Road, Grass Valley, CA 95945
MLS# 226035530Listed by: REAL BROKER - New
 $535,000Active2 beds 2 baths1,180 sq. ft.
157 Apple Avenue, Grass Valley, CA 95945
MLS# 226004500Listed by: INTERO REAL ESTATE SERVICES - New
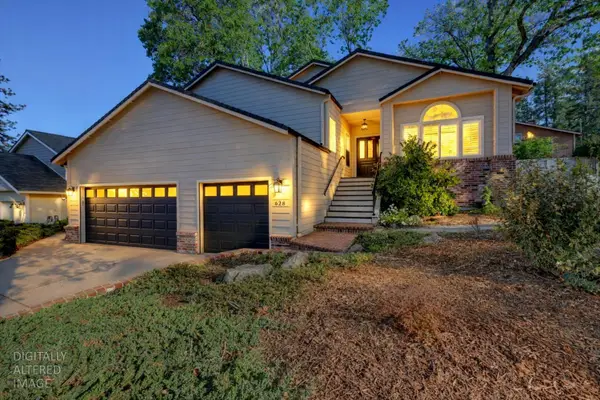 $675,000Active3 beds 3 baths2,302 sq. ft.
628 Morgan Ranch Drive, Grass Valley, CA 95945
MLS# 226035029Listed by: RE/MAX GOLD - New
 $485,000Active3 beds 2 baths1,470 sq. ft.
11782 Brunswick Pines Road, Grass Valley, CA 95945
MLS# 226036855Listed by: MITCHELL REAL ESTATE - New
 $449,000Active3 beds 1 baths1,425 sq. ft.
11896 Nancy Ln, Grass Valley, CA 95945
MLS# 41128532Listed by: KELLER WILLIAMS TRI-VALLEY - New
 $529,000Active3 beds 2 baths1,739 sq. ft.
240 Cornwall Avenue, Grass Valley, CA 95945
MLS# 225152870Listed by: COMPASS - New
 $99,000Active2.46 Acres
0 Pleasant St., Grass Valley, CA 95945
MLS# 226035306Listed by: EXP REALTY OF NORTHERN CALIFORNIA, INC. - New
 $53,000Active0.14 Acres
0 Eureka Street, Grass Valley, CA 95945
MLS# 226036256Listed by: CENTURY 21 CORNERSTONE REALTY - New
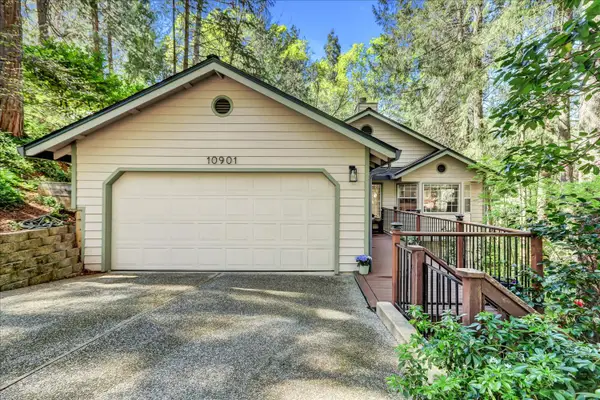 $579,000Active3 beds 2 baths1,706 sq. ft.
10901 Footwall Drive, Grass Valley, CA 95945
MLS# 226034022Listed by: RE/MAX GOLD - New
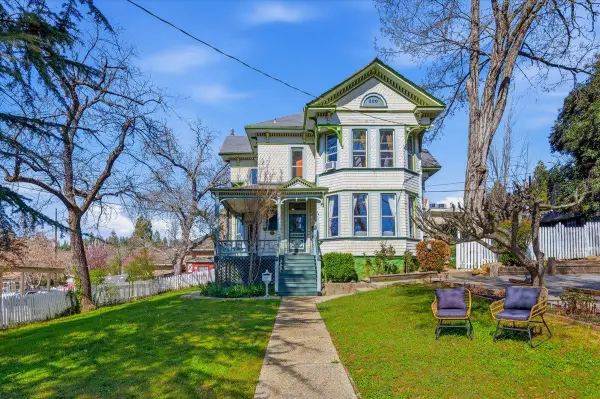 $999,000Active6 beds 6 baths2,595 sq. ft.
220 Colfax Avenue, Grass Valley, CA 95945
MLS# 226027967Listed by: CENTURY 21 CORNERSTONE REALTY - New
 $325,000Active2 beds 2 baths1,176 sq. ft.
111 Solar Drive, Grass Valley, CA 95945
MLS# 225150415Listed by: CHRISTIE'S INTERNATIONAL REAL ESTATE SERENO  $799,000Pending3 beds 3 baths2,504 sq. ft.
13936 Downwind Ct, Grass Valley, CA 95945
MLS# 226012488Listed by: HOMESMART ICARE REALTY $849,000Active-- beds -- baths2,175 sq. ft.
265 Cornwall Avenue, Grass Valley, CA 95945
MLS# 226032681Listed by: DISCOVERY PROPERTY GROUP, INC. $749,500Pending3 beds 3 baths2,913 sq. ft.
350 Miners Trail, Grass Valley, CA 95945
MLS# 226017847Listed by: CENTURY 21 CORNERSTONE REALTY $649,000Active3 beds 4 baths2,011 sq. ft.
132 Picadilly Lane, Grass Valley, CA 95949
MLS# 226029956Listed by: RE/MAX GOLD $725,000Active3 beds 2 baths2,120 sq. ft.
226 Ryans Lane, Grass Valley, CA 95945
MLS# 226024877Listed by: CENTURY 21 CORNERSTONE REALTY $545,000Pending3 beds 2 baths1,517 sq. ft.
195 Cypress Hill Drive, Grass Valley, CA 95945
MLS# 226027215Listed by: COLDWELL BANKER GRASS ROOTS REALTY $225,000Pending3 beds 2 baths1,574 sq. ft.
10662 Dolores Drive, Grass Valley, CA 95945
MLS# 226028424Listed by: RE/MAX GOLD $555,000Active2 beds 2 baths1,593 sq. ft.
225 Mallard Drive, Grass Valley, CA 95945
MLS# 226021964Listed by: COLDWELL BANKER GRASS ROOTS REALTY $510,000Active3 beds 2 baths1,538 sq. ft.
111 Muir Court, Grass Valley, CA 95945
MLS# 226022162Listed by: RE/MAX GOLD $849,000Active4 beds 4 baths2,175 sq. ft.
265 Cornwall Avenue #2, Grass Valley, CA 95945
MLS# 226022705Listed by: DISCOVERY PROPERTY GROUP, INC. $988,000Active3 beds 3 baths3,200 sq. ft.
12540 Beaver Drive, Grass Valley, CA 95945
MLS# 226017118Listed by: RE/MAX GOLD $649,000Pending5 beds 4 baths2,751 sq. ft.
549 Glenwood Road, Grass Valley, CA 95945
MLS# 226023802Listed by: COLDWELL BANKER GRASS ROOTS REALTY $479,000Pending3 beds 2 baths1,848 sq. ft.
14017 Lague Lane, Grass Valley, CA 95949
MLS# 226022116Listed by: CENTURY 21 CORNERSTONE REALTY $580,000Active3 beds 3 baths1,716 sq. ft.
12930 Ridge Road, Grass Valley, CA 95945
MLS# 226018819Listed by: WINDERMERE SIGNATURE PROPERTIES SIERRA OAKS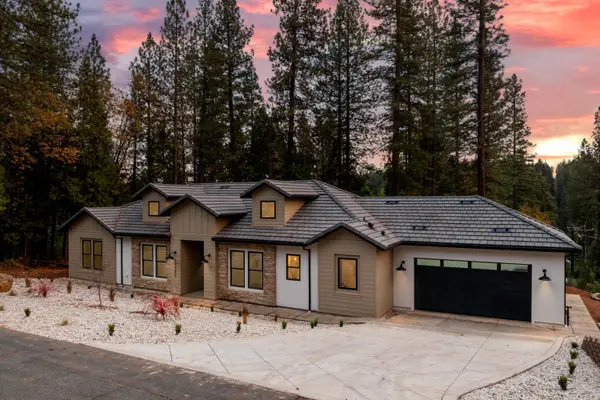 $899,000Pending4 beds 3 baths2,386 sq. ft.
12489 New Brunswick Court, Grass Valley, CA 95945
MLS# 226018207Listed by: USKO REALTY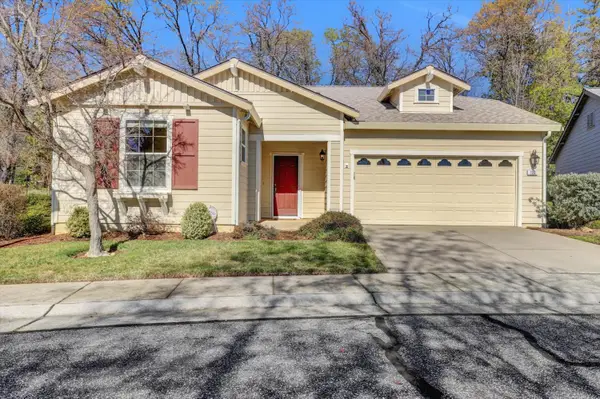 $579,000Active2 beds 2 baths1,593 sq. ft.
120 Starling Circle, Grass Valley, CA 95945
MLS# 226001314Listed by: RE/MAX GOLD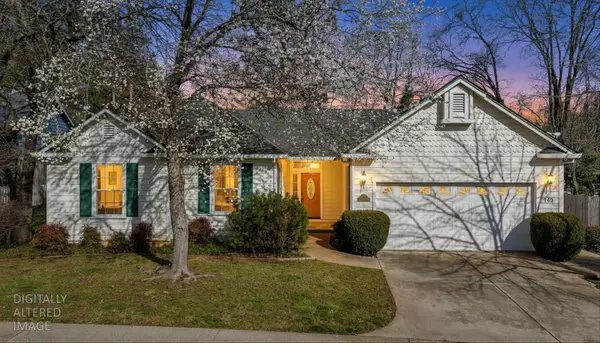 $575,000Active3 beds 2 baths1,880 sq. ft.
143 Scotia Pines Circle, Grass Valley, CA 95945
MLS# 226017401Listed by: COLDWELL BANKER GRASS ROOTS REALTY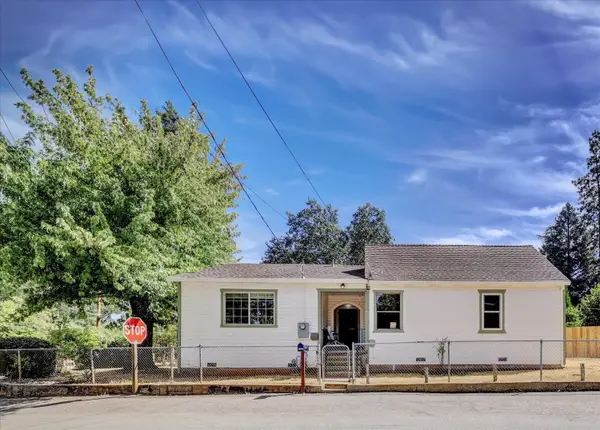 $435,000Active3 beds 2 baths1,631 sq. ft.
13207 Ridge Road, Grass Valley, CA 95945
MLS# 226014838Listed by: RE/MAX GOLD $657,045Pending4 beds 3 baths2,380 sq. ft.
132 Pascoe Way, Grass Valley, CA 95949
MLS# 226014857Listed by: RICHMOND AMERICAN HOMES OF MARYLAND, INC $1,339,000Active4 beds 4 baths3,672 sq. ft.
12933 Elk Lane, Grass Valley, CA 95945
MLS# 226013334Listed by: RE/MAX GOLD $125,000Pending4.39 Acres
13050 Brookview Drive Circle, Grass Valley, CA 95945
MLS# 226012049Listed by: REALTY ONE GROUP COMPLETE $449,000Active2 beds 1 baths1,150 sq. ft.
11070 Brunswick, Grass Valley, CA 95945
MLS# 226012524Listed by: RE/MAX GOLD $132,000Active3 beds 2 baths1,188 sq. ft.
987 Pampas Drive, Grass Valley, CA 95945
MLS# 226010511Listed by: RE/MAX GOLD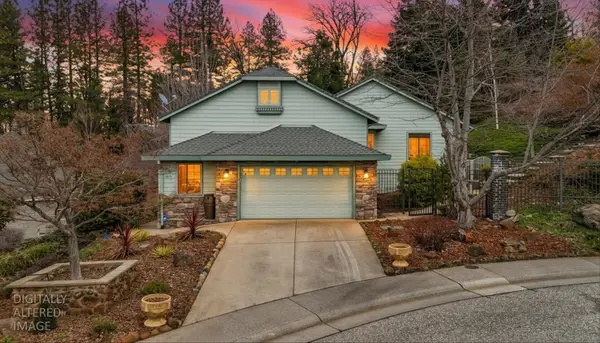 $659,900Active3 beds 3 baths2,204 sq. ft.
124 Ruby Ledge Court, Grass Valley, CA 95945
MLS# 226006104Listed by: CENTURY 21 CORNERSTONE REALTY $49,900Pending2 beds 2 baths1,344 sq. ft.
30 Candy Lane, Grass Valley, CA 95945
MLS# 226005260Listed by: SHOWCASE REAL ESTATE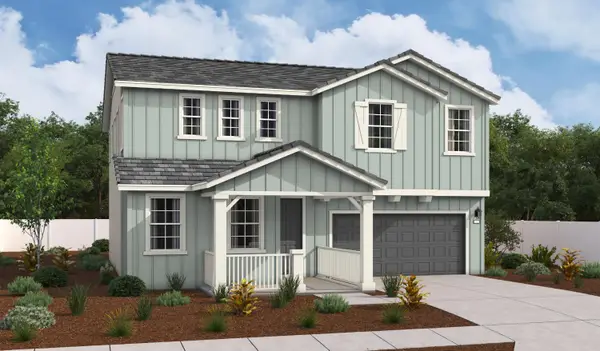 $659,950Active4 beds 3 baths2,680 sq. ft.
235 Shamrock Dr, Grass Valley, CA 95945
MLS# 226002615Listed by: RICHMOND AMERICAN HOMES OF MARYLAND, INC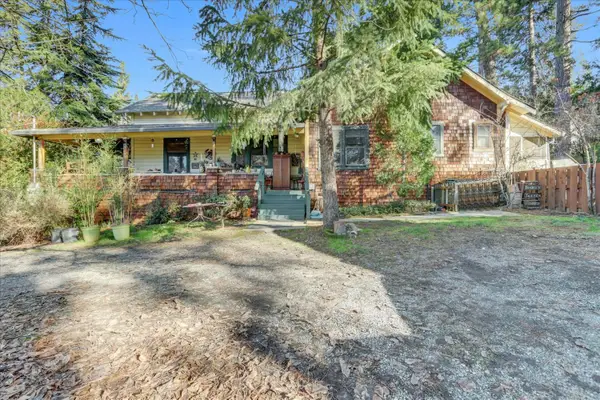 $700,000Active3 beds 1 baths1,737 sq. ft.
203 Race Street, Grass Valley, CA 95945
MLS# 225154210Listed by: EXP REALTY OF CALIFORNIA INC.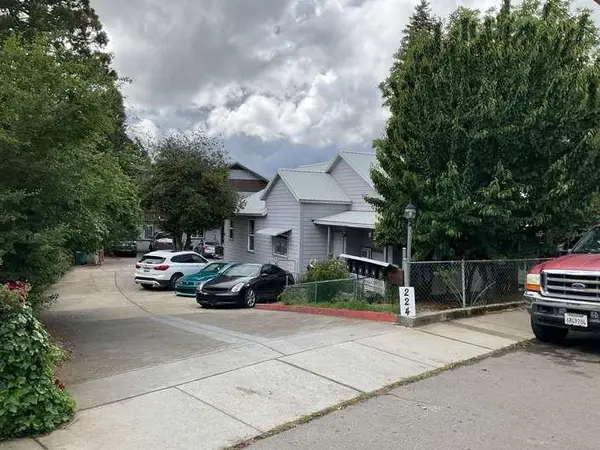 $1,050,000Active-- beds -- baths4,663 sq. ft.
224 Bennett Street, Grass Valley, CA 95945
MLS# 226001813Listed by: RE/MAX GOLD $90,000Active2 beds 1 baths800 sq. ft.
65 Primrose Lane, Grass Valley, CA 95945
MLS# 226004217Listed by: RE/MAX GOLD $485,000Active2 beds 2 baths1,458 sq. ft.
115 Starling Circle, Grass Valley, CA 95945
MLS# 225149887Listed by: COLDWELL BANKER GRASS ROOTS REALTY $399,000Pending3 beds 2 baths1,255 sq. ft.
11195 Alpine Lane, Grass Valley, CA 95945
MLS# 225153042Listed by: CHRISTIE'S INTERNATIONAL REAL ESTATE SERENO $125,000Active3 beds 2 baths1,560 sq. ft.
17 Juan Way, Grass Valley, CA 95945
MLS# 225129292Listed by: KELLER WILLIAMS REALTY GOLD COUNTRY $550,000Pending1 beds 2 baths1,387 sq. ft.
12555 Colfax Highway, Grass Valley, CA 95945
MLS# 225151046Listed by: RE/MAX GOLD $535,000Active3 beds 2 baths1,596 sq. ft.
322 Mill Street, Grass Valley, CA 95945
MLS# 225144735Listed by: NICK SADEK SOTHEBY'S INTERNATIONAL REALTY $350,000Active1 beds 1 baths687 sq. ft.
800 Freeman Lane #207, Grass Valley, CA 95949
MLS# 225146367Listed by: RE/MAX GOLD $525,000Active2 beds 2 baths1,358 sq. ft.
124 Starling Circle, Grass Valley, CA 95945
MLS# 226012300Listed by: CENTURY 21 CORNERSTONE REALTY $265,000Pending3 beds 2 baths1,260 sq. ft.
10819 Gold Hill Drive, Grass Valley, CA 95945
MLS# 225145377Listed by: RUBIO REAL ESTATE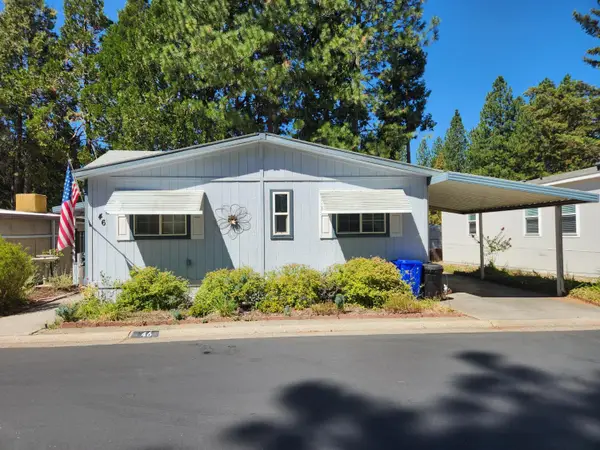 $170,000Active3 beds 2 baths1,440 sq. ft.
46 Wendy Circle, Grass Valley, CA 95945
MLS# 225107994Listed by: KELLER WILLIAMS REALTY GOLD COUNTRY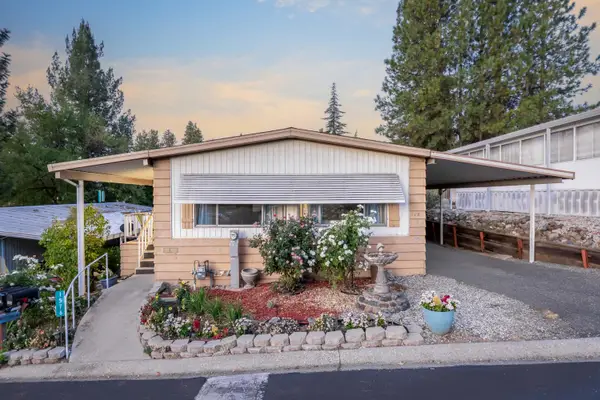 $85,000Active2 beds 2 baths1,440 sq. ft.
1576 Mulberry Drive, Grass Valley, CA 95945
MLS# 225117639Listed by: CENTURY 21 CORNERSTONE REALTY $2,100,000Active3 beds 3 baths4,524 sq. ft.
11966 Logans Run Court, Grass Valley, CA 95945
MLS# 225140979Listed by: COLDWELL BANKER GRASS ROOTS REALTY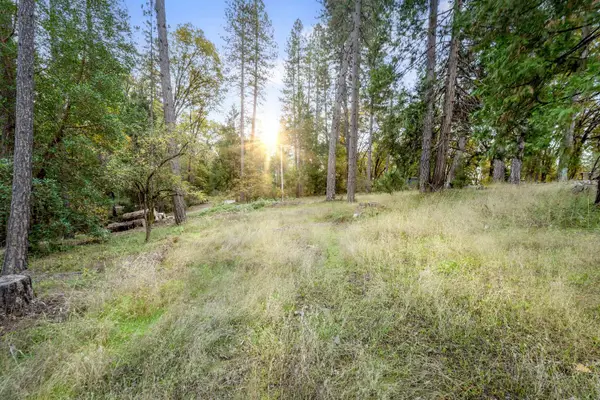 $135,000Active3.46 Acres
10376 Smith Road, Grass Valley, CA 95949
MLS# 225140958Listed by: WESELY & ASSOCIATES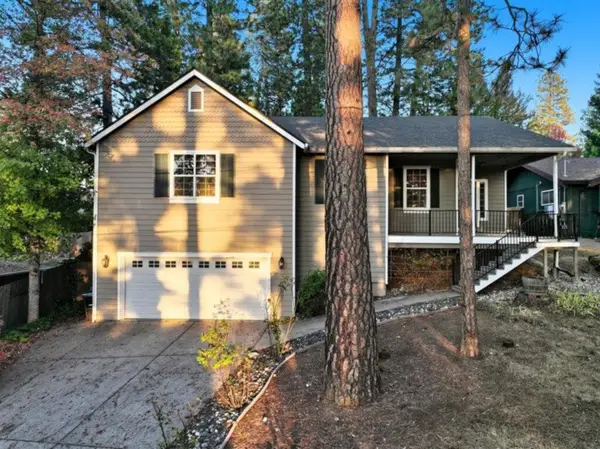 $599,900Pending3 beds 2 baths1,619 sq. ft.
575 Kate Hayes Street, Grass Valley, CA 95945
MLS# 225138431Listed by: CENTURY 21 SELECT REAL ESTATE, INC. $636,950Active4 beds 3 baths2,380 sq. ft.
311 Shamrock Dr, Grass Valley, CA 95949
MLS# 225137456Listed by: RICHMOND AMERICAN HOMES OF MARYLAND, INC $259,000Pending2 beds 2 baths1,253 sq. ft.
129 Rockwood Drive, Grass Valley, CA 95945
MLS# 225135588Listed by: COLDWELL BANKER GRASS ROOTS REALTY $549,000Active3 beds 3 baths1,486 sq. ft.
210 Elysian Place, Grass Valley, CA 95945
MLS# 225132345Listed by: COLDWELL BANKER GRASS ROOTS REALTY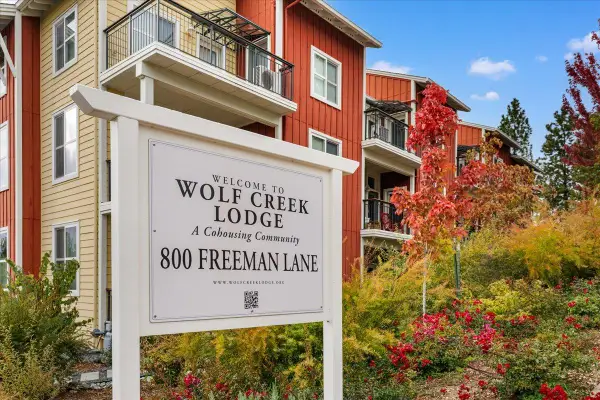 $350,000Active1 beds 1 baths630 sq. ft.
800 Freeman Lane #105, Grass Valley, CA 95949
MLS# 225134998Listed by: RE/MAX GOLD $595,000Active3 beds 3 baths2,121 sq. ft.
518 Walsh Street, Grass Valley, CA 95945
MLS# 225133404Listed by: EXP REALTY OF CALIFORNIA INC. $839,000Active4 beds 3 baths3,297 sq. ft.
12401 Old Mine Road, Grass Valley, CA 95945
MLS# 225131966Listed by: COLDWELL BANKER COMMERCIAL GRASS ROOTS REALTY $570,000Active3 beds 2 baths1,992 sq. ft.
607 Cold Spring Court, Grass Valley, CA 95945
MLS# 225122724Listed by: CENTURY 21 CORNERSTONE REALTY $570,000Pending3 beds 2 baths1,992 sq. ft.
506 Liberty Court, Grass Valley, CA 95945
MLS# 225128176Listed by: CENTURY 21 CORNERSTONE REALTY $35,000Pending0.13 Acres
11684 Sunrise Lane, Grass Valley, CA 95945
MLS# 225128669Listed by: EXP REALTY OF NORTHERN CALIFORNIA, INC. $2,750,000Active-- beds -- baths
10530 Walker, Grass Valley, CA 95945
MLS# 225125423Listed by: TWO FEATHERS REALTY $680,000Active4 beds 4 baths2,408 sq. ft.
245 Cornwall Avenue, Grass Valley, CA 95945
MLS# 225117946Listed by: COLDWELL BANKER GRASS ROOTS REALTY $589,950Active4 beds 2 baths1,740 sq. ft.
314 Shamrock Dr, Grass Valley, CA 95949
MLS# 225119134Listed by: RICHMOND AMERICAN HOMES OF MARYLAND, INC $668,343Pending5 beds 3 baths3,050 sq. ft.
222 Shamrock Dr, Grass Valley, CA 95949
MLS# 225119075Listed by: RICHMOND AMERICAN HOMES OF MARYLAND, INC $682,433Active5 beds 3 baths3,050 sq. ft.
310 Shamrock Dr, Grass Valley, CA 95949
MLS# 225119103Listed by: RICHMOND AMERICAN HOMES OF MARYLAND, INC $609,950Active4 beds 3 baths2,380 sq. ft.
318 Shamrock Dr, Grass Valley, CA 95949
MLS# 225119107Listed by: RICHMOND AMERICAN HOMES OF MARYLAND, INC $653,045Pending4 beds 3 baths2,380 sq. ft.
315 Shamrock Dr, Grass Valley, CA 95949
MLS# 225119116Listed by: RICHMOND AMERICAN HOMES OF MARYLAND, INC $449,000Pending3 beds 2 baths1,308 sq. ft.
153 Arcadia Drive, Grass Valley, CA 95945
MLS# 225117180Listed by: CENTURY 21 CORNERSTONE REALTY $159,000Active2.09 Acres
13821 Golden Lily Court, Grass Valley, CA 95945
MLS# 225115439Listed by: COLDWELL BANKER GRASS ROOTS REALTY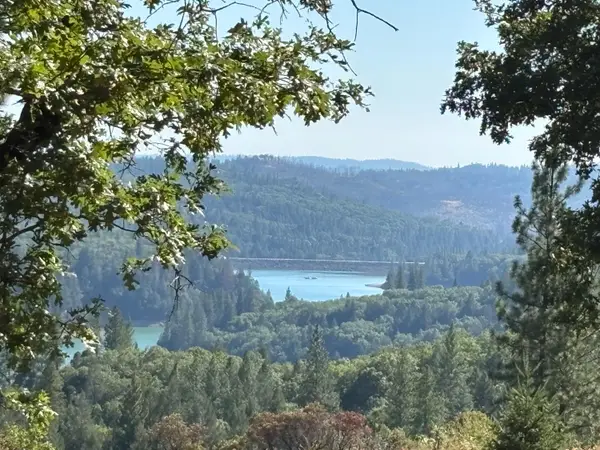 $1,050,000Active120 Acres
0 Old Donner Trl, Grass Valley, CA 95945
MLS# 225093727Listed by: WESELY & ASSOCIATES $687,000Active4 beds 2 baths2,080 sq. ft.
306 Lone Jack Court #24, Grass Valley, CA 95945
MLS# 226006181Listed by: CENTURY 21 CORNERSTONE REALTY $549,000Pending2 beds 3 baths1,890 sq. ft.
133 Brunswick Road, Grass Valley, CA 95945
MLS# 225109368Listed by: CENTURY 21 SELECT REAL ESTATE, INC. $499,000Pending4 beds 2 baths1,850 sq. ft.
302 S Auburn Street, Grass Valley, CA 95945
MLS# 225102235Listed by: CENTURY 21 CORNERSTONE REALTY $585,000Active3 beds 2 baths1,789 sq. ft.
14207 Tim Burr Lane, Grass Valley, CA 95945
MLS# 225092746Listed by: RECREATION REALTY $450,000Active5.44 Acres
262 W Olympia Drive, Grass Valley, CA 95945
MLS# 225088927Listed by: MITCHELL REAL ESTATE $1,700,000Active3 beds 3 baths2,310 sq. ft.
10978 Squirrel Creek, Grass Valley, CA 95945
MLS# 225087033Listed by: EXP REALTY OF CALIFORNIA INC. $1,675,000Pending-- beds -- baths4,220 sq. ft.
626 S Auburn Street, Grass Valley, CA 95945
MLS# 225084142Listed by: BERKSHIRE HATHAWAY HOME SERVICES NORCAL REAL ESTATE $475,000Pending4.92 Acres
295 River Otter Way, Grass Valley, CA 95949
MLS# 225068969Listed by: COLDWELL BANKER GRASS ROOTS REALTY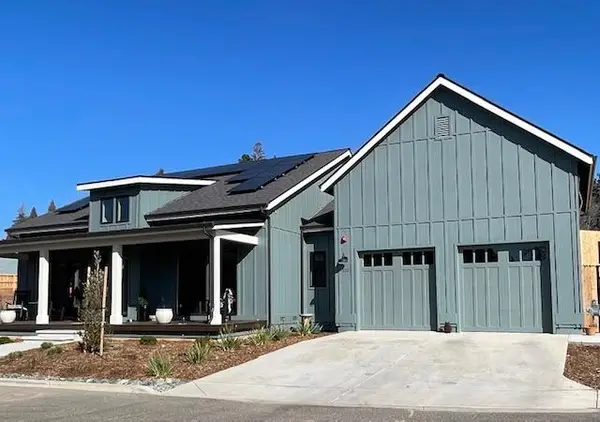 $775,000Active3 beds 2 baths1,802 sq. ft.
112 Ben Taylor Crossing, Grass Valley, CA 95945
MLS# 224131197Listed by: LANDMARK PROPERTIES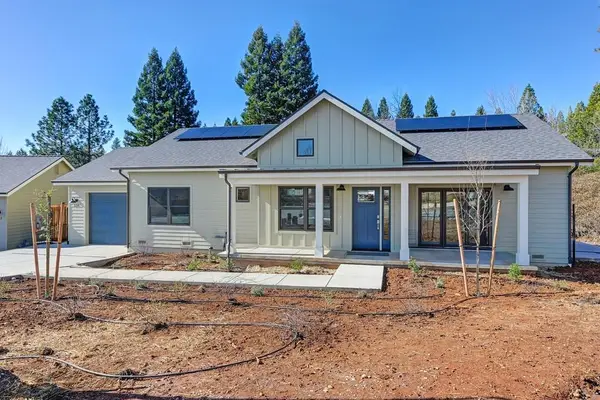 $695,000Active2 beds 2 baths1,505 sq. ft.
118 Ben Taylor Crossing, Grass Valley, CA 95945
MLS# 225007145Listed by: LANDMARK PROPERTIES $865,000Active3 beds 2 baths1,894 sq. ft.
124 Ben Taylor Crossing, Grass Valley, CA 95945
MLS# 225007164Listed by: LANDMARK PROPERTIES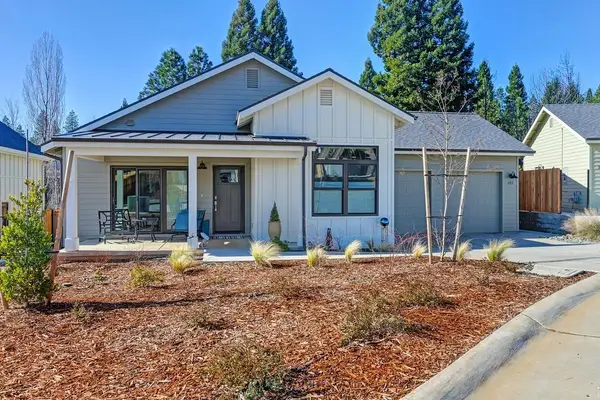 $865,000Active3 beds 2 baths1,980 sq. ft.
132 Ben Taylor Crossing, Grass Valley, CA 95945
MLS# 225007166Listed by: LANDMARK PROPERTIES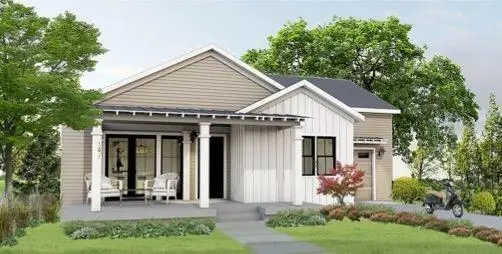 $695,000Active2 beds 2 baths1,500 sq. ft.
212 Barker Lane, Grass Valley, CA 95945
MLS# 225007182Listed by: LANDMARK PROPERTIES $1,237,500Active135.09 Acres
0 Cedar Ridge Drive, Grass Valley, CA 95945
MLS# 225010238Listed by: CENTURY 21 CORNERSTONE REALTY $62,500Active1.92 Acres
12195 E Bennett Road, Grass Valley, CA 95945
MLS# 225010256Listed by: CENTURY 21 CORNERSTONE REALTY $139,500Active0.62 Acres
410 W Marshall Street, Grass Valley, CA 95945
MLS# 225004349Listed by: CENTURY 21 CORNERSTONE REALTY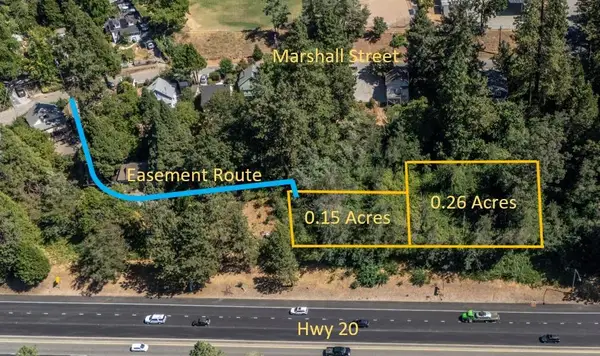 $24,900Active0.41 Acres
348 Marshall Street, Grass Valley, CA 95945
MLS# 225053909Listed by: ERA CARLILE REALTY GROUP $289,000Active1.5 Acres
13028 Somerset Drive, Grass Valley, CA 95945
MLS# 225124853Listed by: HOLDERBEIN REAL ESTATE $475,000Active1.5 Acres
12968 Somerset Drive, Grass Valley, CA 95945
MLS# 224043222Listed by: COLDWELL BANKER GRASS ROOTS REALTY
Local realty services provided by:CENTURY 21 Select Real Estate, Inc., CENTURY 21 Sierra Properties, CENTURY 21 Kobetz Realty, CENTURY 21 Baldini Real Estate, Inc.
MetroList MLS 2026. This information is being provided by MetroList MLS. All measurements and calculations of area are approximate. Information provided by Seller/Other sources, not verified by Broker. All interested persons should independently verify accuracy of information. Provided properties may or may not be listed by the office/agent presenting the information. Data Updated: March 28, 2026. Information being provided is for consumers' personal, non-commercial use and may not be used for any purpose other than to identify prospective properties consumers may be interested in purchasing. Information deemed reliable but not guaranteed. Any offer of compensation is made only to Participants of MLS where the subject listing is filed and in accordance with such MLS's regulations or rules.
The information being provided by Bay Area Real Estate Information Service is for the consumer's personal, non-commercial use and may not be used for any purpose other than to identify prospective properties consumer may be interested in purchasing. Any information relating to real estate for sale referenced on this web site comes from the Internet Data Exchange (IDX) program of the Bay Area Real Estate Information Service. CENTURY 21 Kobetz Realty is not a Multiple Listing Service (MLS), nor does it offer MLS access. This website is a service of CENTURY 21 Kobetz Realty, a broker participant of Bay Area Real Estate Information Service. This web site may reference real estate listing(s) held by a brokerage firm other than the broker and/or agent who owns this web site.
The accuracy of all information, regardless of source, including but not limited to open house information, square footages and lot sizes, is deemed reliable but not guaranteed and should be personally verified through personal inspection by and/or with the appropriate professionals. The data contained herein is copyrighted by Bay Area Real Estate Information Service and is protected by all applicable copyright laws. Any unauthorized dissemination of this information is in violation of copyright laws and is strictly prohibited.
Properties in listings may have been sold or may no longer be available.
Copyright 2026 Bay Area Real Estate Information Service. All rights reserved.
The information being provided by San Francisco Association of REALTORS is for the consumer's personal, non-commercial use and may not be used for any purpose other than to identify prospective properties consumer may be interested in purchasing. Any information relating to real estate for sale referenced on this web site comes from the Internet Data Exchange (IDX) program of the San Francisco Association of REALTORS. This web site may reference real estate listing(s) held by a brokerage firm other than the broker and/or agent who owns this web site. The accuracy of all information, regardless of source, including but not limited to open house information, square footages and lot sizes, is deemed reliable but not guaranteed and should be personally verified through personal inspection by and/or with the appropriate professionals. The data contained herein is copyrighted by San Francisco Association of REALTORS and is protected by all applicable copyright laws. Any unauthorized dissemination of this information is in violation of copyright laws and is strictly prohibited.
Neighborhoods near Grass Valley, CA
Zip codes near Grass Valley, CA
- 95602 homes for sale
- 95701 homes for sale
- 95703 homes for sale
- 95713 homes for sale
- 95714 homes for sale
- 95717 homes for sale
- 95722 homes for sale
- 95918 homes for sale
- 95919 homes for sale
- 95922 homes for sale
- 95925 homes for sale
- 95935 homes for sale
- 95945 homes for sale
- 95946 homes for sale
- 95949 homes for sale
- 95959 homes for sale
- 95960 homes for sale
- 95962 homes for sale
- 95975 homes for sale
- 95977 homes for sale
Popular searches near Grass Valley, CA
- Alta homes for sale
- Alta Sierra homes for sale
- Applegate homes for sale
- Browns Valley homes for sale
- Colfax homes for sale
- Colfax-Monumental Ridge homes for sale
- Dobbins homes for sale
- Dutch Flat homes for sale
- Gold Run homes for sale
- Iowa Hill homes for sale
- Lake Of The Pines homes for sale
- Lake Wildwood homes for sale
- Meadow Vista homes for sale
- Nevada City homes for sale
- North San Juan homes for sale
- North San Juan homes for sale
- Oregon House homes for sale
- Penn Valley homes for sale
- Rough And Ready homes for sale
- Smartsville homes for sale
Protect your home and budget from life's surprises with an Assurant Home Warranty, backed by a partner that supports you through every step of homeownership. Explore Plans.
©2026 Century 21 Real Estate LLC. All rights reserved. CENTURY 21®, the CENTURY 21 Logo and C21® are service marks owned by Century 21 Real Estate LLC. Century 21 Real Estate LLC fully supports the principles of the Fair Housing Act and the Equal Opportunity Act. Each office is independently owned and operated. Listing information is deemed reliable but not guaranteed accurate.