- Atlantic, Seattle homes for sale
- Brighton, Seattle homes for sale
- Columbia City, Seattle homes for sale
- Delridge, Seattle homes for sale
- Georgetown, Seattle homes for sale
- Glendale, Seattle homes for sale
- High Point, Seattle homes for sale
- Highland Park, Seattle homes for sale
- Holly Park, Seattle homes for sale
- Mid-Beacon Hill, Seattle homes for sale
- Mt. Baker, Seattle homes for sale
- Mount Baker Park, Seattle homes for sale
- North Beacon Hill, Seattle homes for sale
- North Delridge, Seattle homes for sale
- Riverview, Seattle homes for sale
- Seward Park, Seattle homes for sale
- South Beacon Hill, Seattle homes for sale
- South Delridge, Seattle homes for sale
- South Park, Seattle homes for sale
- Southeast, Seattle homes for sale
Greater Duwamish, Seattle, WA - homes for sale
9 of 9 results displayed
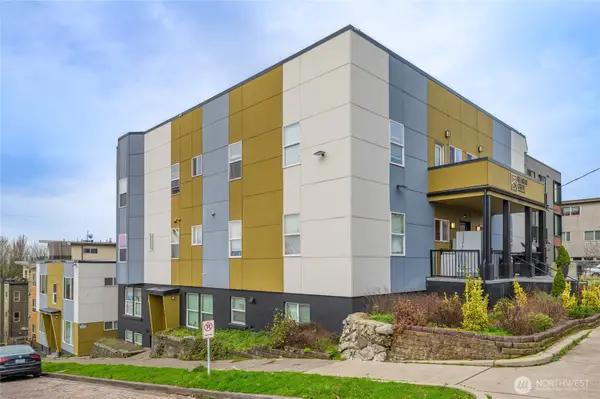
 $1,810,000Active-- beds -- baths5,140 sq. ft.
8805 14th Avenue S, Seattle, WA 98108
MLS# 2482422Listed by: TORRE REALTY
 $4,295,000Active-- beds -- baths12,117 sq. ft.
1815 13th Avenue S, Seattle, WA 98144
MLS# 2475680Listed by: LEE & ASSOCIATES COMMERCIAL RE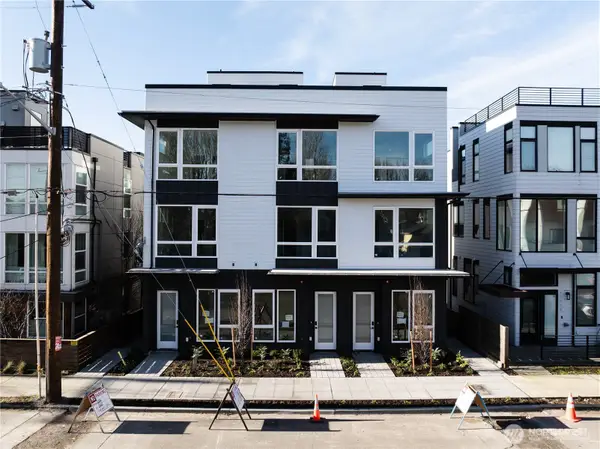 $1,550,000Active-- beds -- baths3,183 sq. ft.
6723 Carlton Avenue #A,B,C, Seattle, WA 98108
MLS# 2469377Listed by: REAL BROKER LLC $4,700,000Active-- beds -- baths9,900 sq. ft.
2350 Beacon Avenue S, Seattle, WA 98144
MLS# 2440960Listed by: URBAN COMMERCIAL PARTNERS, LLC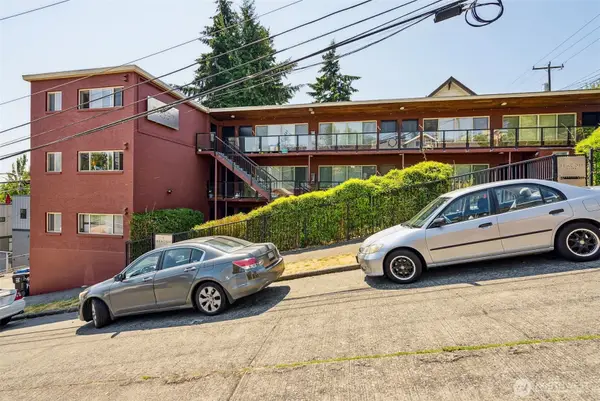 $4,500,000Active-- beds -- baths8,580 sq. ft.
1401 Holgate Street, Seattle, WA 98144
MLS# 2440780Listed by: URBAN COMMERCIAL PARTNERS, LLC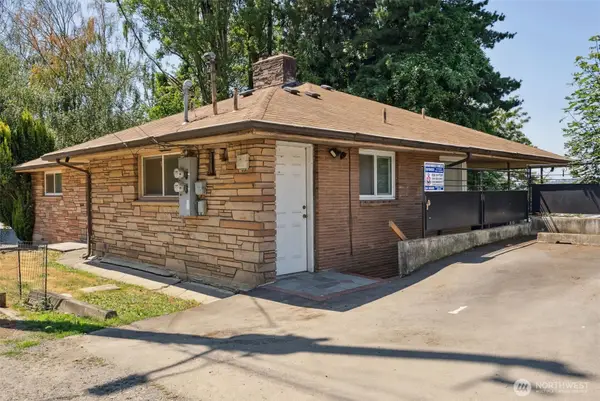 $1,295,000Active-- beds -- baths2,820 sq. ft.
1306 S Bayview Street, Seattle, WA 98144
MLS# 2439670Listed by: URBAN COMMERCIAL PARTNERS, LLC $4,900,000Active-- beds -- baths11,876 sq. ft.
2414 13th Avenue S, Seattle, WA 98144
MLS# 2439327Listed by: URBAN COMMERCIAL PARTNERS, LLC $640,000Active-- beds -- baths1,250 sq. ft.
547 S Sullivan Street, Seattle, WA 98108
MLS# 2432506Listed by: INSPIRE REALTY $999,999Active-- beds -- baths1,723 sq. ft.
1701 19th Avenue S, Seattle, WA 98144
MLS# 2486695Listed by: KW GREATER SEATTLE
Local realty services provided by:CENTURY 21 Real Estate Center
Listings courtesy of Northwest MLS as distributed by MLS GRID. Based on information submitted to the MLS GRID as of April 1, 2026. All data is obtained from various sources and may not have been verified by broker or MLS GRID. Supplied Open House Information is subject to change without notice. All information should be independently reviewed and verified for accuracy. Properties may or may not be listed by the office/agent presenting the information. Listing information is provided for consumers' personal, non-commercial use, solely to identify prospective properties for potential purchase; all other use is strictly prohibited and may violate relevant federal and state law. Information deemed reliable but not guaranteed. Copyright © 2026 MLS GRID. All Rights Reserved.
Popular neighborhoods near Greater Duwamish, Seattle, WA
Zip codes near Greater Duwamish, Seattle, WA
- 98040 homes for sale
- 98101 homes for sale
- 98102 homes for sale
- 98104 homes for sale
- 98106 homes for sale
- 98108 homes for sale
- 98109 homes for sale
- 98112 homes for sale
- 98116 homes for sale
- 98118 homes for sale
- 98121 homes for sale
- 98122 homes for sale
- 98126 homes for sale
- 98134 homes for sale
- 98136 homes for sale
- 98144 homes for sale
- 98146 homes for sale
- 98164 homes for sale
- 98168 homes for sale
- 98178 homes for sale
Counties near Greater Duwamish, Seattle, WA
- Chelan County homes for sale
- Clallam County homes for sale
- Grays Harbor County homes for sale
- Island County homes for sale
- Jefferson County homes for sale
- King County homes for sale
- Kitsap County homes for sale
- Kittitas County homes for sale
- Lewis County homes for sale
- Mason County homes for sale
- Pacific County homes for sale
- Pierce County homes for sale
- San Juan County homes for sale
- Skagit County homes for sale
- Snohomish County homes for sale
- Thurston County homes for sale
- Whatcom County homes for sale
Protect your home and budget from life's surprises with an Assurant Home Warranty, backed by a partner that supports you through every step of homeownership. Explore Plans.
©2026 Century 21 Real Estate LLC. All rights reserved. CENTURY 21®, the CENTURY 21 Logo and C21® are service marks owned by Century 21 Real Estate LLC. Century 21 Real Estate LLC fully supports the principles of the Fair Housing Act and the Equal Opportunity Act. Each office is independently owned and operated. Listing information is deemed reliable but not guaranteed accurate.