- Berlin homes for sale
- Berlin homes for sale
- Berlin Town homes for sale
- Brandon homes for sale
- Brooklyn homes for sale
- Green Lake homes for sale
- Green Lake Town homes for sale
- Markesan homes for sale
- Marquette Town homes for sale
- Marquette homes for sale
- Mecan homes for sale
- Metomen homes for sale
- Montello Town homes for sale
- Neshkoro Town homes for sale
- Princeton homes for sale
- Princeton Town homes for sale
- Ripon homes for sale
- Ripon Town homes for sale
- St Marie homes for sale
- Shields homes for sale
Green Lake County, WI - homes for sale
101 of 101 results displayed
- New
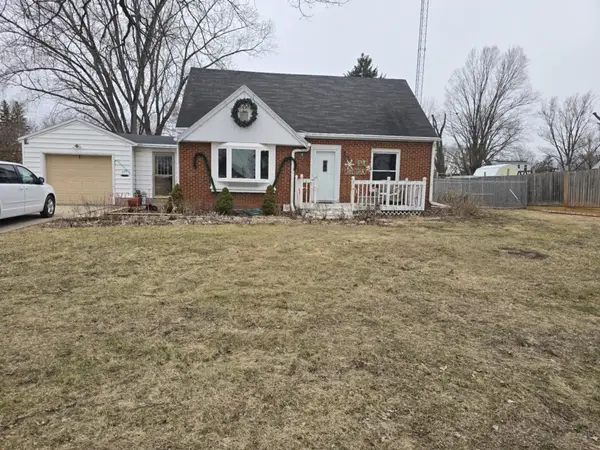 $230,000Active3 beds 2 baths1,412 sq. ft.
349 N Wisconsin Street, BERLIN, WI 54923
MLS# 50322903Listed by: BEISER REALTY, LLC - New
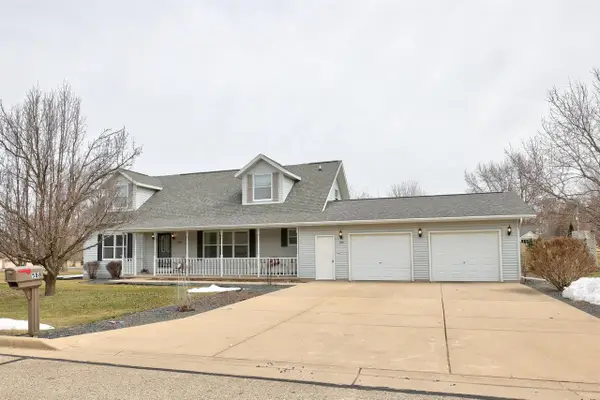 $440,000Active3 beds 3 baths2,700 sq. ft.
588 Ann Court, Berlin, WI 54923
MLS# 2019481Listed by: REIERSON REALTY, LLC - Open Sat, 12:30 to 2pmNew
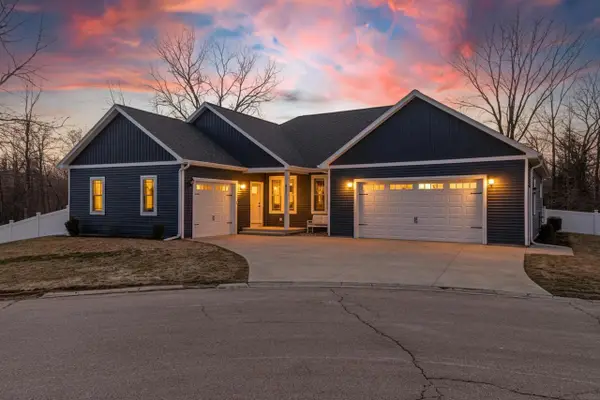 $659,900Active3 beds 2 baths1,786 sq. ft.
631 Fiddlehead Court, Green Lake, WI 54941
MLS# 2019466Listed by: BETTER HOMES AND GARDENS REAL ESTATE SPECIAL PROPERTIES - New
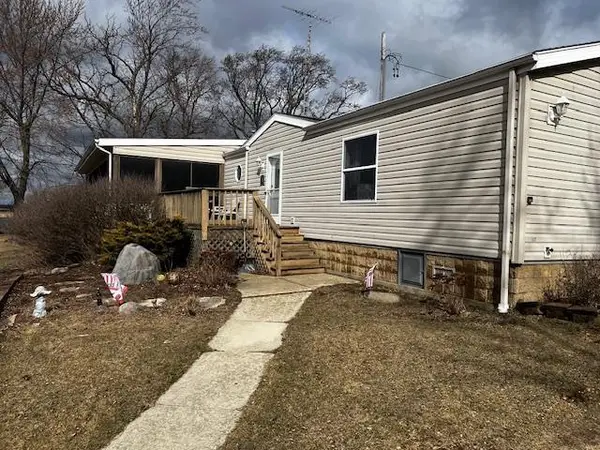
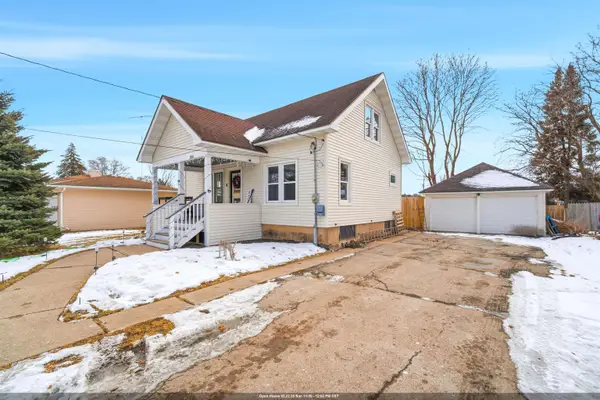
 $259,000Active3 beds 2 baths1,507 sq. ft.
118 N Johnson Street, Berlin, WI 54923
MLS# 2019456Listed by: EXP REALTY, LLC - New
 $249,900Active3 beds 2 baths1,280 sq. ft.
N5101 Lueck Lane, Princeton, WI 54968
MLS# 2019356Listed by: ADASHUN JONES REAL ESTATE  $524,900Pending4 beds 4 baths3,090 sq. ft.
N1640 County Road U, Markesan, WI 53946
MLS# 2019353Listed by: UNITED COUNTRY MIDWEST LIFESTYLE PROPERTIES- New
 $499,000Active2 beds 1 baths1,040 sq. ft.
W6182 Lakeview Drive, Markesan, WI 53946
MLS# 2019326Listed by: EMMER REAL ESTATE GROUP, INC. - New
 $139,900Active2 beds 1 baths1,240 sq. ft.
387 N Wisconsin Street, Berlin, WI 54923
MLS# 2019259Listed by: HEARTHSTONE REALTY INC - New
 $279,900Active3 beds 2 baths2,400 sq. ft.
449 N Clinton Street, Princeton, WI 54968
MLS# 2019108Listed by: BERKSHIRE HATHAWAY HOMESERVICES LOCAL REALTY - New
 $587,000Active3 beds 2 baths1,456 sq. ft.
N826 County Road Hh, Kingston, WI 53926
MLS# 1954860Listed by: MARTIN REAL ESTATE - New
 $424,900Active3 beds 2 baths2,056 sq. ft.
W1784 County Road AW, Randolph, WI 53956
MLS# 2018989Listed by: RE/MAX PREFERRED 
 $320,000Active3 beds 2 baths1,610 sq. ft.
210 N Farmer Street, Princeton, WI 54968
MLS# 2018956Listed by: CENTURY 21 PROPERTIES UNLIMITED $499,000Active3 beds 3 baths3,104 sq. ft.
N5664 Sondalle Lane, Princeton, WI 54968
MLS# 2018874Listed by: YELLOW HOUSE REALTY $259,900Active5 beds 2 baths2,512 sq. ft.
215 N Bridge Street, Markesan, WI 53946
MLS# 2018841Listed by: EMMER REAL ESTATE GROUP, INC. $240,000Active2 beds 3 baths1,310 sq. ft.
145 Sumner Street, BERLIN, WI 54923
MLS# 50322396Listed by: KELLER WILLIAMS FOX CITIES- Open Sat, 10am to 12pm
 $399,000Active4 beds 2 baths1,824 sq. ft.
443 Ernest Street, Green Lake, WI 54941
MLS# 2018621Listed by: BETTER HOMES AND GARDENS REAL ESTATE SPECIAL PROPERTIES  $329,000Active2 beds 2 baths1,900 sq. ft.
N5015 Fox River Lane, Princeton, WI 54968
MLS# 2018625Listed by: EMMER REAL ESTATE GROUP, INC.- Open Sat, 1 to 4pm
 $548,000Active4 beds 3 baths2,898 sq. ft.
W2268 Ledgeview Road, GREEN LAKE, WI 54941-0000
MLS# 50322287Listed by: BERKSHIRE HATHAWAY HS WATER CITY REALTY  $2,300,000Active6 beds 3 baths9,000 sq. ft.
W743 Utley Road, Markesan, WI 53946
MLS# 2018408Listed by: BETTER HOMES AND GARDENS REAL ESTATE SPECIAL PROPERTIES $230,000Active3 beds 2 baths1,505 sq. ft.
109 Park Avenue, BERLIN, WI 54923
MLS# 50322276Listed by: COLDWELL BANKER REAL ESTATE GROUP $364,980Active3 beds 2 baths1,402 sq. ft.
515 Sacramento Street, BERLIN, WI 54923
MLS# 50322153Listed by: FIRST WEBER, INC. $205,000Active3 beds 1 baths1,500 sq. ft.
208 N Capron Street, BERLIN, WI 54923
MLS# 50322158Listed by: FIRST WEBER, INC. $324,900Active3 beds 1 baths1,211 sq. ft.
W831 State Road 91, BERLIN, WI 54923
MLS# 50322133Listed by: BRIDGE REALTY PARTNERS $127,900Active2 beds 1 baths872 sq. ft.
147 S Pearl Street, BERLIN, WI 54923
MLS# 50322079Listed by: REALTY ONE GROUP HAVEN $124,900Pending2 beds 2 baths1,018 sq. ft.
921 Wilson Street, Princeton, WI 54968
MLS# 2018133Listed by: REAL BROKER LLC $399,000Active4 beds 2 baths1,829 sq. ft.
607 Mill Street, Green Lake, WI 54941
MLS# 2018120Listed by: @PROPERTIES-ELLEVEN CHRISTIE'S INTERNATIONAL REAL ESTATE $599,900Active5 beds 2 baths
W3769 State Road 44, Manchester, WI 53946
MLS# 1953159Listed by: MARTIN REAL ESTATE $3,899,000Active6 beds 6 baths3,774 sq. ft.
513 Greenway Avenue, Green Lake, WI 54941
MLS# 2018039Listed by: BETTER HOMES AND GARDENS REAL ESTATE SPECIAL PROPERTIES $100,000Pending3 beds 1 baths925 sq. ft.
265 Charlevoix St, Marquette, WI 53947
MLS# 1952744Listed by: KELLER WILLIAMS REALTY-MILWAUKEE SOUTHWEST $4,675,000Active5 beds 4 baths4,904 sq. ft.
W2932 Kahl Road, Markesan, WI 53946
MLS# 2017871Listed by: CENTURY 21 PROPERTIES UNLIMITED $385,000Active3 beds 2 baths1,140 sq. ft.
N4273 Lakeview Drive, Markesan, WI 53946
MLS# 2017826Listed by: EMMER REAL ESTATE GROUP, INC. $269,900Pending3 beds 2 baths1,218 sq. ft.
W5798 State Road 23, Princeton, WI 54968
MLS# 1952498Listed by: COMPASS RE WI-NORTHSHORE $215,000Active2 beds 1 baths1,568 sq. ft.
W5794 State Road 23, Princeton, WI 54968
MLS# 1952506Listed by: COMPASS RE WI-NORTHSHORE $349,000Active2 beds 1 baths1,624 sq. ft.
W3661 N Lawn Drive, Markesan, WI 53946
MLS# 2017624Listed by: BETTER HOMES AND GARDENS REAL ESTATE SPECIAL PROPERTIES $214,980Active4 beds 2 baths1,960 sq. ft.
146 E Moore Street, BERLIN, WI 54923
MLS# 50321741Listed by: FIRST WEBER, INC. $224,900Active4 beds 2 baths1,711 sq. ft.
244 W Liberty Street, BERLIN, WI 54923
MLS# 50321654Listed by: RE/MAX 24/7 REAL ESTATE, LLC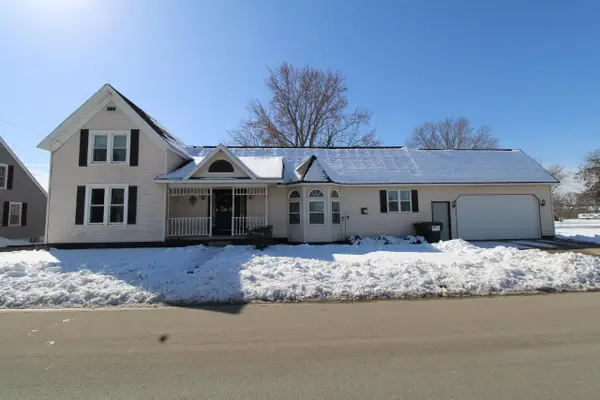 $215,000Active4 beds 2 baths2,306 sq. ft.
317 Ripon Road, Berlin, WI 54923
MLS# 2017298Listed by: REALTY SOLUTIONS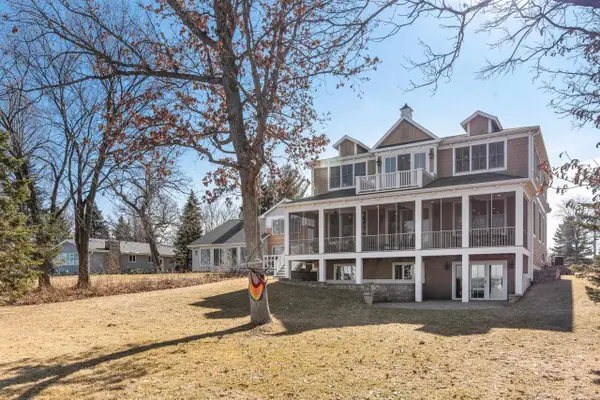 $3,849,000Active6 beds 7 baths5,719 sq. ft.
W3024 Longview Lane, Green Lake, WI 54941
MLS# 2016060Listed by: BETTER HOMES AND GARDENS REAL ESTATE SPECIAL PROPERTIES $269,980Active3 beds 3 baths1,553 sq. ft.
200 E Moore Street, BERLIN, WI 54923
MLS# 50321364Listed by: FIRST WEBER, INC.- Open Sat, 10 to 11am
 $299,000Active3 beds 2 baths1,459 sq. ft.
250 W Caroline Street, MARKESAN, WI 53946
MLS# 50321356Listed by: ADASHUN JONES, INC.  $2,349,900Active3 beds 4 baths2,683 sq. ft.
N5889 Soda Road, Princeton, WI 54968
MLS# 2016843Listed by: ADASHUN JONES REAL ESTATE $189,900Active2 beds 2 baths1,408 sq. ft.
416 S Farmer Street, Princeton, WI 54968
MLS# 2016740Listed by: EMMER REAL ESTATE GROUP, INC.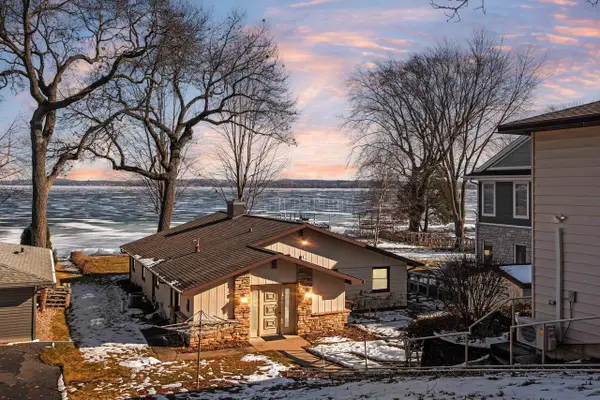 $1,399,000Active5 beds 3 baths2,156 sq. ft.
N4470 S Lakeshore Drive, Green Lake, WI 54941
MLS# 2016655Listed by: BETTER HOMES AND GARDENS REAL ESTATE SPECIAL PROPERTIES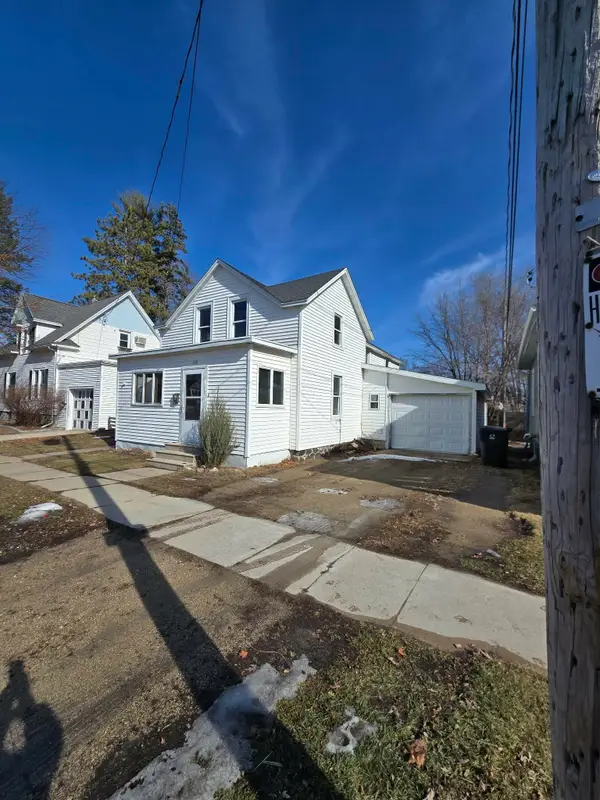 $175,000Active3 beds 1 baths1,570 sq. ft.
110 S Washington Street, BERLIN, WI 54923
MLS# 50321163Listed by: BEISER REALTY, LLC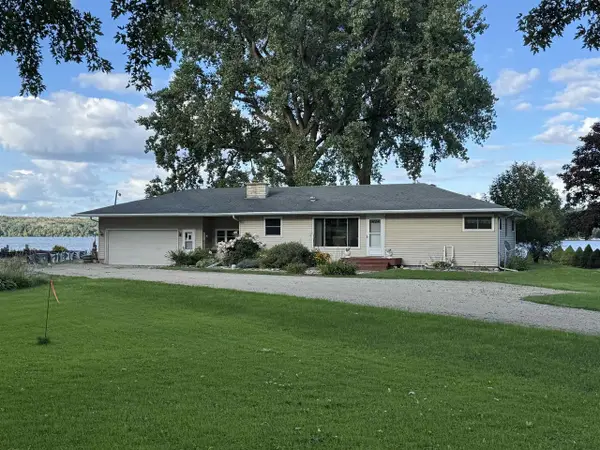 $519,000Active3 beds 2 baths1,232 sq. ft.
W2138 Melmar Drive, Markesan, WI 53946
MLS# 2016521Listed by: EMMER REAL ESTATE GROUP, INC.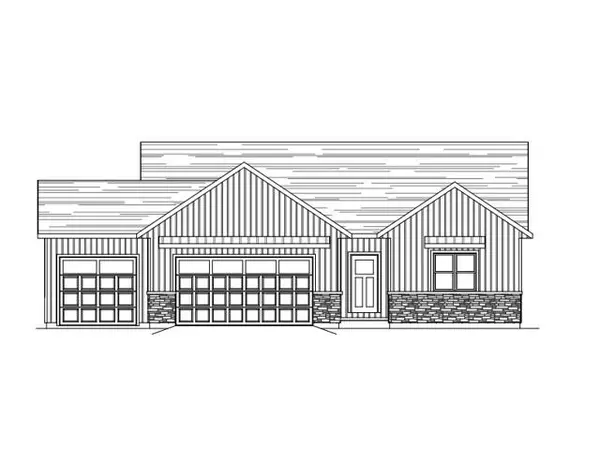 $379,900Active3 beds 2 baths1,432 sq. ft.
275 Jasmine Drive, BERLIN, WI 54923
MLS# 50321129Listed by: RE/MAX 24/7 REAL ESTATE, LLC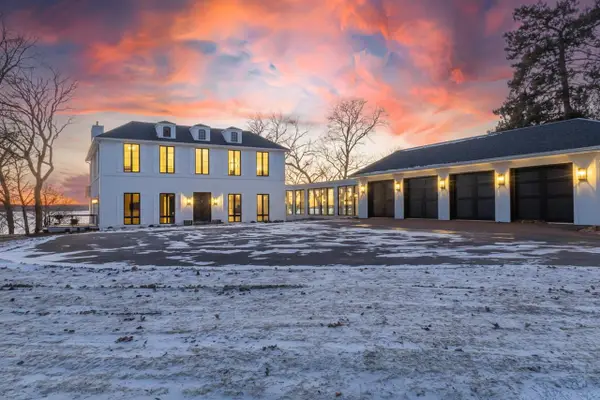 $5,450,000Active5 beds 8 baths8,114 sq. ft.
N5673 County Rd A Road, Green Lake, WI 54941
MLS# 2016444Listed by: BETTER HOMES AND GARDENS REAL ESTATE SPECIAL PROPERTIES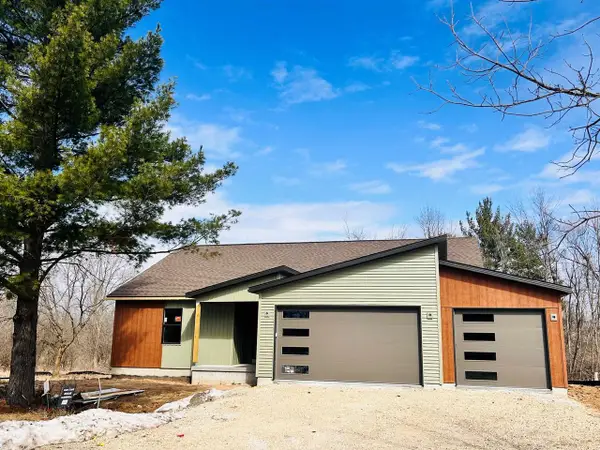 $689,900Active4 beds 3 baths2,358 sq. ft.
640 Fiddlehead Court, Green Lake, WI 54941
MLS# 2016367Listed by: EMMER REAL ESTATE GROUP, INC. $109,900Active3 beds 2 baths776 sq. ft.
471 N Fulton Street, Princeton, WI 54968
MLS# 2016265Listed by: QUORUM ENTERPRISES, INC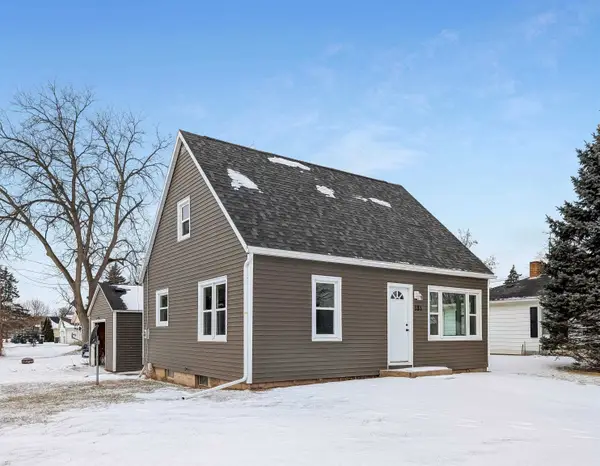 $215,000Active3 beds 1 baths1,008 sq. ft.
181 S Washington Street, BERLIN, WI 54923
MLS# 50320710Listed by: COFFEE HOUSE REALTY, LLC $149,900Active2 beds 1 baths1,550 sq. ft.
153 W Charles Street, Markesan, WI 53946
MLS# 2015570Listed by: MOVING ON WISCONSIN REALTY LLC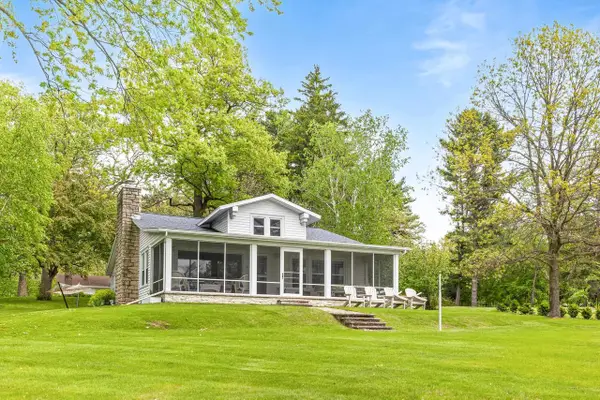 $2,799,000Active3 beds 2 baths1,814 sq. ft.
607C Illinois Avenue, Green Lake, WI 54941
MLS# 2014889Listed by: BETTER HOMES AND GARDENS REAL ESTATE SPECIAL PROPERTIES $1,249,000Active3 beds 3 baths1,766 sq. ft.
W964 Spring Grove Road, Green Lake, WI 54941
MLS# 2013559Listed by: BETTER HOMES AND GARDENS REAL ESTATE SPECIAL PROPERTIES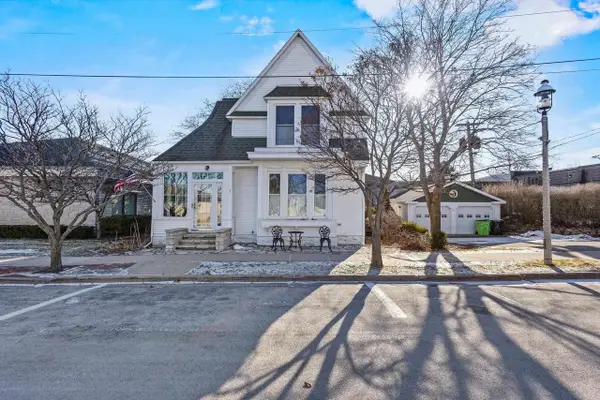 $449,000Active3 beds 2 baths2,100 sq. ft.
511 Hill Street, Green Lake, WI 54941
MLS# 2014303Listed by: BETTER HOMES AND GARDENS REAL ESTATE SPECIAL PROPERTIES $275,000Active3 beds 2 baths1,560 sq. ft.
W5488 Bend Road, PRINCETON, WI 54968
MLS# 50319395Listed by: BECKMAN PROPERTIES $195,000Active3 beds 2 baths1,144 sq. ft.
W5492 Bend Road, PRINCETON, WI 54968
MLS# 50319397Listed by: BECKMAN PROPERTIES $2,390,000Active4 beds 3 baths2,700 sq. ft.
N5667 Lac Verde Circle, Green Lake, WI 54941
MLS# 2014040Listed by: BETTER HOMES AND GARDENS REAL ESTATE SPECIAL PROPERTIES $310,000Active3 beds 1 baths21,823 sq. ft.
W5244 Oak Tree Lane, Princeton, WI 54968
MLS# 12542632Listed by: CHABRI HOMES
 $225,000Active3 beds 1 baths1,952 sq. ft.
237 E Pearl Street, Kingston, WI 53939
MLS# 2013746Listed by: CENTURY 21 PROPERTIES UNLIMITED $210,000Active3 beds 1 baths720 sq. ft.
161 S Johnson Street, BERLIN, WI 54923
MLS# 50318979Listed by: EXPERT REAL ESTATE PARTNERS, LLC $150,000Pending3 beds 2 baths1,120 sq. ft.
505 S Howard Street, Princeton, WI 54968
MLS# 2013243Listed by: REAL BROKER LLC $250,000Active-- beds -- baths1,512 sq. ft.
W895 State Road 23 and 49 Road, Green Lake, WI 54941
MLS# 2013063Listed by: @PROPERTIES-ELLEVEN CHRISTIE'S INTERNATIONAL REAL ESTATE $49,900Active2 beds 1 baths784 sq. ft.
W2354 Hwy 23 Road #106, Green Lake, WI 54941
MLS# 2013049Listed by: YELLOW HOUSE REALTY $29,500Active2 beds 1 baths896 sq. ft.
330 N Fulton Street #8, Princeton, WI 54968
MLS# 2012980Listed by: YELLOW HOUSE REALTY $489,900Active4 beds 3 baths2,360 sq. ft.
N8568 Seward Dr, Berlin, WI 54923
MLS# 2012940Listed by: RE/MAX PREFERRED $229,980Active4 beds 2 baths2,150 sq. ft.
447 Broadway Street, BERLIN, WI 54923
MLS# 50318507Listed by: FIRST WEBER, INC. $729,900Active5 beds 4 baths2,600 sq. ft.
W3832 Orchard Avenue, Green Lake, WI 54941
MLS# 2012243Listed by: EMMER REAL ESTATE GROUP, INC. $384,900Active3 beds 3 baths1,906 sq. ft.
N5842 Lakeview Drive, GREEN LAKE, WI 54941-9722
MLS# 50317816Listed by: CENTURY 21 ACE REALTY $349,900Active2 beds 1 baths1,760 sq. ft.
W1991 E River Road, Berlin, WI 54923
MLS# 2011985Listed by: EMMER REAL ESTATE GROUP, INC. $399,900Active3 beds 2 baths1,966 sq. ft.
N5149 Fox Lane, PRINCETON, WI 54968
MLS# 50317631Listed by: GAATZ REAL ESTATE $359,000Active3 beds 2 baths1,536 sq. ft.
471 Walker Avenue, Green Lake, WI 54941
MLS# 2011725Listed by: BETTER HOMES AND GARDENS REAL ESTATE SPECIAL PROPERTIES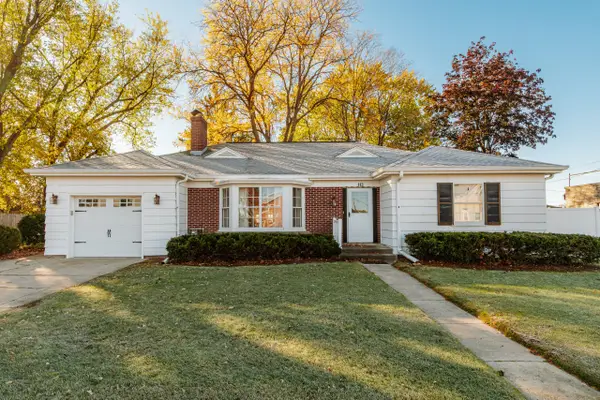 $334,850Active3 beds 1 baths1,613 sq. ft.
113 W Water St, Princeton, WI 54968
MLS# 1940075Listed by: SHOREWEST REALTORS, INC. $1,600,000Active1 beds 1 baths460 sq. ft.
2XXXX Lost Creek Rd, Herbster, WI 54844
MLS# 6122554Listed by: VISIONS FIRST REALTY, LLC
 $890,000Active4 beds 3 baths3,014 sq. ft.
N4267 Cherokee Court, Markesan, WI 53946
MLS# 2010704Listed by: CENTURY 21 PROPERTIES UNLIMITED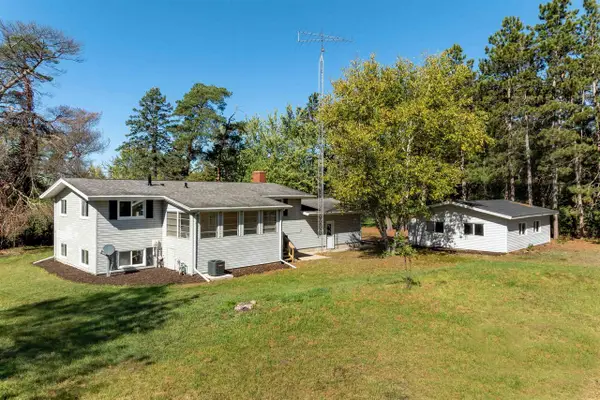 $369,900Pending4 beds 2 baths2,080 sq. ft.
N5655 County Road T, Princeton, WI 54968
MLS# 2010448Listed by: CENTURY 21 PROPERTIES UNLIMITED $139,980Active4 beds 1 baths1,469 sq. ft.
325 N Wisconsin Street, BERLIN, WI 54923
MLS# 50316372Listed by: FIRST WEBER, INC.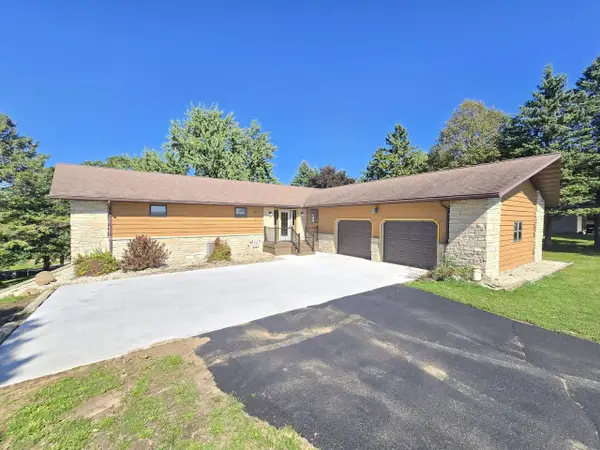 $425,000Active5 beds 3 baths3,841 sq. ft.
W2102 State Road 44, Markesan, WI 53946
MLS# 2010189Listed by: CENTURY 21 PROPERTIES UNLIMITED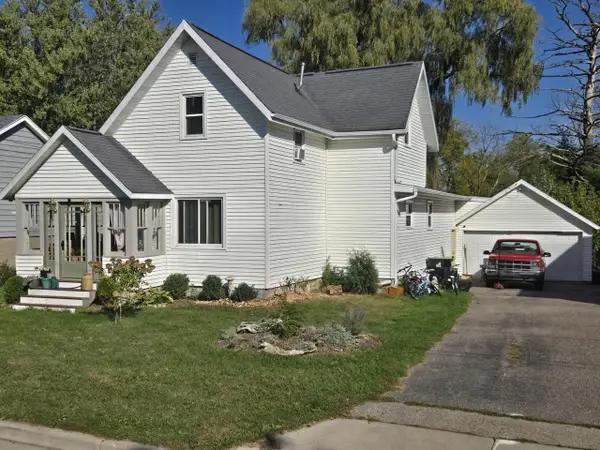 $175,000Active3 beds 2 baths1,994 sq. ft.
226 S High Street, Markesan, WI 53946
MLS# 2010143Listed by: CENTURY 21 PROPERTIES UNLIMITED $120,000Active2 beds 1 baths1,274 sq. ft.
W4462 Old Green Lake Road, PRINCETON, WI 54968
MLS# 50315887Listed by: EXPERT REAL ESTATE PARTNERS, LLC $415,000Active3 beds 2 baths1,864 sq. ft.
570 Sherwood Lane, Green Lake, WI 54941
MLS# 2009451Listed by: EMMER REAL ESTATE GROUP, INC. $849,000Active4 beds 2 baths2,233 sq. ft.
W3141 Bay Road, Green Lake, WI 54941
MLS# 2009157Listed by: BETTER HOMES AND GARDENS REAL ESTATE SPECIAL PROPERTIES $279,000Active3 beds 2 baths2,482 sq. ft.
330 W Main Street, Princeton, WI 54968
MLS# 2008867Listed by: WHITEMARSH PROPERTIES LLC $1,100,000Active3 beds 3 baths2,400 sq. ft.
N7117 (50 Acres) Black Creek Road, Princeton, WI 54968
MLS# 2008675Listed by: WISCONSIN SPECIAL PROPERTIES $889,500Active3 beds 3 baths2,400 sq. ft.
N7117 Black Creek Road, Princeton, WI 54968
MLS# 2008630Listed by: WISCONSIN SPECIAL PROPERTIES $297,500Active4 beds 2 baths2,188 sq. ft.
N5583 County Road W Road, Princeton, WI 54968
MLS# 2008213Listed by: CENTURY 21 PROPERTIES UNLIMITED $269,000Active3 beds 2 baths1,547 sq. ft.
604 Halbert Street, Green Lake, WI 54941
MLS# 2007738Listed by: BETTER HOMES AND GARDENS REAL ESTATE SPECIAL PROPERTIES $59,000Active1 beds 1 baths700 sq. ft.
N5204 Meadow View Circle #L20, Green Lake, WI 54941
MLS# 2007731Listed by: WISCONSIN SPECIAL PROPERTIES $267,000Active3 beds 1 baths1,290 sq. ft.
N6167 N Lawson Drive, Green Lake, WI 54941
MLS# 2007293Listed by: @PROPERTIES-ELLEVEN CHRISTIE'S INTERNATIONAL REAL ESTATE $2,749,000Active4 beds 5 baths2,600 sq. ft.
W6191 Lueck Lane, Princeton, WI 54968
MLS# 2005272Listed by: BETTER HOMES AND GARDENS REAL ESTATE SPECIAL PROPERTIES $545,000Active4 beds 2 baths3,663 sq. ft.
N5847 County Road D, Princeton, WI 54968
MLS# 2016895Listed by: MCGUIRE REALTY GROUP, LLC $230,000Active2 beds 1 baths1,008 sq. ft.
N3190 Oak Street, Markesan, WI 53946
MLS# 2004699Listed by: FIRST WEBER INC- Open Sat, 1 to 3pm
 $249,999Active3 beds 2 baths1,173 sq. ft.
N4580 Elm Street, Princeton, WI 54968
MLS# 2004234Listed by: COLDWELL BANKER RES BROKERAGE  $3,649,000Active7 beds 8 baths6,331 sq. ft.
W1053 & W1049 Illinois Avenue, Green Lake, WI 54941
MLS# 2003669Listed by: BETTER HOMES AND GARDENS REAL ESTATE SPECIAL PROPERTIES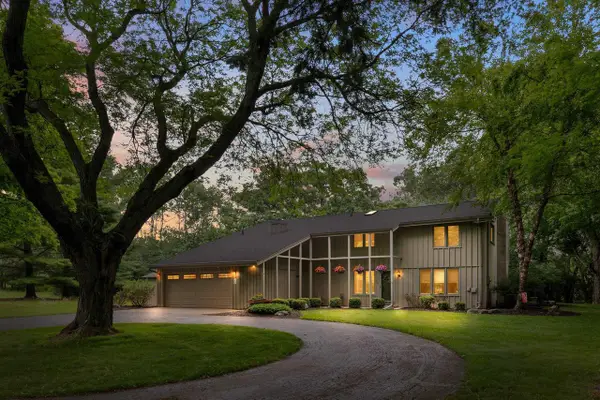 $549,000Active4 beds 3 baths2,828 sq. ft.
W857 Summit Court, Green Lake, WI 54941
MLS# 2017263Listed by: BETTER HOMES AND GARDENS REAL ESTATE SPECIAL PROPERTIES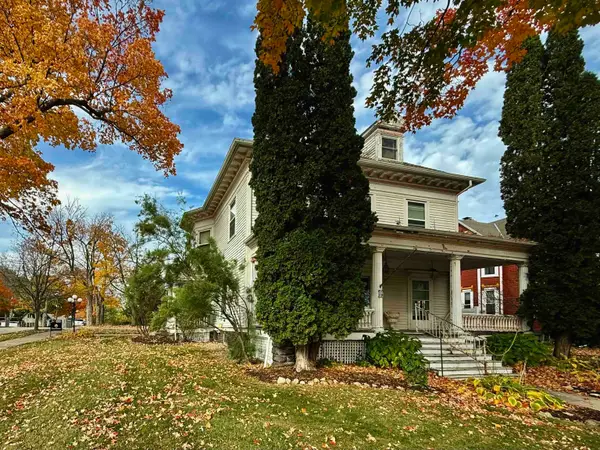 $219,980Active5 beds 5 baths3,413 sq. ft.
195 E Park Avenue, BERLIN, WI 54923
MLS# 50310378Listed by: FIRST WEBER, INC. $1,850,000Active5 beds 2 baths2,921 sq. ft.
540 North Street, Green Lake, WI 54941
MLS# 2001579Listed by: BETTER HOMES AND GARDENS REAL ESTATE SPECIAL PROPERTIES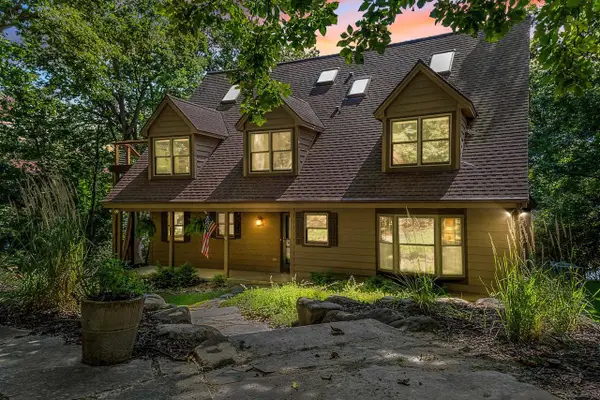 $3,875,000Active6 beds 5 baths3,375 sq. ft.
W2915 Orchard Avenue, Green Lake, WI 54941
MLS# 2001580Listed by: BETTER HOMES AND GARDENS REAL ESTATE SPECIAL PROPERTIES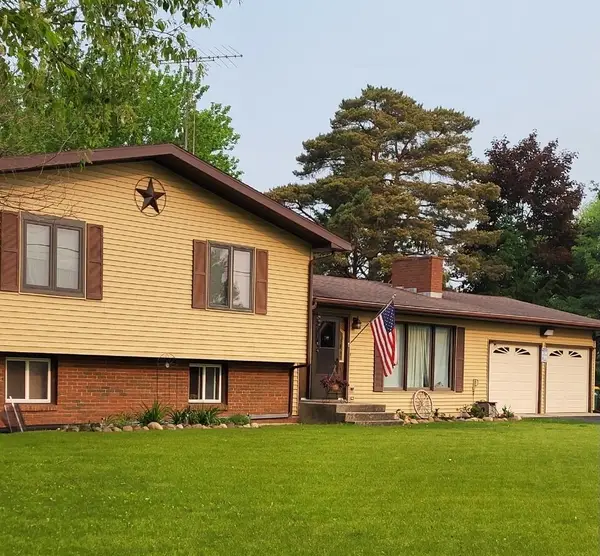 $330,000Pending4 beds 2 baths2,404 sq. ft.
N9407 32nd Dr, Berlin, WI 54923
MLS# 1921083Listed by: PICKET FENCE REAL ESTATE $269,900Pending2 beds 1 baths864 sq. ft.
N5164 Forest Glen Beach Road, Ripon, WI 54961
MLS# 1999252Listed by: EMMER REAL ESTATE GROUP, INC. $3,589,000Pending6 beds 6 baths4,571 sq. ft.
W2600 Oakwood Beach Road, Markesan, WI 53946
MLS# 1998144Listed by: BETTER HOMES AND GARDENS REAL ESTATE SPECIAL PROPERTIES $1,459,000Active3 beds 2 baths1,862 sq. ft.
W1188 Spring Grove Road, Green Lake, WI 54941
MLS# 1971990Listed by: BETTER HOMES AND GARDENS REAL ESTATE SPECIAL PROPERTIES
Local realty services provided by:CENTURY 21 In Good Company, CENTURY 21 Affiliated, CENTURY 21 New Heritage, CENTURY 21 Atwood
2026 Wisconsin Real Estate Exchange (WIREX) Information deemed reliable, but not guaranteed. This information, provided by seller, listing broker, and other parties, may not have been verified. Information is provided exclusively for consumers personal, non-commercial use and that it may not be used for any purpose other than to identify prospective properties consumers may be interested in purchasing.
2026 Wisconsin Real Estate Exchange (WIREX) Information deemed reliable, but not guaranteed. This information, provided by seller, listing broker, and other parties, may not have been verified. Information is provided exclusively for consumers personal, non-commercial use and that it may not be used for any purpose other than to identify prospective properties consumers may be interested in purchasing.
The information being provided by Wisconsin Real Estate Exchange is for the consumer’s personal, non-commercial use and may not be used for any purpose other than to identify prospective properties consumers may be interested in purchasing. Information is supplied by seller and other third parties and has not been verified. 2026 Wisconsin Real Estate Exchange All rights reserved.
Copyright 2026 Midwest Real Estate Data LLC. All rights reserved. The data relating to real estate for sale on this web site comes in part from the Broker Reciprocity Program of the Midwest Real Estate Data LLC. Listing information is deemed reliable but not guaranteed.
2026, Lake Superior Area REALTORS, Inc.
Popular searches near Green Lake County, WI
Popular neighborhoods near Green Lake County, WI
- DeForest, Deforest homes for sale
- Emerald Terrace, Sun Prairie homes for sale
- Erb Park, Appleton homes for sale
- Historic Central Neighborhood, Appleton homes for sale
- Historic Fourth Ward, Oshkosh homes for sale
- Historic Jackson, Oshkosh homes for sale
- Liberty Square, Sun Prairie homes for sale
- Marina District, Oshkosh homes for sale
- Menominee South, Oshkosh homes for sale
- Midtown, Oshkosh homes for sale
- Northshore, Oshkosh homes for sale
- Renstone West, Sun Prairie homes for sale
- River East, Oshkosh homes for sale
- St. Bernadette Parish, Appleton homes for sale
- Sawyer, Oshkosh homes for sale
- Stevens Park, Oshkosh homes for sale
- Stoneridge Estates, Sun Prairie homes for sale
- West Appleton, Appleton homes for sale
- Wittman Regional Airport, Oshkosh homes for sale
- Wyndham Hills, Sun Prairie homes for sale
Zip codes near Green Lake County, WI
- 53919 homes for sale
- 53923 homes for sale
- 53926 homes for sale
- 53933 homes for sale
- 53935 homes for sale
- 53946 homes for sale
- 53947 homes for sale
- 53949 homes for sale
- 53954 homes for sale
- 53956 homes for sale
- 53963 homes for sale
- 54923 homes for sale
- 54941 homes for sale
- 54960 homes for sale
- 54963 homes for sale
- 54965 homes for sale
- 54968 homes for sale
- 54970 homes for sale
- 54971 homes for sale
- 54982 homes for sale
Protect your home and budget from life's surprises with an Assurant Home Warranty, backed by a partner that supports you through every step of homeownership. Explore Plans.
©2026 Century 21 Real Estate LLC. All rights reserved. CENTURY 21®, the CENTURY 21 Logo and C21® are service marks owned by Century 21 Real Estate LLC. Century 21 Real Estate LLC fully supports the principles of the Fair Housing Act and the Equal Opportunity Act. Each office is independently owned and operated. Listing information is deemed reliable but not guaranteed accurate.