- Atwater Village, Los Angeles homes for sale
- Beachwood Canyon, Los Angeles homes for sale
- Fremont Park, Glendale homes for sale
- Glenwood, Glendale homes for sale
- Grandview, Glendale homes for sale
- Hollywood Hills, Los Angeles homes for sale
- Hollywoodland, Los Angeles homes for sale
- Lake Hollywood, Los Angeles homes for sale
- Los Feliz, Los Angeles homes for sale
- Los Feliz Estates, Los Angeles homes for sale
- Los Feliz Hills, Los Angeles homes for sale
- Los Feliz Square, Los Angeles homes for sale
- Los Feliz Village, Los Angeles homes for sale
- Moorpark, Glendale homes for sale
- Pacific - Edison, Glendale homes for sale
- Rancho Adjacent, Burbank homes for sale
- Riverside Rancho, Glendale homes for sale
- The Oaks, Los Angeles homes for sale
- Vineyard, Glendale homes for sale
- Waverly Heights, Los Angeles homes for sale
Griffith Park, Los Angeles, CA - homes for sale
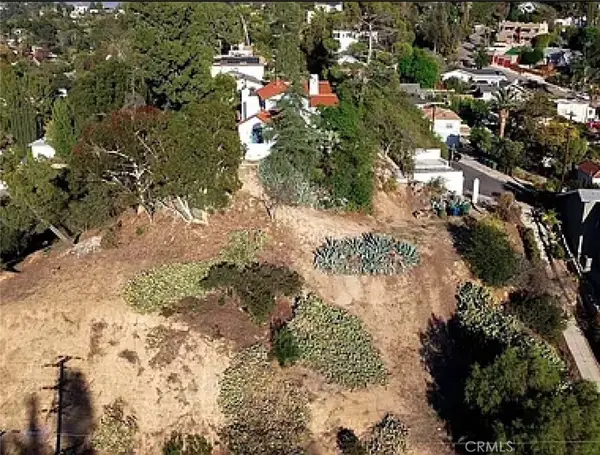
1 of 1 results displayed
Local realty services provided by:CENTURY 21 Adams & Barnes
The information being provided by California Regional MLS (Southern California) is for the consumer's personal, non-commercial use and may not be used for any purpose other than to identify prospective properties consumer may be interested in purchasing. Any information relating to real estate for sale referenced on this web site comes from the Internet Data Exchange (IDX) program of the California Regional MLS (Southern California). CENTURY 21 Adams & Barnes is not a Multiple Listing Service (MLS), nor does it offer MLS access. This website is a service of CENTURY 21 Adams & Barnes, a broker participant of California Regional MLS (Southern California). This web site may reference real estate listing(s) held by a brokerage firm other than the broker and/or agent who owns this web site.
The accuracy of all information, regardless of source, including but not limited to open house information, square footages and lot sizes, is deemed reliable but not guaranteed and should be personally verified through personal inspection by and/or with the appropriate professionals. The data contained herein is copyrighted by California Regional MLS (Southern California) and is protected by all applicable copyright laws. Any unauthorized dissemination of this information is in violation of copyright laws and is strictly prohibited.
Copyright 2021 California Regional MLS (Southern California). All rights reserved.
Popular neighborhoods near Griffith Park, Los Angeles, CA
Zip codes near Griffith Park, Los Angeles, CA
- 90004 homes for sale
- 90026 homes for sale
- 90027 homes for sale
- 90028 homes for sale
- 90029 homes for sale
- 90038 homes for sale
- 90039 homes for sale
- 90046 homes for sale
- 90065 homes for sale
- 90068 homes for sale
- 91201 homes for sale
- 91202 homes for sale
- 91203 homes for sale
- 91204 homes for sale
- 91205 homes for sale
- 91207 homes for sale
- 91502 homes for sale
- 91505 homes for sale
- 91506 homes for sale
- 91602 homes for sale
Counties near Griffith Park, Los Angeles, CA
Protect your home and budget from life's surprises with an Assurant Home Warranty, backed by a partner that supports you through every step of homeownership. Explore Plans.
©2026 Century 21 Real Estate LLC. All rights reserved. CENTURY 21®, the CENTURY 21 Logo and C21® are service marks owned by Century 21 Real Estate LLC. Century 21 Real Estate LLC fully supports the principles of the Fair Housing Act and the Equal Opportunity Act. Each office is independently owned and operated. Listing information is deemed reliable but not guaranteed accurate.