- Chandler Park, Detroit homes for sale
- Conner Creek Industrial, Detroit homes for sale
- Cornerstone Village, Detroit homes for sale
- Denby, Detroit homes for sale
- East English Village, Detroit homes for sale
- East Village, Detroit homes for sale
- Eden Gardens, Detroit homes for sale
- Fox Creek, Detroit homes for sale
- Jefferson Chalmers, Detroit homes for sale
- Joseph Berry, Detroit homes for sale
- Lower East Detroit, Detroit homes for sale
- Mapleridge, Detroit homes for sale
- Morningside, Detroit homes for sale
- Moross, Detroit homes for sale
- Outer Drive, Detroit homes for sale
- Ravendale, Detroit homes for sale
- Riverbend, Detroit homes for sale
- South Conner Creek, Detroit homes for sale
- Wade, Detroit homes for sale
- Yorkshire Woods, Detroit homes for sale
Grosse Pointe, MI - homes for sale
42 of 42 results displayed
- New
 $1,150,000Active5 beds 4 baths4,200 sq. ft.
1020 Kensington, Grosse Pointe, MI 48230
MLS# 50207744Listed by: ADLHOCH & ASSOCIATES, REALTORS - New
 $649,000Active3 beds 4 baths2,027 sq. ft.
386 Notre Dame Street, GrossePointe, MI 48230
MLS# 20261035155Listed by: MAX BROOCK, REALTORS-BLOOMFIELD HILLS
 $525,000Pending3 beds 2 baths1,651 sq. ft.
631 Washington Road, GrossePointe, MI 48230
MLS# 20261032252Listed by: COLDWELL BANKER PROFESSIONALS-GPF- New
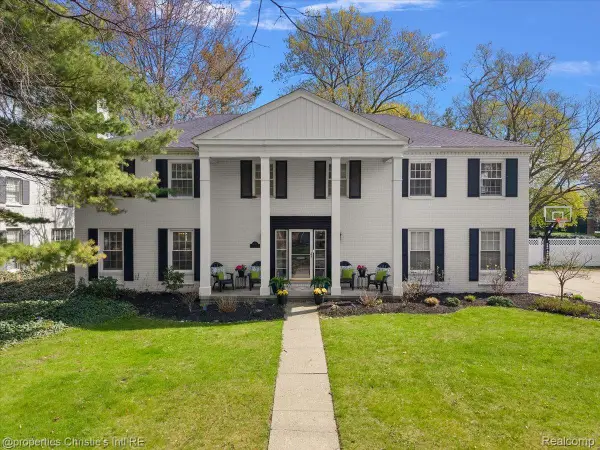 $948,000Active5 beds 5 baths4,203 sq. ft.
234 Lincoln Road, GrossePointe, MI 48230
MLS# 20261027729Listed by: @PROPERTIES CHRISTIE'S INT'L RE GROSSE POINTE - New
 $485,000Active4 beds 4 baths3,100 sq. ft.
16904 Saint Paul Street, GrossePointe, MI 48230
MLS# 20261030417Listed by: REAL ESTATE ONE GPF 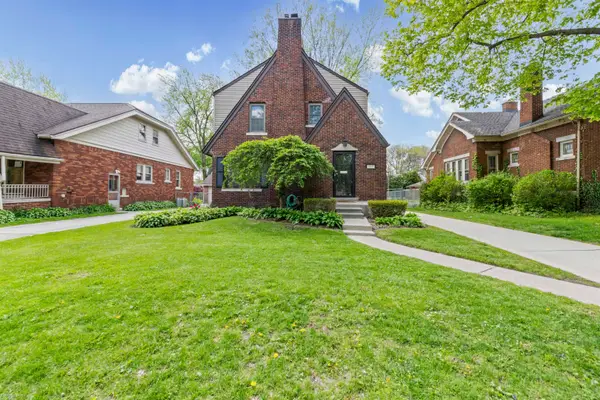 $429,900Pending3 beds 3 baths1,638 sq. ft.
847 University, Grosse Pointe, MI 48230
MLS# 50207083Listed by: BERKSHIRE HATHAWAY HOMESERVICES KEE REALTY SCS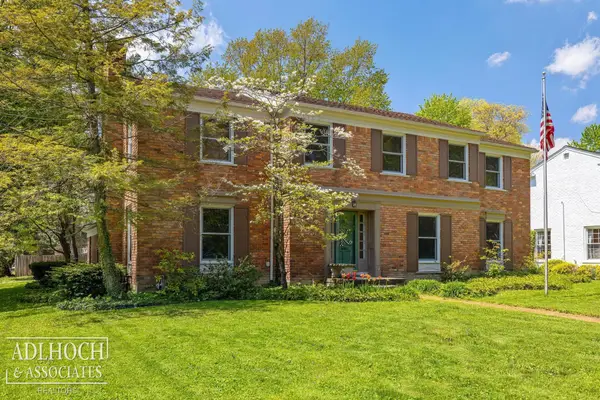 $715,000Pending4 beds 4 baths2,815 sq. ft.
393 Lakeland, Grosse Pointe, MI 48230
MLS# 50207067Listed by: ADLHOCH & ASSOCIATES, REALTORS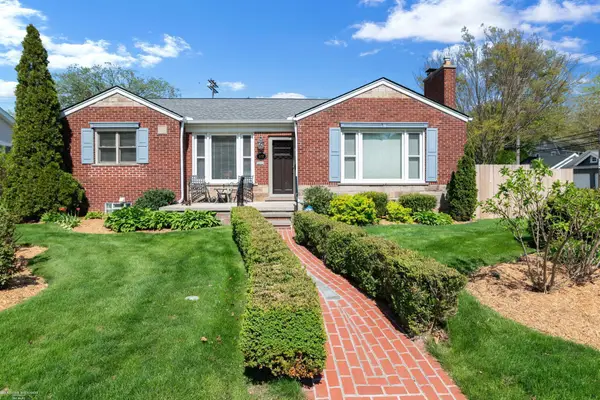 $348,000Pending2 beds 2 baths1,135 sq. ft.
832 Loraine, Grosse Pointe, MI 48230
MLS# 50206602Listed by: BERKSHIRE HATHAWAY HOMESERVICES KEE REALTY $525,000Active4 beds 4 baths2,100 sq. ft.
50 Cranford, Grosse Pointe, MI 48230
MLS# 50206155Listed by: JAMES R. FIKANY REAL ESTATE CO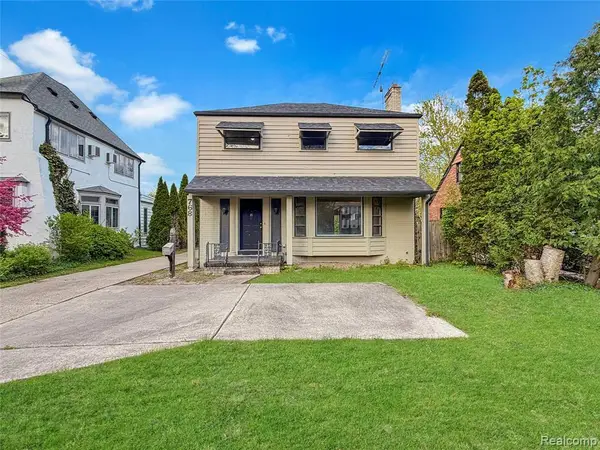 $225,000Active3 beds 2 baths1,605 sq. ft.
768 Washington, Grosse Pointe, MI 48230
MLS# 60989001Listed by: KW GROSSE POINTE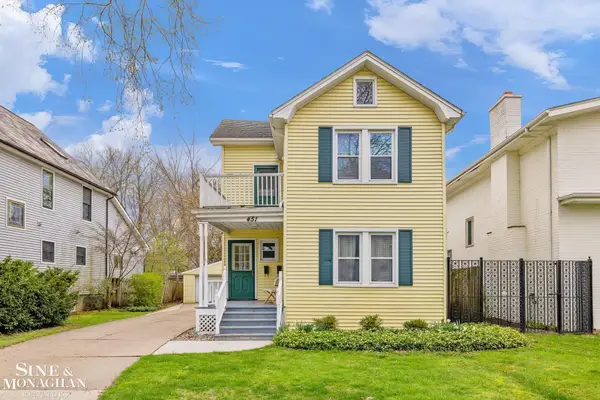 $429,000Active4 beds 3 baths
451 Saint Clair, Grosse Pointe, MI 48230
MLS# 50205868Listed by: SINE & MONAGHAN LLC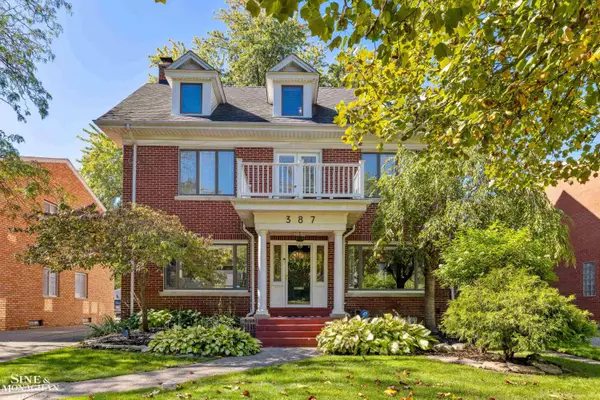 $590,000Pending6 beds 4 baths3,008 sq. ft.
387 Neff, Grosse Pointe, MI 48230
MLS# 50205717Listed by: SINE & MONAGHAN LLC $895,000Pending4 beds 4 baths3,510 sq. ft.
10 Sycamore, Grosse Pointe, MI 48230
MLS# 60985905Listed by: RE/MAX SHOWCASE HOMES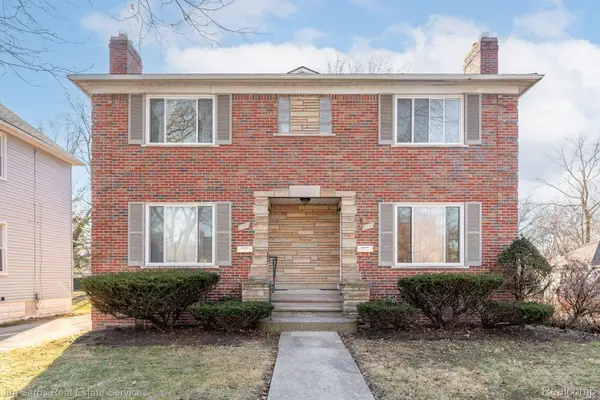 $499,000Active-- beds 4 baths2,660 sq. ft.
513 Saint Clair Avenue, GrossePointe, MI 48230
MLS# 20261026843Listed by: JIM SAROS REAL ESTATE SERVICES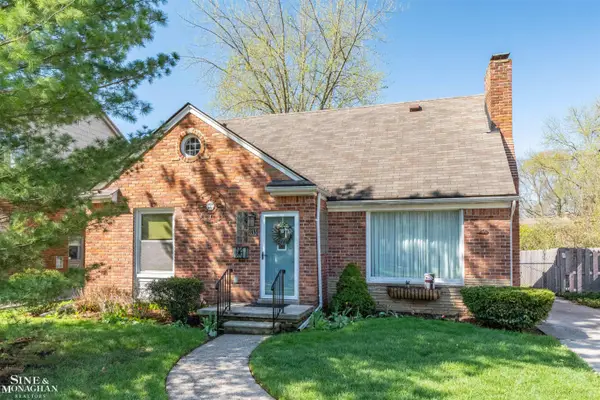 $349,900Pending3 beds 2 baths1,456 sq. ft.
833 University, Grosse Pointe, MI 48230
MLS# 50204728Listed by: SINE & MONAGHAN LLC $219,900Pending2 beds 1 baths1,282 sq. ft.
612 Cadieux, Grosse Pointe, MI 48230
MLS# 60984184Listed by: SINE & MONAGHAN LLC $379,500Pending3 beds 3 baths
883 St. Clair, Grosse Pointe, MI 48230
MLS# 50204288Listed by: HIGBIE MAXON AGNEY INC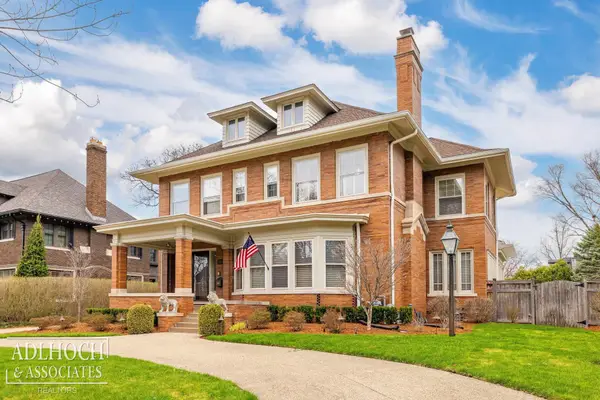 $1,250,000Active5 beds 4 baths4,200 sq. ft.
1020 Kensington, Grosse Pointe, MI 48230
MLS# 50204282Listed by: ADLHOCH & ASSOCIATES, REALTORS $365,000Active4 beds 3 baths2,040 sq. ft.
377 Rivard, Grosse Pointe, MI 48230
MLS# 50204174Listed by: SINE & MONAGHAN LLC $798,500Pending3 beds 3 baths2,514 sq. ft.
4 Elmsleigh, Grosse Pointe, MI 48230
MLS# 50203904Listed by: LUCIDO AND ASSOCIATES, INC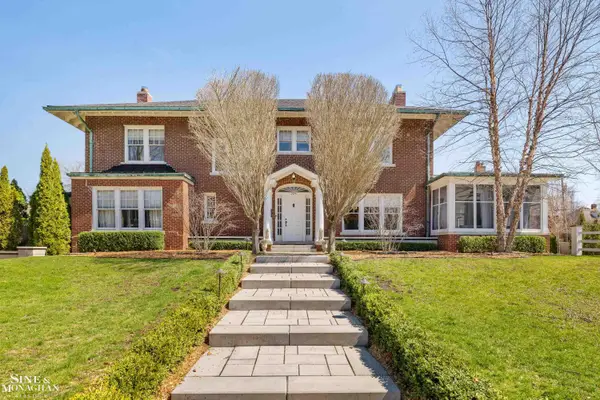 $1,385,000Pending6 beds 6 baths8,076 sq. ft.
334 University PL, GrossePointe, MI 48236
MLS# 58050203692Listed by: SINE & MONAGHAN LLC $1,385,000Pending6 beds 6 baths6,738 sq. ft.
334 University, Grosse Pointe, MI 48230
MLS# 50203692Listed by: SINE & MONAGHAN LLC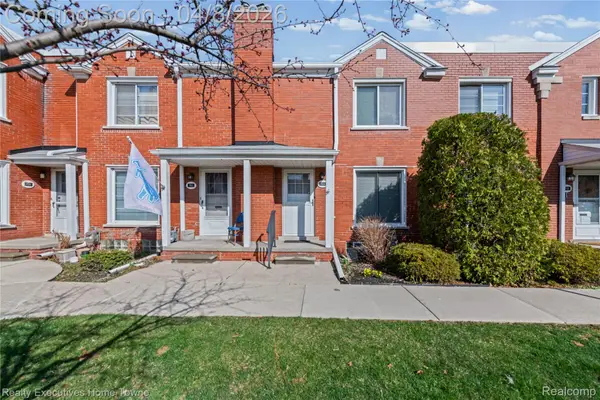 $217,900Active2 beds 2 baths1,256 sq. ft.
703 1/2 Saint Clair Street, GrossePointe, MI 48230
MLS# 20261020330Listed by: REALTY EXECUTIVES HOME TOWNE $1,199,000Active3 beds 5 baths3,670 sq. ft.
17680 E Jefferson, Grosse Pointe, MI 48230
MLS# 50202241Listed by: REAL ESTATE ONE INC-SHELBY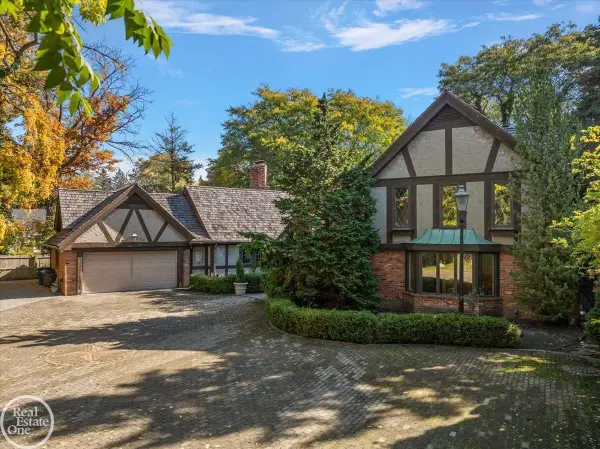 $1,199,000Active3 beds 5 baths4,420 sq. ft.
17680 E Jefferson AVE, GrossePointe, MI 48230
MLS# 58050202241Listed by: REAL ESTATE ONE INC-SHELBY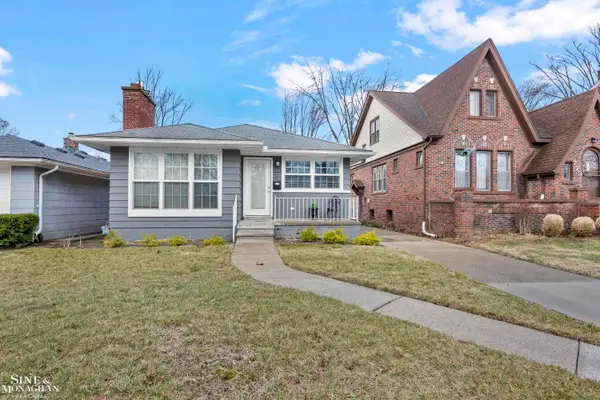 $350,000Pending2 beds 2 baths897 sq. ft.
771 Saint Clair, Grosse Pointe, MI 48230
MLS# 50201888Listed by: SINE & MONAGHAN LLC $750,000Active4 beds 4 baths2,808 sq. ft.
11 Wellington, Grosse Pointe, MI 48230
MLS# 50200826Listed by: SINE & MONAGHAN LLC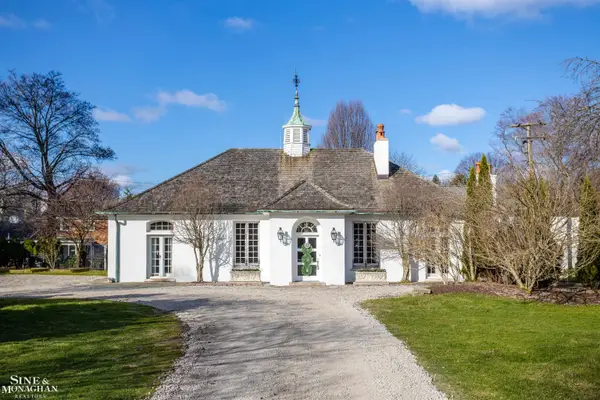 $875,000Active4 beds 4 baths3,820 sq. ft.
29 Fisher, Grosse Pointe, MI 48230
MLS# 50199056Listed by: SINE & MONAGHAN LLC $1,300,000Active5 beds 5 baths3,550 sq. ft.
1030 Bishop, Grosse Pointe, MI 48230
MLS# 50198864Listed by: REALTY EXECUTIVES HOME TOWNE CHESTERFIELD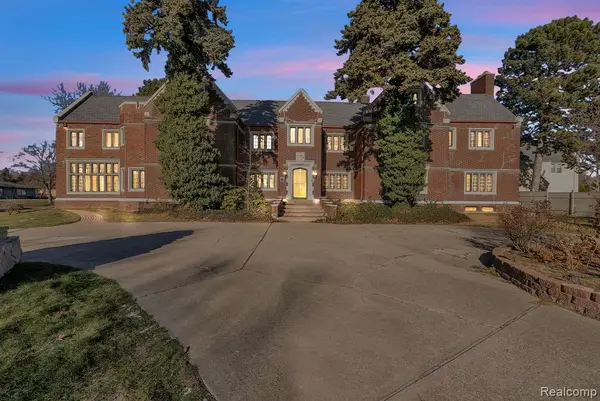 $1,200,000Active8 beds 8 baths10,020 sq. ft.
16761 E Jefferson, Grosse Pointe, MI 48230
MLS# 60967517Listed by: RE/MAX LEADING EDGE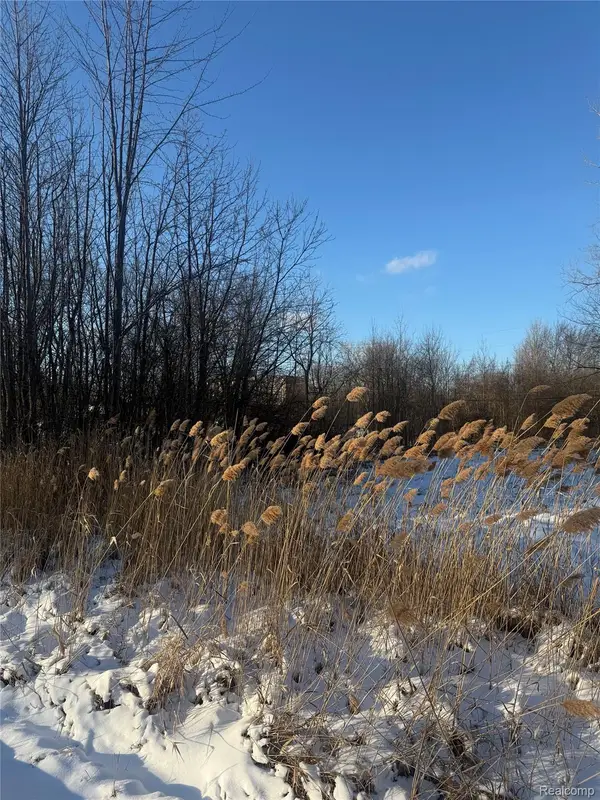 $13,000Active0.1 Acres
Sublot 41 Charles, ClintonTownship, MI 48035
MLS# 20261004840Listed by: GOLDEN KEY REALTY GROUP LLC $3,995,000Active-- beds 20 baths16,080 sq. ft.
516 Neff Lane Lane, GrossePointe, MI 48230
MLS# 20261004006Listed by: PINNACLE PLUS REALTY LLC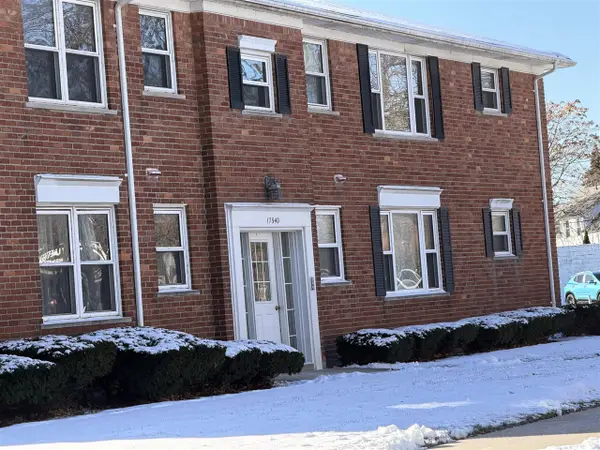 $120,000Pending1 beds 1 baths744 sq. ft.
17540 N Mack #10, Grosse Pointe, MI 48230
MLS# 70511396Listed by: NATIONAL REALTY CENTERS $120,000Pending1 beds 1 baths744 sq. ft.
17540 N Mack Avenue Unit: 10, GrossePointe, MI 48230
MLS# 81026001709Listed by: NATIONAL REALTY CENTERS $419,000Pending4 beds 3 baths1,810 sq. ft.
42 Cranford Lane, GrossePointe, MI 48230
MLS# 20251059188Listed by: COLDWELL BANKER PROFESSIONALS-GPF $349,000Active3 beds 2 baths1,463 sq. ft.
775 Notre Dame, Grosse Pointe, MI 48230
MLS# 50193121Listed by: SINE & MONAGHAN LLC $649,000Active3 beds 4 baths2,027 sq. ft.
386 Notre Dame, Grosse Pointe, MI 48230
MLS# 60985062Listed by: MAX BROOCK, REALTORS-BLOOMFIELD HILLS $400,000Active4 beds 2 baths
296-298 Rivard, Grosse Pointe, MI 48230
MLS# 50192234Listed by: ADLHOCH & ASSOCIATES, REALTORS $435,000Pending3 beds 2 baths1,792 sq. ft.
25 VILLAGE LN, GrossePointe, MI 48230
MLS# 58050188482Listed by: SINE & MONAGHAN LLC $435,000Pending3 beds 2 baths1,492 sq. ft.
25 Village, Grosse Pointe, MI 48230
MLS# 50188482Listed by: SINE & MONAGHAN LLC $780,000Active3 beds 3 baths3,028 sq. ft.
277 Lincoln, Grosse Pointe, MI 48230
MLS# 50181149Listed by: REAL ESTATE ONE GROSSE POINTE $1,695,000Active6 beds 8 baths8,733 sq. ft.
355 Lincoln, Grosse Pointe, MI 48230
MLS# 50144007Listed by: HIGBIE MAXON AGNEY INC
Local realty services provided by:CENTURY 21 Northland, CENTURY 21 Dynamic Realty
Neighborhoods near Grosse Pointe, MI
Zip codes near Grosse Pointe, MI
- 48021 homes for sale
- 48066 homes for sale
- 48080 homes for sale
- 48081 homes for sale
- 48089 homes for sale
- 48201 homes for sale
- 48202 homes for sale
- 48205 homes for sale
- 48207 homes for sale
- 48211 homes for sale
- 48212 homes for sale
- 48213 homes for sale
- 48214 homes for sale
- 48215 homes for sale
- 48224 homes for sale
- 48225 homes for sale
- 48226 homes for sale
- 48230 homes for sale
- 48234 homes for sale
- 48236 homes for sale
Popular searches near Grosse Pointe, MI
- Center Line homes for sale
- Detroit homes for sale
- Eastpointe homes for sale
- Ferndale homes for sale
- Fraser homes for sale
- Grosse Pointe Farms homes for sale
- Grosse Pointe Park homes for sale
- Grosse Pointe Shores homes for sale
- Grosse Pointe Woods homes for sale
- Hamtramck homes for sale
- Harper Woods homes for sale
- Hazel Park homes for sale
- Highland Park homes for sale
- Madison Heights homes for sale
- Pleasant Ridge homes for sale
- River Rouge homes for sale
- Roseville homes for sale
- St Clair Shores homes for sale
- Village of Grosse Pointe Shores homes for sale
- Warren homes for sale
Protect your home and budget from life's surprises with an Assurant Home Warranty, backed by a partner that supports you through every step of homeownership. Explore Plans.
©2026 Century 21 Real Estate LLC. All rights reserved. CENTURY 21®, the CENTURY 21 Logo and C21® are service marks owned by Century 21 Real Estate LLC. Century 21 Real Estate LLC fully supports the principles of the Fair Housing Act and the Equal Opportunity Act. Each office is independently owned and operated. Listing information is deemed reliable but not guaranteed accurate.