- 3rd Ward, Paterson homes for sale
- 6th Ward, Paterson homes for sale
- Athenia, Clifton homes for sale
- Botany Section, Clifton homes for sale
- Broadway, Passaic homes for sale
- Clifton Lakeview, Clifton homes for sale
- Downtown Passaic, Passaic homes for sale
- Dutch Hill, Clifton homes for sale
- Eastside Park, Paterson homes for sale
- Hasbrouck Heights, Hasbrouck Heights homes for sale
- Hazel, Clifton homes for sale
- Hitchcocks, Palisades Park homes for sale
- Kensington Park, Fort Lee homes for sale
- Lakeview, Paterson homes for sale
- Main Avenue, Passaic homes for sale
- Manor Section, Paterson homes for sale
- Middle Village, Clifton homes for sale
- Monroe Street, Passaic homes for sale
- Passaic Park, Passaic homes for sale
- Wood - Ridge, Wood Ridge homes for sale
Hackensack, NJ - homes for sale
190 of 190 results displayed
- New
 $460,000Active3 beds 2 baths
518 W Anderson Street, Hackensack, NJ 07601
MLS# 26019749Listed by: REALTY ONE GROUP LEGEND, CLIFTON
- Coming Soon
 $470,000Coming Soon3 beds 2 baths
518 W Anderson St, Hackensack City, NJ 07601
MLS# 4032275Listed by: REALTY ONE GROUP LEGEND - Open Sun, 1 to 4pmNew
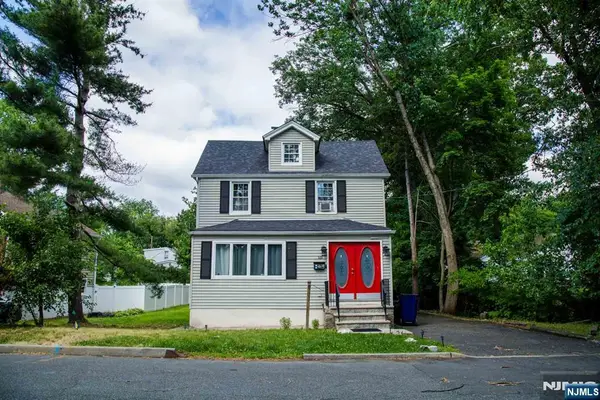
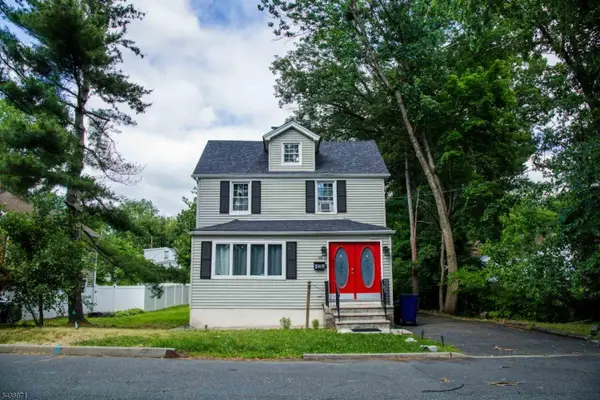
 $699,000Active4 beds 2 baths
120 S Prospect Avenue, Hackensack, NJ 07601
MLS# 26020667Listed by: LIFESTYLE INTERNATIONAL REALTY - Open Sat, 3 to 6pmNew
 $775,000Active-- beds 4 baths
204 Herman Street, Hackensack, NJ 07601
MLS# 26020597Listed by: EXP REALTY, LLC - New
 $649,900Active3 beds 2 baths7,350 sq. ft.
72 Clarendon Pl, Hackensack City, NJ 07601
MLS# 4032068Listed by: PREMIER HOMES - Open Sat, 1 to 4pmNew
 $600,000Active3 beds 2 baths
816 Summit Avenue, Hackensack, NJ 07601
MLS# 26009236Listed by: KELLER WILLIAMS VILLAGE SQUARE REALTY - New
 $117,500Active1 beds 1 baths
280 S Prospect Avenue 3N, Hackensack, NJ 07601
MLS# 26016963Listed by: COLDWELL BANKER, HILLSDALE - Open Sun, 1 to 3pmNew
 $435,000Active2 beds 2 baths
310 Lookout Avenue 501, Hackensack, NJ 07601
MLS# 26019296Listed by: COLDWELL BANKER, HILLSDALE - New
 $199,900Active1 beds 1 baths
303 C2 Hamilton Place C2, Hackensack, NJ 07601
MLS# 26019813Listed by: BETTER HOMES & GARDENS REAL ESTATE EXCLUSIVE PROPERTIES - New
 $569,000Active3 beds 1 baths
33 Pulaski Pl, Hackensack City, NJ 07601
MLS# 4031471Listed by: UNITED REAL ESTATE - New
 $569,000Active3 beds 1 baths
33-35 Pulaski Place, Hackensack, NJ 07601
MLS# 26020208Listed by: UNITED REAL ESTATE - New
 $384,000Active2 beds 2 baths
38 Moonachie Road 101, Hackensack, NJ 07601
MLS# 26015951Listed by: BLUELINE REALTY GROUP LLC - New
 $249,900Active2 beds 2 baths
280 Prospect Avenue 11 E, Hackensack, NJ 07601
MLS# 26019556Listed by: BERKSHIRE HATHAWAY HOME SERVICES ABBOTT REALTORS - New
 $658,900Active4 beds 2 baths
441 Blanchard Terrace, Hackensack, NJ 07601
MLS# 26015369Listed by: PREMIER PROPERTIES DAMIANO GROUP - New
 $423,000Active2 beds 2 baths
38 Moonachie Road 402, Hackensack, NJ 07601
MLS# 26019200Listed by: RE/MAX NOW - PALISADES PARK - New
 $399,900Active3 beds 1 baths
167 James Street, Hackensack, NJ 07601
MLS# 26019689Listed by: RE/MAX VILLA REALTORS-NORTH BERGEN - New
 $280,000Active1 beds 1 baths
235 Prospect Avenue 10H, Hackensack, NJ 07601
MLS# 26018824Listed by: VIKKI HEALEY PROPERTIES, LLC - Open Sun, 12 to 2pmNew
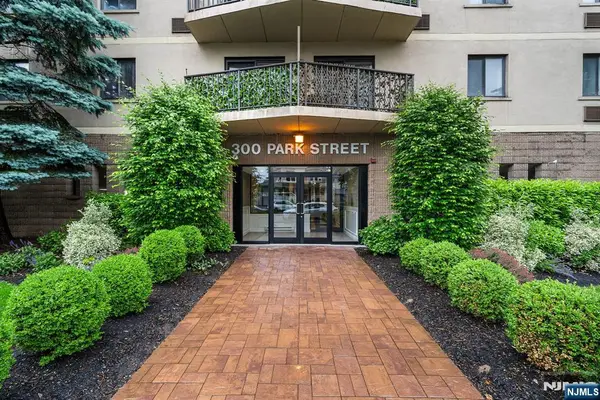 $355,000Active2 beds 1 baths
300 Park Street 5G, Hackensack, NJ 07601
MLS# 26019101Listed by: REDFIN CORPORATION - New
 $255,000Active1 beds 1 baths
100 Prospect Avenue 5H, Hackensack, NJ 07601
MLS# 26019370Listed by: CENTURY 21 AWARD AGENCY - New
 $489,900Active2 beds 4 baths
290 Hamilton Place 4, Hackensack, NJ 07601
MLS# 26019486Listed by: RE/MAX INTEGRITY - New
 $325,000Active2 beds 1 baths
25 Grand Ave #1E, Hackensack City, NJ 07601
MLS# 4030260Listed by: PROMINENT PROPERTIES SIR - New
 $294,999Active1 beds 1 baths
20 Jefferson St #A8, Hackensack City, NJ 07601
MLS# 4030199Listed by: PRESTIGE PROPERTY GROUP MONTCLAIR - New
 $255,000Active1 beds 1 baths
100 Prospect Ave #H, Hackensack City, NJ 07601
MLS# 4030203Listed by: C-21 AWARD AGENCY - New
 $269,900Active1 beds 1 baths
20 Jefferson Street B2, Hackensack, NJ 07601
MLS# 26019056Listed by: ACRE NJ LLC  $299,999Active1 beds 1 baths
326 Prospect Ave #1A, Hackensack City, NJ 07601
MLS# 4024810Listed by: UNITED REAL ESTATE $649,900Active3 beds 2 baths
156 Cedar Avenue, Hackensack, NJ 07601
MLS# 26010734Listed by: BERKSHIRE HATHAWAY HOME SERVICES ABBOTT REALTORS $225,000Active2 beds 2 baths
280 Prospect Avenue 8G, Hackensack, NJ 07601
MLS# 26018451Listed by: VIKKI HEALEY PROPERTIES, LLC $305,000Active1 beds 1 baths
307 Prospect Avenue 4D, Hackensack, NJ 07601
MLS# 26018555Listed by: BRIGHT HOMES REALTY LLC $650,000Active-- beds -- baths
185 Hudson Street, Hackensack, NJ 07601
MLS# 26018578Listed by: COLDWELL BANKER, WYCKOFF/FRANKLIN LAKES $435,000Active2 beds 1 baths
52 S State St, Hackensack City, NJ 07601
MLS# 4028962Listed by: WEICHERT REALTORS- QUISPE & ASSOC $649,900Pending4 beds 3 baths
34 Rowland Avenue, Hackensack, NJ 07601
MLS# 26018532Listed by: COMPASS NEW JERSEY, LLC-MONTCLAIR $650,000Active-- beds 2 baths
191 James Street, Hackensack, NJ 07601
MLS# 26018115Listed by: PROMINENT PROPERTIES SOTHEBY'S INTERNATIONAL REALTY-ALPINE $235,000Active-- beds 1 baths
303 Hamilton Place A4, Hackensack, NJ 07601
MLS# 26018131Listed by: TERRIE O'CONNOR REALTORS-WYCKOFF $499,000Active3 beds 2 baths
150 Overlook PH3, Hackensack, NJ 07601
MLS# 26018157Listed by: COLDWELL BANKER, ALPINE/CLOSTER $659,500Active3 beds 2 baths
163 Poplar Avenue, Hackensack, NJ 07601
MLS# 26018319Listed by: CHRISTIE'S INTERNATIONAL REAL ESTATE GROUP-PARAMUS $759,000Active5 beds 3 baths
47 Worth Street, Hackensack, NJ 07601
MLS# 26018001Listed by: ALL-CITY REALTY $649,000Active4 beds 2 baths
95 Cedar Ave, Hackensack City, NJ 07601
MLS# 4028348Listed by: SIGNATURE REALTY NJ $369,500Active2 beds 2 baths
105 State 3 E, Hackensack, NJ 07601
MLS# 26018045Listed by: UNITED REAL ESTATE $272,000Active1 beds 1 baths
150 Overlook Avenue 7A, Hackensack, NJ 07601
MLS# 26012163Listed by: KELLER WILLIAMS VALLEY REALTY $899,900Active-- beds 3 baths
178 Berry Street, Hackensack, NJ 07601
MLS# 26017899Listed by: RE/MAX SELECT - FRANKLIN LAKES $280,000Active1 beds 1 baths698 sq. ft.
-5 Linden Street #3J, Hackensack, NJ 07601
MLS# 2615900RListed by: NEXTHOME PENINSULA REALTY GRP $1,150,000Active4 beds 4 baths
384 Anderson Street, Hackensack, NJ 07601
MLS# 26008731Listed by: REAL $599,000Pending3 beds 2 baths
365 Marvin Avenue, Hackensack, NJ 07601
MLS# 26015633Listed by: BERKSHIRE HATHAWAY HOME SERVICES MERENDINO REALTY $698,000Pending3 beds 3 baths
31 Martin Terrace, Hackensack, NJ 07601
MLS# 26017159Listed by: VIKKI HEALEY PROPERTIES, LLC $319,900Active2 beds 1 baths
465 Maple Hill Drive 48, Hackensack, NJ 07601
MLS# 26016439Listed by: KELLER WILLIAMS TOWN LIFE $789,000Active-- beds 3 baths
314 Atlantic Street, Hackensack, NJ 07601
MLS# 26017524Listed by: COLDWELL BANKER GARDEN STATE $700,000Active4 beds 3 baths
42 Spring Valley Avenue, Hackensack, NJ 07601
MLS# 26012676Listed by: REAL $285,000Active1 beds 1 baths
150 Overlook Avenue 8D, Hackensack, NJ 07601
MLS# 26016633Listed by: RE/MAX NOW - NORWOOD $475,000Active2 beds 2 baths
54 Polifly Road 201, Hackensack, NJ 07601
MLS# 26016700Listed by: KELLER WILLIAMS TOWN LIFE $489,900Active2 beds 4 baths
290 Hamilton Place 4, Hackensack, NJ 07601
MLS# 26016801Listed by: RE/MAX INTEGRITY $525,000Active4 beds 3 baths
137 Central Ave, Hackensack City, NJ 07601
MLS# 4026085Listed by: RE/MAX FIRST REALTY II $295,000Active1 beds 1 baths
20 Jefferson Street A8, Hackensack, NJ 07601
MLS# 26016291Listed by: PRESTIGE PROPERTY GROUP - MONTCLAIR $425,000Pending2 beds 2 baths
160 Overlook Avenue 11B, Hackensack, NJ 07601
MLS# 26015420Listed by: VIKKI HEALEY PROPERTIES, LLC $695,000Active-- beds 2 baths
278 High Street, Hackensack, NJ 07666
MLS# 26015938Listed by: XCEED REALTY $273,875Active1 beds 1 baths
300 Lookout Avenue C4, Hackensack, NJ 07601
MLS# 26016045Listed by: RE/MAX SIGNATURE HOMES $249,900Pending-- beds 1 baths
90 Prospect Avenue 10C, Hackensack, NJ 07601
MLS# 26016006Listed by: EXP REALTY, LLC - ENGLEWOOD CLIFFS $239,900Pending-- beds 1 baths
90 Prospect Avenue 8C, Hackensack, NJ 07601
MLS# 26015741Listed by: MENDEZ GRP LLC $519,000Pending3 beds 2 baths
54 Polifly 103, Hackensack, NJ 07601
MLS# 26014433Listed by: RE/MAX VILLA REALTORS-NORTH BERGEN $489,000Active2 beds 2 baths
131 Clinton Place 116, Hackensack, NJ 07601
MLS# 26015582Listed by: PROMINENT PROPERTIES SOTHEBY'S INTERNATIONAL REALTY-FRANKLIN LAKES $430,000Pending2 beds 2 baths
54 Polifly Road 104, Hackensack, NJ 07601
MLS# 25037208Listed by: CHRISTIE'S INTERNATIONAL REAL ESTATE GROUP-CLOSTER $469,000Active3 beds 2 baths
150 Overlook Avenue 7F, Hackensack, NJ 07601
MLS# 26015185Listed by: CHRISTIE'S INTERNATIONAL REAL ESTATE GROUP-FORT LEE $449,000Pending2 beds 2 baths
138 Old Hoboken Road, Hackensack, NJ 07601
MLS# 26004145Listed by: GILMORE REALTY, LLC $575,000Pending2 beds 1 baths
832 Summit Avenue, Hackensack, NJ 07601
MLS# 26014281Listed by: KELLER WILLIAMS VILLAGE SQUARE REALTY- Open Sat, 1 to 3pm
 $1,899,999Active-- beds -- baths
120-122 Lodi, Hackensack, NJ 07601
MLS# 26015121Listed by: RE/MAX PROPERTIES-SADDLE RIVER  $300,000Pending1 beds 1 baths
316 Prospect Avenue 10D, Hackensack, NJ 07601
MLS# 26014531Listed by: WEICHERT REALTORS, BRICK $310,000Pending2 beds 1 baths
241 Johnson Avenue M2, Hackensack, NJ 07601
MLS# 26014838Listed by: REALTY MARK CENTRAL $595,000Active3 beds 3 baths
277 3rd Street, Hackensack, NJ 07601
MLS# 26016656Listed by: ELITE REALTORS OF NEW JERSEY $699,000Active4 beds 3 baths
297 Hamilton Place, Hackensack, NJ 07601
MLS# 26014743Listed by: EXP REALTY, LLC $220,000Active1 beds 1 baths
303 Hamilton Place B4, Hackensack, NJ 07601
MLS# 26011593Listed by: LPT REALTY $299,999Active1 beds 1 baths
307 Prospect Avenue 4B, Hackensack, NJ 07601
MLS# 25043174Listed by: TERRIE O'CONNOR REALTORS-RIDGEWOOD $399,000Pending3 beds 2 baths
90 Prospect Avenue 7A, Hackensack, NJ 07601
MLS# 26013651Listed by: EXP REALTY, LLC $355,000Active2 beds 2 baths
105 State Street 1H, Hackensack, NJ 07601
MLS# 26013696Listed by: CHRISTIE'S INTERNATIONAL REAL ESTATE GROUP-PARAMUS $264,990Active1 beds 1 baths
344 Prospect 9G, Hackensack, NJ 07601
MLS# 26013774Listed by: MASUKO REALTY $399,000Pending3 beds 2 baths
90 Prospect Ave, Hackensack City, NJ 07601
MLS# 4021885Listed by: EXP REALTY, LLC $285,000Pending1 beds 1 baths
446 Passaic St #E, Hackensack City, NJ 07601
MLS# 4021757Listed by: KELLER WILLIAMS - NJ METRO GROUP $285,000Pending1 beds 1 baths
446 Passaic Street 6E, Hackensack, NJ 07601
MLS# 26013612Listed by: KELLER WILLIAMS REALTY - NJ METRO GROUP $650,000Active-- beds 3 baths
185 Hudson Street, Hackensack, NJ 07601
MLS# 26012735Listed by: COLDWELL BANKER, WYCKOFF/FRANKLIN LAKES $629,000Pending-- beds 2 baths
64 Davis Avenue, Hackensack, NJ 07601
MLS# 26013177Listed by: VIKKI HEALEY PROPERTIES, LLC $628,000Pending4 beds 3 baths
446 Maple Hill Dr, Hackensack City, NJ 07601
MLS# 4021388Listed by: COLDWELL BANKER REALTY RDG $284,995Active2 beds 2 baths
125 Prospect Avenue 10C, Hackensack, NJ 07601
MLS# 26012600Listed by: KELLER WILLIAMS VILLAGE SQUARE REALTY $899,000Active-- beds 3 baths
129 Hudson Street, Hackensack, NJ 07601
MLS# 26013023Listed by: RE/MAX PROPERTIES-SADDLE RIVER $699,000Pending4 beds 4 baths
73 S Prospect Avenue, Hackensack, NJ 07601
MLS# 26012222Listed by: KELLER WILLIAMS VILLAGE SQUARE REALTY $259,000Active0 Acres
353 Beech Street, Hackensack, NJ 07601
MLS# 26012848Listed by: CHRISTIE'S INTERNATIONAL REAL ESTATE GROUP-FRANKLIN LAKES $375,000Active0 Acres
75 Campbell Avenue, Hackensack, NJ 07601
MLS# 26012853Listed by: KELLER WILLIAMS PARK VIEWS $695,000Pending-- beds 2 baths
472 Passaic Street, Hackensack, NJ 07601
MLS# 26012457Listed by: KELLER WILLIAMS TOWN LIFE $323,000Active1 beds 1 baths
326 Prospect Avenue 6J, Hackensack, NJ 07601
MLS# 26012589Listed by: CORCORAN BAER & MCINTOSH $249,500Active1 beds 1 baths
151 Prospect Avenue 6C, Hackensack, NJ 07601
MLS# 26012377Listed by: KELLER WILLIAMS TOWN LIFE $319,999Active1 beds 1 baths
235 Prospect Avenue 2B, Hackensack, NJ 07601
MLS# 26010821Listed by: KELLER WILLIAMS TOWN LIFE $415,000Pending2 beds 2 baths
241 Union Street 302, Hackensack, NJ 07601
MLS# 26011362Listed by: KELLER WILLIAMS VILLAGE SQUARE REALTY $275,000Pending2 beds 1 baths
243 Johnson Avenue L4, Hackensack, NJ 07601
MLS# 26011872Listed by: LIST FOR 1 PERCENT REALTY $850,000Active-- beds 3 baths
190 Washington Avenue, Hackensack, NJ 07601
MLS# 26011993Listed by: CQR CONTINENTAL QUALITY REALTY $269,900Pending1 beds 1 baths
479 Maple Hill Drive 42, Hackensack, NJ 07601
MLS# 26011526Listed by: KELLER WILLIAMS TOWN LIFE $388,000Pending2 beds 2 baths
316 Prospect 11J, Hackensack, NJ 07601
MLS# 26011927Listed by: COLDWELL BANKER, RIDGEWOOD $679,000Pending-- beds 3 baths
142 S Main Street, Hackensack, NJ 07601
MLS# 26009798Listed by: TERRIE O'CONNOR REALTORS-HASBROUCK HEIGHTS $295,000Pending1 beds 1 baths
301 Beech Street 2F, Hackensack, NJ 07601
MLS# 26011575Listed by: TERRIE O'CONNOR REALTORS-HASBROUCK HEIGHTS $325,000Active2 beds 2 baths
55 Clinton Place 304, Hackensack, NJ 07601
MLS# 26010896Listed by: REALTY ONE GROUP SUNRISE $299,999Active1 beds 1 baths
326 Prospect Avenue 1A, Hackensack, NJ 07601
MLS# 26011229Listed by: UNITED REAL ESTATE $899,000Active3 beds 3 baths
378 Marvin Avenue, Hackensack, NJ 07601
MLS# 26011494Listed by: RE/MAX TRADING PLACES LLC - HASBROUCK HEIGHTS $299,900Active1 beds 1 baths
316 Prospect Ave #7E, Hackensack City, NJ 07601
MLS# 4018431Listed by: JEANIUS REALTY $439,000Active2 beds 2 baths
326 Prospect 11K, Hackensack, NJ 07601
MLS# 26011079Listed by: MASUKO REALTY $262,000Active1 beds 1 baths
208 Anderson St, Hackensack City, NJ 07601
MLS# 4018100Listed by: BRICE HOMES $262,000Pending1 beds 1 baths
208 Anderson Street S4C, Hackensack, NJ 07601
MLS# 26010964Listed by: BRICE HOMES $925,000Active-- beds 3 baths
126 Essex Street, Hackensack, NJ 07601
MLS# 26009678Listed by: ZEAL, REALTORS $329,900Active1 beds 1 baths
326 Prospect Avenue 11E, Hackensack, NJ 07601
MLS# 26010195Listed by: VIKKI HEALEY PROPERTIES, LLC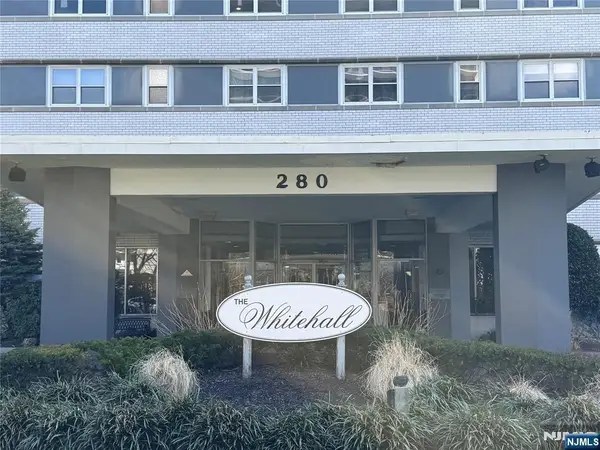 $109,000Active1 beds 1 baths
280 S Prospect Avenue 3N, Hackensack, NJ 07601
MLS# 26010455Listed by: COLDWELL BANKER, HILLSDALE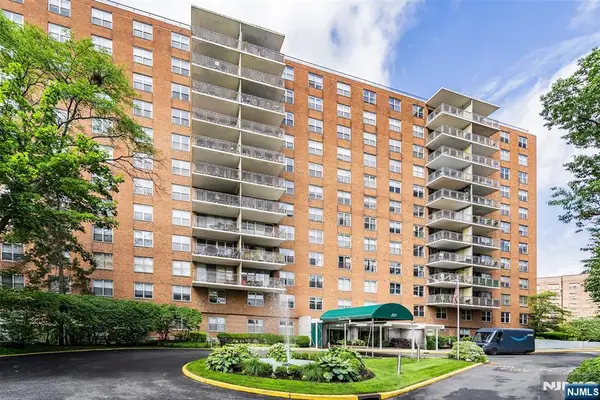 $275,000Active1 beds 1 baths
301 Beech Street 9K, Hackensack, NJ 07601
MLS# 26010625Listed by: VIKKI HEALEY PROPERTIES, LLC $334,000Pending2 beds 2 baths
75 Union Street 5E, Hackensack, NJ 07601
MLS# 26010662Listed by: COMPASS NEW JERSEY, LLC-RIDGEWOOD $258,000Active1 beds 1 baths
208 Anderson Street S4C, Hackensack, NJ 07601
MLS# 26010769Listed by: BRICE HOMES $729,000Active4 beds 2 baths
120 S Prospect Avenue, Hackensack, NJ 07601
MLS# 26010498Listed by: LIFESTYLE INTERNATIONAL REALTY $225,000Pending2 beds 2 baths
125 Prospect Avenue 5B, Hackensack, NJ 07601
MLS# 26010141Listed by: VIKKI HEALEY PROPERTIES, LLC $299,000Pending2 beds 1 baths
418 Esplanade 6, Hackensack, NJ 07601
MLS# 26010472Listed by: REAL $828,888Active4 beds 4 baths
436 Anderson Street, Hackensack, NJ 07601
MLS# 26010503Listed by: REAL $625,000Pending3 beds 2 baths
278 Marvin Ave, Hackensack City, NJ 07601
MLS# 4017560Listed by: C-21 GEMINI, LLC. $875,000Active5 beds 4 baths
467 Summit Avenue, Hackensack, NJ 07601
MLS# 26010428Listed by: SERHANT NEW JERSEY LLC $389,000Pending2 beds 2 baths
140 Euclid Avenue 1G, Hackensack, NJ 07601
MLS# 26009588Listed by: CENTURY 21 CONCEPT 100 $299,000Active1 beds 1 baths
25 Jefferson Street 4E, Hackensack, NJ 07601
MLS# 26009866Listed by: PRESTIGE PROPERTY GROUP - MONTCLAIR $344,900Active3 beds 1 baths
26 Van Orden Place, Hackensack, NJ 07601
MLS# 26010115Listed by: REALMART REALTY, LLC $249,000Pending1 beds 1 baths
980 Main Street C1, Hackensack, NJ 07601
MLS# 26009820Listed by: KELLER WILLIAMS VILLAGE SQUARE REALTY $579,000Pending3 beds 1 baths
133 Willow Avenue, Hackensack, NJ 07601
MLS# 26009877Listed by: COLDWELL BANKER, HILLSDALE $321,000Active2 beds 1 baths
208 Anderson Street S5A, Hackensack, NJ 07601
MLS# 26009552Listed by: PROMINENT PROPERTIES SOTHEBY'S INTERNATIONAL REALTY-HOBOKEN $249,900Pending1 beds 1 baths
9 Vreeland Street 2F, Hackensack, NJ 07601
MLS# 26009577Listed by: NJ PROPERTY SOLUTIONS REALTY, LLC $319,000Pending1 beds 1 baths
277 Prospect Avenue 14B, Hackensack, NJ 07601
MLS# 26009191Listed by: COMPASS NEW JERSEY, LLC-HOBOKEN $115,000Pending1 beds 1 baths
280 Prospect 6J, Hackensack, NJ 07601
MLS# 26008901Listed by: RE/MAX PROPERTIES-SADDLE RIVER $99,999Active1 beds 1 baths
280 Prospect Avenue 5D, Hackensack, NJ 07601
MLS# 26008953Listed by: COLDWELL BANKER, ALPINE/CLOSTER $164,999Active-- beds 1 baths
303 Hamilton Avenue Bas 1, Hackensack, NJ 07601
MLS# 26007859Listed by: YES-CASA HOME REAL ESTATE $359,999Pending2 beds 2 baths
326 Prospect Avenue 10H, Hackensack, NJ 07601
MLS# 26007925Listed by: ELITE REALTORS OF NEW JERSEY $289,000Active1 beds 1 baths
277 Prospect Avenue 4A, Hackensack, NJ 07601
MLS# 26007949Listed by: RE/MAX NOW - PALISADES PARK $650,000Active4 beds 3 baths
418 Taylor Avenue, Hackensack, NJ 07601
MLS# 26007999Listed by: KELLER WILLIAMS VILLAGE SQUARE REALTY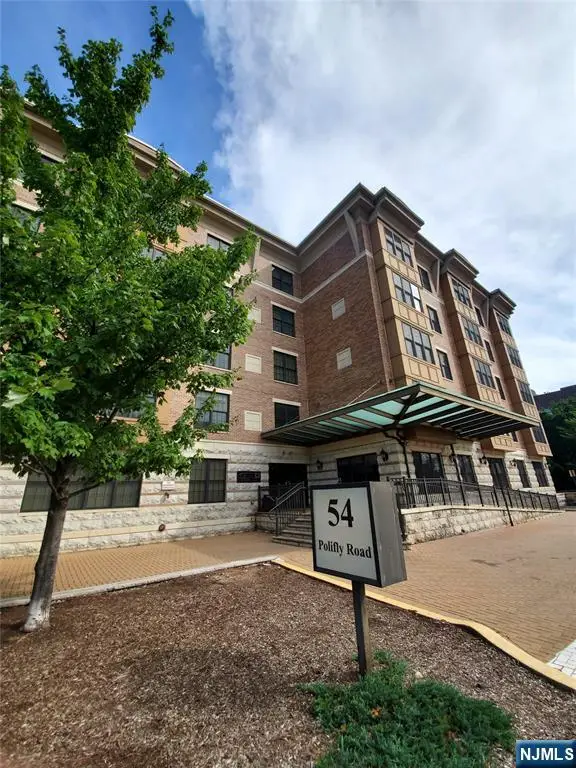 $465,000Pending2 beds 2 baths
54 Polifly Road 201, Hackensack, NJ 07601
MLS# 26007500Listed by: KELLER WILLIAMS TOWN LIFE $550,000Pending3 beds 2 baths
285 Berry, HACKENSACK, NJ 07601
MLS# NJBG2000296Listed by: REALTYMARK PROPERTIES $675,000Active3 beds 2 baths
120 Louis Street, Hackensack, NJ 07601
MLS# 26006179Listed by: CENTURY 21 GENTRY REALTORS $199,000Pending1 beds 1 baths
125 Prospect Avenue 17G, Hackensack, NJ 07601
MLS# 26006701Listed by: COLDWELL BANKER, ALPINE/CLOSTER $325,000Active2 beds 2 baths
151 Prospect Avenue 9D, Hackensack, NJ 07601
MLS# 26006738Listed by: KELLER WILLIAMS CITY VIEWS REALTY $599,900Pending3 beds 2 baths
32 Martin Terrace, Hackensack, NJ 07601
MLS# 26006737Listed by: KELLER WILLIAMS PROSPERITY $580,000Active2 beds 2 baths
160 Overlook Avenue 4C, Hackensack, NJ 07601
MLS# 26005895Listed by: WEICHERT REALTORS, FORT LEE $1,300,000Pending-- beds -- baths
467 Hudson Street, Hackensack, NJ 07601
MLS# 26005742Listed by: KELLER WILLIAMS CITY VIEWS REALTY $625,000Pending2 beds 2 baths
149 Allen Street, Hackensack, NJ 07601
MLS# 26005506Listed by: EREALTY GROUP LLC $948,000Active3 beds 3 baths
378 Marvin Avenue, Hackensack, NJ 07601
MLS# 26004925Listed by: RE/MAX TRADING PLACES LLC - HASBROUCK HEIGHTS $697,000Pending-- beds 2 baths
311 Marvin Avenue, Hackensack, NJ 07601
MLS# 26004013Listed by: EXIT GOLDEN REALTY GROUP, LLC $315,000Active2 beds 2 baths
151 Prospect Avenue 16D, Hackensack, NJ 07601
MLS# 26003614Listed by: KELLER WILLIAMS TOWN LIFE $785,000Pending4 beds 3 baths
258 Clinton Place, Hackensack, NJ 07601
MLS# 26004121Listed by: VETERAN REAL ESTATE GROUP $299,999Active1 beds 1 baths
277 Prospect Avenue 18H, Hackensack, NJ 07601
MLS# 26003933Listed by: COLDWELL BANKER, HILLSDALE $549,000Pending-- beds 2 baths
99 Kansas Street, Hackensack, NJ 07601
MLS# 26003567Listed by: UNITED REAL ESTATE $489,000Active3 beds 2 baths
150 Overlook Avenue 7F, Hackensack, NJ 07601
MLS# 26003248Listed by: CHRISTIE'S INTERNATIONAL REAL ESTATE GROUP-FORT LEE $325,000Active2 beds 2 baths
344 Prospect Avenue 2E, Hackensack, NJ 07601
MLS# 26003094Listed by: SOCIETY REAL ESTATE $678,000Pending4 beds 3 baths
431 Blanchard Ter, Hackensack City, NJ 07601
MLS# 4007173Listed by: MODERN REALTY GROUP $215,000Active1 beds 1 baths1,040 sq. ft.
280 Prospect Ave #9H, Hackensack City, NJ 07601
MLS# 4006953Listed by: REDFIN CORPORATION $569,999Pending4 beds 3 baths
409 W Anderson Street, Hackensack, NJ 07601
MLS# 26002838Listed by: COMPASS NEW JERSEY, LLC-RIDGEWOOD $349,000Pending2 beds 1 baths
326 Prospect Avenue 8E, Hackensack, NJ 07601
MLS# 26001724Listed by: CHRISTIE'S INTERNATIONAL REAL ESTATE GROUP-PARAMUS $825,000Active5 beds 3 baths
106 Clarendon Place, Hackensack, NJ 07601
MLS# 26002553Listed by: NEXTHOME PREMIER $399,000Active2 beds 1 baths
115 Kansas St, Hackensack City, NJ 07601
MLS# 4006034Listed by: COLDWELL BANKER GARDEN STATE $749,000Active4 beds 2 baths
181 Allen Street, Hackensack, NJ 07601
MLS# 26001313Listed by: COLDWELL BANKER, MIDDLETOWN $725,000Active4 beds 3 baths
297 Hamilton Place, Hackensack, NJ 07601
MLS# 25043758Listed by: EXP REALTY, LLC $299,900Pending1 beds 1 baths
307 Prospect Ave #17D, Hackensack City, NJ 07601
MLS# 4005180Listed by: REAL $1,300,000Active0.18 Acres
433 Park St, Hackensack City, NJ 07601
MLS# 4004893Listed by: PRESTIGE PROPERTY GROUP MONTCLAIR $274,999Pending1 beds 1 baths
300 Lookout Avenue C4, Hackensack, NJ 07601
MLS# 26000623Listed by: RE/MAX SIGNATURE HOMES $334,900Active1 beds 1 baths
25 Jefferson Street 3D, Hackensack, NJ 07601
MLS# 26000292Listed by: LISTWITHFREEDOM.COM $749,000Pending3 beds 3 baths
75 Pine Street, Hackensack, NJ 07601
MLS# 25043567Listed by: COLDWELL BANKER, FORT LEE $135,000Active1 beds 1 baths
280 Prospect Avenue 11H, Hackensack, NJ 07601
MLS# 25041648Listed by: RUSSO REAL ESTATE $339,000Active2 beds 2 baths
75 Union Street 5E, Hackensack, NJ 07601
MLS# 25042575Listed by: COMPASS NEW JERSEY, LLC-RIDGEWOOD $950,000Active-- beds 4 baths
252 Berry Street, Hackensack, NJ 07601
MLS# 25042111Listed by: BETTER HOMES & GARDENS REAL ESTATE EXCLUSIVE PROPERTIES $799,000Pending2 beds 2 baths
67 Spring Valley Avenue, Hackensack, NJ 07601
MLS# 25040555Listed by: COLDWELL BANKER, JERSEY CITY $799,000Pending4 beds 4 baths
81 Fairmount Ave, Hackensack City, NJ 07601
MLS# 4003933Listed by: GILD REALTY $350,000Pending3 beds 2 baths
30 Willow Avenue, Hackensack, NJ 07601
MLS# 25040168Listed by: KELLER WILLIAMS PARK VIEWS REALTY 3 GROUP $799,000Active-- beds 3 baths
314 Atlantic Street, Hackensack, NJ 07601
MLS# 25040466Listed by: COLDWELL BANKER GARDEN STATE $220,000Active1 beds 1 baths
125 Prospect Avenue 17G, Hackensack, NJ 07601
MLS# 25040013Listed by: COLDWELL BANKER, ALPINE/CLOSTER $440,000Pending3 beds 1 baths
395 2nd Street, Hackensack, NJ 07601
MLS# 25035332Listed by: EXP REALTY, LLC $429,000Active2 beds 2 baths
115 Polifly Road 4F, Hackensack, NJ 07601
MLS# 25037607Listed by: RE/MAX PROPERTIES-SADDLE RIVER $700,000Active3 beds 3 baths
328 Fairmount Avenue, Hackensack, NJ 07601
MLS# 26006091Listed by: COLDWELL BANKER, UPPER MONTCLAIR $299,000Active2 beds 2 baths
125 Prospect Avenue 10C, Hackensack, NJ 07601
MLS# 25037896Listed by: REAL $398,000Pending2 beds 2 baths
39 Union Street 105, Hackensack, NJ 07601
MLS# 25036922Listed by: CENTURY 21 CONCEPT 100 $479,000Active3 beds 2 baths
90 Prospect Avenue 2A, Hackensack, NJ 07601
MLS# 25036389Listed by: COLDWELL BANKER, ALPINE/CLOSTER $249,000Pending1 beds 1 baths
9 Vreeland Avenue 3A, Hackensack, NJ 07601
MLS# 25035791Listed by: REAL $330,000Active1 beds 1 baths
326 Prospect Avenue 6J, Hackensack, NJ 07601
MLS# 25034772Listed by: CORCORAN BAER & MCINTOSH $235,000Active-- beds 1 baths
303 Hamilton Place D4, Hackensack, NJ 07601
MLS# 25034069Listed by: AGENCY ON THE AVE, LLC $899,999Active5 beds 4 baths
467 Summit Avenue, Hackensack, NJ 07601
MLS# 26007655Listed by: SERHANT NEW JERSEY LLC $114,000Pending1 beds 1 baths
151 Prospect Avenue 18A, Hackensack, NJ 07601
MLS# 25032090Listed by: HOWARD HANNA RAND REALTY, ENGLEWOOD CLIFFS $499,000Pending3 beds 2 baths
448 Sutton Avenue, Hackensack, NJ 07601
MLS# 25027420Listed by: EXP REALTY, LLC $720,000Pending4 beds 3 baths
149 Union St, Hackensack City, NJ 07601
MLS# 3981690Listed by: KELLER WILLIAMS CITY VIEWS REALTY $649,900Pending-- beds 3 baths
418 Taylor Avenue, Hackensack, NJ 07601
MLS# 25027032Listed by: KELLER WILLIAMS VILLAGE SQUARE REALTY $360,000Pending2 beds 2 baths
307 Prospect Avenue 16A, Hackensack, NJ 07601
MLS# 25027041Listed by: CHRISTIE'S INTERNATIONAL REAL ESTATE GROUP-MAHWAH/SADDLE RIVER REGIONAL OFFICE $429,000Active3 beds 1 baths
113 Kansas Street, Hackensack, NJ 07601
MLS# 26001791Listed by: COLDWELL BANKER GARDEN STATE $109,000Pending1 beds 1 baths
280 Prospect Avenue 3N, Hackensack, NJ 07601
MLS# 26003200Listed by: KELLER WILLIAMS VALLEY REALTY $430,000Pending2 beds 2 baths
420 Passaic Street 2G, Hackensack, NJ 07601
MLS# 25010238Listed by: UNITED REAL ESTATE $549,000Pending3 beds 3 baths1,536 sq. ft.
163 Kent St, Hackensack City, NJ 07601
MLS# 3949613Listed by: PROMINENT PROPERTIES SIR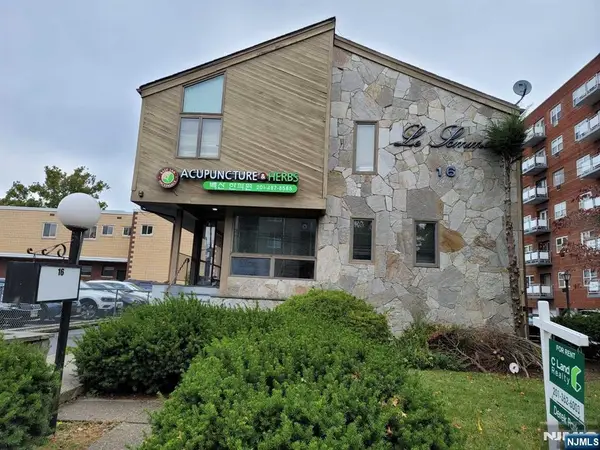 $1,095,000Pending-- beds -- baths
16 Jefferson Street, Hackensack, NJ 07601
MLS# 25030170Listed by: C LAND REALTY CO. $399,000Pending3 beds 1 baths
181 Berdan Place, Hackensack, NJ 07601
MLS# 25001984Listed by: PROMINENT PROPERTIES SOTHEBY'S INTERNATIONAL REALTY-ALPINE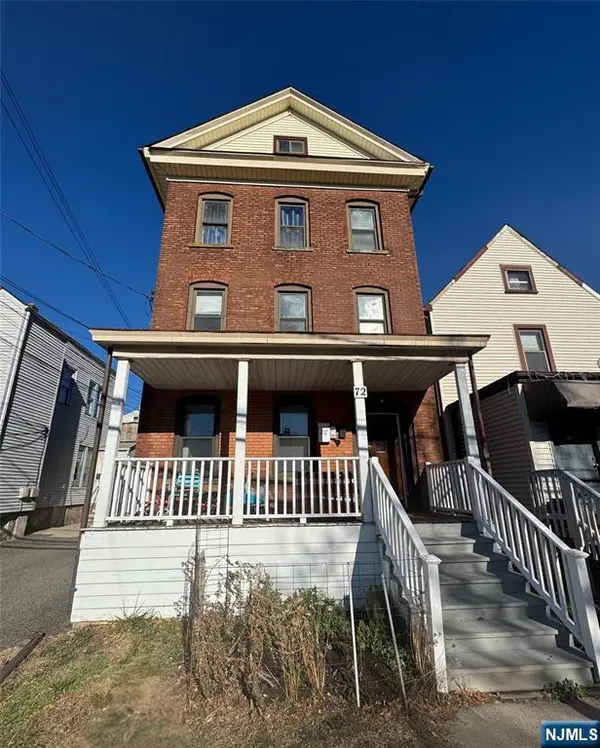 $749,000Pending-- beds 3 baths
72 Lawrence Street, Hackensack, NJ 07601
MLS# 25000830Listed by: COLDWELL BANKER GARDEN STATE $259,000Pending0 Acres
353 Beech Street, Hackensack, NJ 07601
MLS# 24034565Listed by: CHRISTIE'S INTERNATIONAL REAL ESTATE GROUP-FRANKLIN LAKES $499,000Pending3 beds 3 baths
15 Zabriskie Street 1505, Hackensack, NJ 07601
MLS# 23026210Listed by: REDFIN CORPORATION
Local realty services provided by:CENTURY 21 Semiao & Associates, CENTURY 21 Crest Real Estate, Inc., CENTURY 21 Norris - Valley Forge
The data relating to the real estate for sale on this web site comes in part from the Internet Data Exchange Program of the NJMLS. Real estate listings held by brokerage firms other than CENTURY 21 Semiao & Associates are marked with the Internet Data Exchange logo and information about them includes the name of the listing brokers. Some properties listed with the participating brokers do not appear on this website at the request of the seller. Listings of brokers that do not participate in Internet Data Exchange do not appear on this website.
All information deemed reliable but not guaranteed. Last date updated: June 5, 2026. Source: New Jersey Multiple Listing Service, Inc.
2026 New Jersey Multiple Listing Service, Inc. All rights reserved. NJ_MLS Member Broker: Fernando G Semiao
The data relating to real estate for sale on this website comes in part from the IDX Program of Garden State Multiple Listing Service, L.L.C. Real estate listings held by other brokerage firms are marked as IDX Listing. Information deemed reliable but not guaranteed. 2026 Garden State Multiple Listing Service, L.L.C. All rights reserved. Notice: The dissemination of listings on this website does not constitute the consent required by N.J.A.C. 11:5.6.1 (n) for the advertisement of listings exclusively for sale by another broker. Any such consent must be obtained in writing from the listing broker. This information is being provided for Consumers' personal, non-commercial use and may not be used for any purpose other than to identify prospective properties Consumers may be interested in purchasing. Date Last Updated October 21, 2025 NJ_GSMLS Member Broker: Patricia R Wojtyszyn
The data relating to real estate for sale on this web-site comes in part from the Internet Listing Display database of the CENTRAL JERSEY MULTIPLE LISTING SYSTEM, INC. Real estate listings held by brokerage firms other than this site-owner are marked with the ILD logo. The CENTRAL JERSEY MULTIPLE LISTING SYSTEM, INC does not warrant the accuracy, quality, reliability, suitability, completeness, usefulness or effectiveness of any information provided. The information being provided is for consumers' personal, non-commercial use and may not be used for any purpose other than to identify properties the consumer may be interested in purchasing or renting. Copyright 2026, CENTRAL JERSEY MULTIPLE LISTING SYSTEM, INC. All rights reserved”. The CENTRAL JERSEY MULTIPLE LISTING SYSTEM, INC retains all rights, title and interest in and to its trademarks, service marks and copyrighted material. NJ_MCMLS Member Broker: Fernando G Semiao
Neighborhoods near Hackensack, NJ
Zip codes near Hackensack, NJ
- 07026 homes for sale
- 07057 homes for sale
- 07074 homes for sale
- 07075 homes for sale
- 07601 homes for sale
- 07603 homes for sale
- 07604 homes for sale
- 07605 homes for sale
- 07606 homes for sale
- 07607 homes for sale
- 07621 homes for sale
- 07643 homes for sale
- 07644 homes for sale
- 07646 homes for sale
- 07650 homes for sale
- 07660 homes for sale
- 07661 homes for sale
- 07662 homes for sale
- 07663 homes for sale
- 07666 homes for sale
Popular searches near Hackensack, NJ
- Bergenfield homes for sale
- Bogota homes for sale
- Elmwood Park homes for sale
- Englewood homes for sale
- Garfield homes for sale
- Hasbrouck Heights homes for sale
- Leonia homes for sale
- Little Ferry homes for sale
- Lodi homes for sale
- Maywood homes for sale
- Moonachie homes for sale
- New Milford homes for sale
- Palisades Park homes for sale
- Ridgefield Park homes for sale
- River Edge homes for sale
- Rochelle Park homes for sale
- Saddle Brook homes for sale
- Teaneck homes for sale
- Wallington homes for sale
- Wood-Ridge homes for sale
Protect your home and budget from life's surprises with an Assurant Home Warranty, backed by a partner that supports you through every step of homeownership. Explore Plans.
©2026 Century 21 Real Estate LLC. All rights reserved. CENTURY 21®, the CENTURY 21 Logo and C21® are service marks owned by Century 21 Real Estate LLC. Century 21 Real Estate LLC fully supports the principles of the Fair Housing Act and the Equal Opportunity Act. Each office is independently owned and operated. Listing information is deemed reliable but not guaranteed accurate.