- Chester homes for sale
- Chester homes for sale
- Chester Center homes for sale
- Deep River homes for sale
- Deep River homes for sale
- Deep River Center homes for sale
- East Haddam homes for sale
- East Haddam homes for sale
- East Hampton homes for sale
- East Hampton homes for sale
- East Hampton town homes for sale
- Haddam homes for sale
- Haddam homes for sale
- Higganum homes for sale
- Higganum homes for sale
- Killingworth homes for sale
- Killingworth homes for sale
- Middle Haddam homes for sale
- Moodus homes for sale
- Moodus homes for sale
06438, CT - homes for sale
13 of 13 results displayed
- New
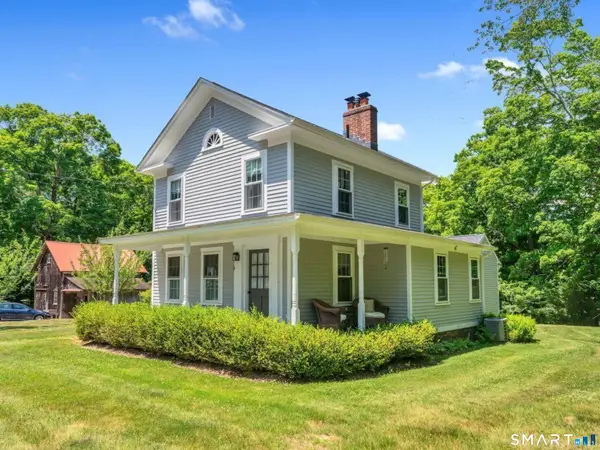 $625,000Active3 beds 3 baths1,695 sq. ft.
2 Timms Hill Road, Haddam, CT 06438
MLS# 24185591Listed by: Coldwell Banker Realty - Open Sat, 11am to 2pmNew
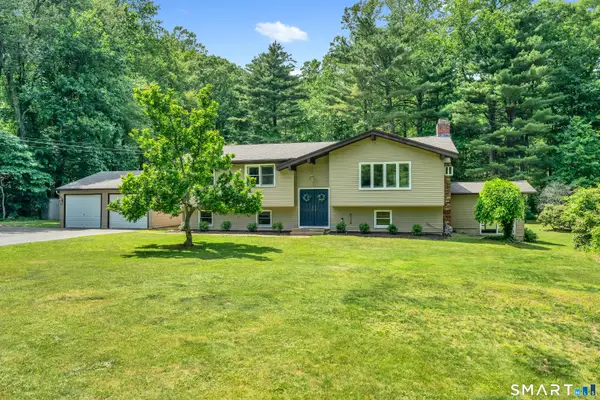 $554,000Active3 beds 2 baths2,418 sq. ft.
384 Beaver Meadow Road, Haddam, CT 06438
MLS# 24182456Listed by: William Raveis Real Estate - Open Sun, 11am to 2pmNew
 $1,095,000Active5 beds 3 baths3,741 sq. ft.
8 Meeting House Road, Haddam, CT 06438
MLS# 24182878Listed by: William Pitt Sotheby's Int'l  $415,000Pending3 beds 2 baths1,800 sq. ft.
254 Park Road, Haddam, CT 06438
MLS# 24183303Listed by: William Pitt Sotheby's Int'l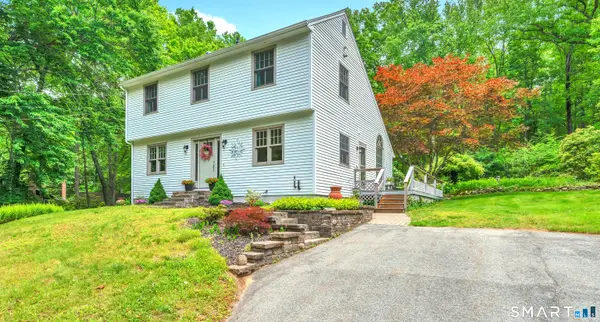 $449,000Pending3 beds 2 baths2,074 sq. ft.
57 Weiss Road, Haddam, CT 06438
MLS# 24182044Listed by: William Pitt Sotheby's Int'l $200,000Active3.23 Acres
1143 Saybrook Road, Haddam, CT 06438
MLS# 24176107Listed by: iHeart Homes Real Estate LLC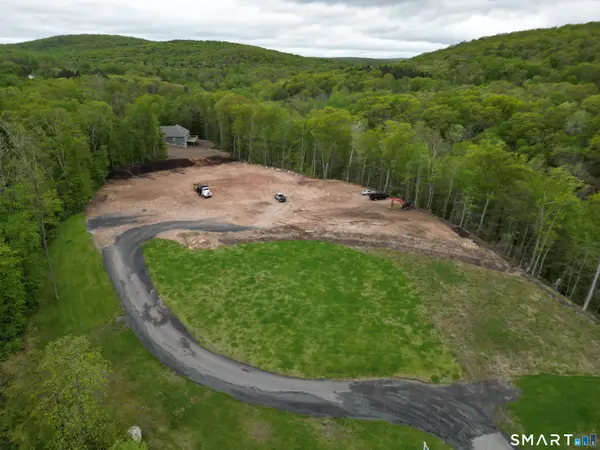 $225,000Active3.37 Acres
1145 Saybrook Road, Haddam, CT 06438
MLS# 24176125Listed by: iHeart Homes Real Estate LLC $425,000Active6.6 Acres
1143 & 1145 Saybrook Road, Haddam, CT 06438
MLS# 24176128Listed by: iHeart Homes Real Estate LLC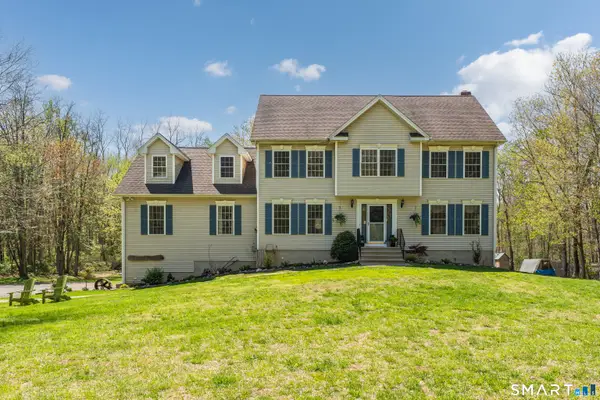 $679,000Active4 beds 3 baths3,168 sq. ft.
57 Hubbard Road, Haddam, CT 06438
MLS# 24172661Listed by: William Pitt Sotheby's Int'l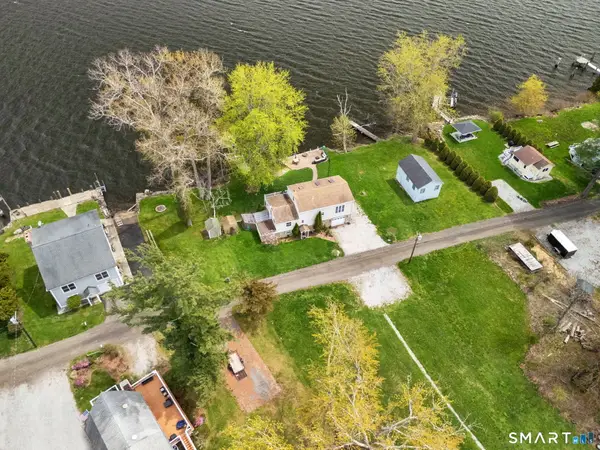 $900,000Pending2 beds 1 baths2,736 sq. ft.
84 Little Meadow Road, Haddam, CT 06438
MLS# 24171385Listed by: Premier Re Group LLC $115,000Active2.29 Acres
428-LOT Plains Road, Haddam, CT 06438
MLS# 24168087Listed by: William Raveis Real Estate $249,900Pending5.55 Acres
25 Island Dock Road, Haddam, CT 06438
MLS# 24106620Listed by: Coldwell Banker Realty $149,900Pending3.12 Acres
Parmelee Road, Haddam, CT 06438
MLS# 24106646Listed by: Coldwell Banker Realty
Local realty services provided by:CENTURY 21 Alliance Realty Group
The data relating to real estate for sale on this website appears in part through the SMARTMLS Internet Data Exchange program, a voluntary cooperative exchange of property listing data between licensed real estate brokerage firms, and is provided by SMARTMLS through a licensing agreement. Listing information is from various brokers who participate in the SMARTMLS IDX program and not all listings may be visible on the site. The property information being provided on or through the website is for the personal, non-commercial use of consumers and such information may not be used for any purpose other than to identify prospective properties consumers may be interested in purchasing. Some properties which appear for sale on the website may no longer be available because they are for instance, under contract, sold or are no longer being offered for sale. Property information displayed is deemed reliable but is not guaranteed. Copyright 2026 SmartMLS, Inc. CT Member Broker: Joseph Pettinella
Popular searches near 06438
Popular neighborhoods near 06438
- East Hartford Gardens, East Hartford homes for sale
- East Hartford Gardens, East Hartford homes for sale
- East Side, Manchester homes for sale
- East Side, Manchester homes for sale
- Forbes Village, East Hartford homes for sale
- Forbes Village, East Hartford homes for sale
- Forest Village, East Hartford homes for sale
- Forest Village, East Hartford homes for sale
- Hockanum, East Hartford homes for sale
- Hockanum, East Hartford homes for sale
- Keeney, Manchester homes for sale
- Keeney, Manchester homes for sale
- Martins, Manchester homes for sale
- Martins, Manchester homes for sale
- South End, Hartford homes for sale
- South End, Hartford homes for sale
- South West, Hartford homes for sale
- Spring Lake Village, Southington homes for sale
- West Side, Manchester homes for sale
- West Side, Manchester homes for sale
Counties near Haddam, 06438
- Capitol County homes for sale
- Fairfield County homes for sale
- Greater Bridgeport County homes for sale
- Hampden County homes for sale
- Hartford County homes for sale
- Litchfield County homes for sale
- Lower Connecticut River Valley County homes for sale
- Middlesex County homes for sale
- Naugatuck Valley County homes for sale
- New Haven County homes for sale
- New London County homes for sale
- Northeastern Connecticut County homes for sale
- Northwest Hills County homes for sale
- South Central Connecticut County homes for sale
- Southeastern Connecticut County homes for sale
- Suffolk County homes for sale
- Tolland County homes for sale
- Washington County homes for sale
- Western Connecticut County homes for sale
- Windham County homes for sale
Protect your home and budget from life's surprises with an Assurant Home Warranty, backed by a partner that supports you through every step of homeownership. Explore Plans.
©2026 Century 21 Real Estate LLC. All rights reserved. CENTURY 21®, the CENTURY 21 Logo and C21® are service marks owned by Century 21 Real Estate LLC. Century 21 Real Estate LLC fully supports the principles of the Fair Housing Act and the Equal Opportunity Act. Each office is independently owned and operated. Listing information is deemed reliable but not guaranteed accurate.