- Arlington Heights, Milwaukee homes for sale
- Borchert Field, Milwaukee homes for sale
- Brewer's Hill, Milwaukee homes for sale
- Cambridge Heights, Milwaukee homes for sale
- Downtown, Milwaukee homes for sale
- Fond du Lac and North, Milwaukee homes for sale
- Franklin Heights, Milwaukee homes for sale
- Halyard Park, Milwaukee homes for sale
- Kilbourn Town, Milwaukee homes for sale
- Lower East Side, Milwaukee homes for sale
- Murray Hill, Milwaukee homes for sale
- North Division, Milwaukee homes for sale
- Northeast, Milwaukee homes for sale
- Northpoint, Milwaukee homes for sale
- Park West, Milwaukee homes for sale
- Riverwest, Milwaukee homes for sale
- Triangle North, Milwaukee homes for sale
- Upper East Side, Milwaukee homes for sale
- Williamsburg, Milwaukee homes for sale
- Yankee Hill, Milwaukee homes for sale
Harambee, Milwaukee, WI - homes for sale
43 of 43 results displayed
- New
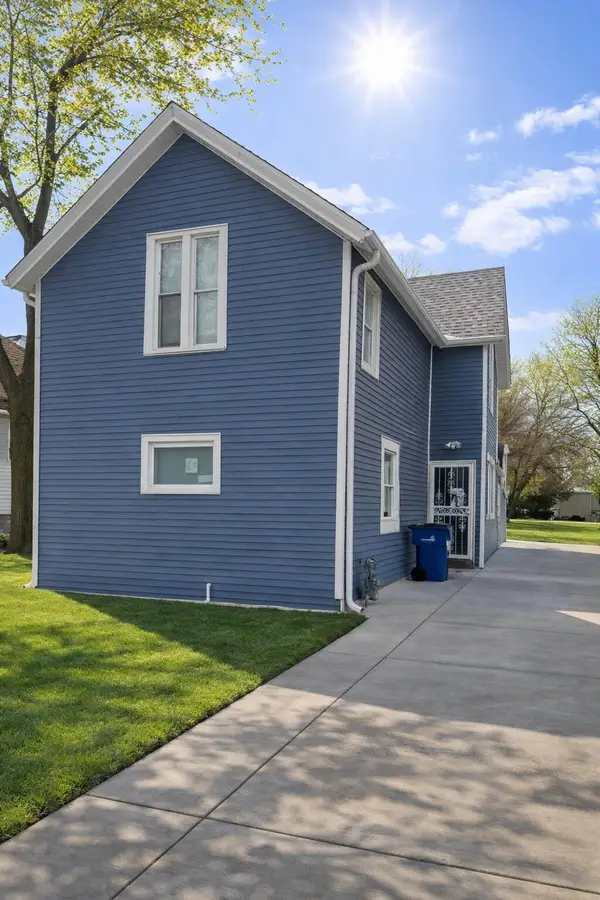 $240,000Active4 beds 2 baths1,907 sq. ft.
2338-2340 N 7th St, Milwaukee, WI 53212
MLS# 1955656Listed by: GARDNER & ASSOCIATES REAL ESTATE AND INVESTMENT FIRM - New
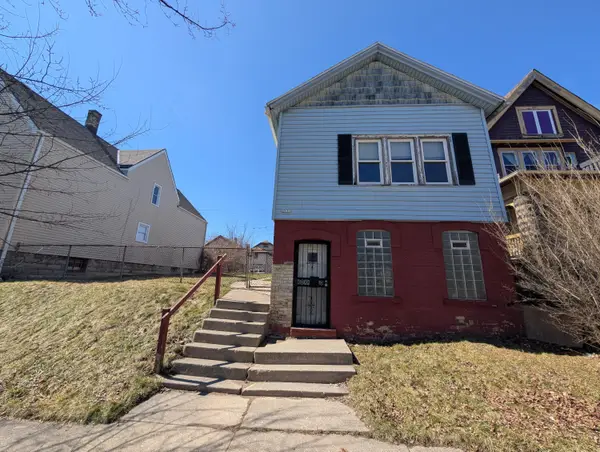 $160,000Active2 beds 1 baths934 sq. ft.
2531 N Buffum St, Milwaukee, WI 53212
MLS# 1955564Listed by: MCKENNA REAL ESTATE LLC - New
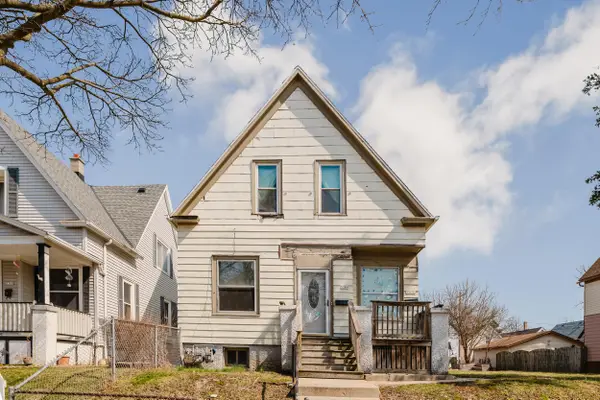 $169,900Active-- beds -- baths1,858 sq. ft.
3358 N Richards St, Milwaukee, WI 53212
MLS# 1955369Listed by: KELLER WILLIAMS-MNS WAUWATOSA - New
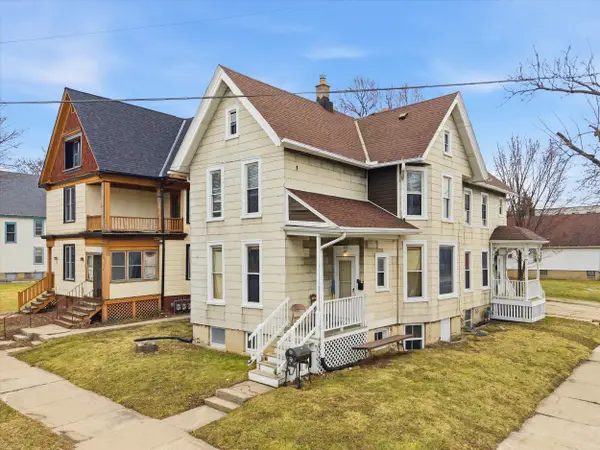 $175,000Active-- beds -- baths2,261 sq. ft.
639 W Meinecke Ave, Milwaukee, WI 53212
MLS# 1955353Listed by: SNSHN REALTY LLC - New
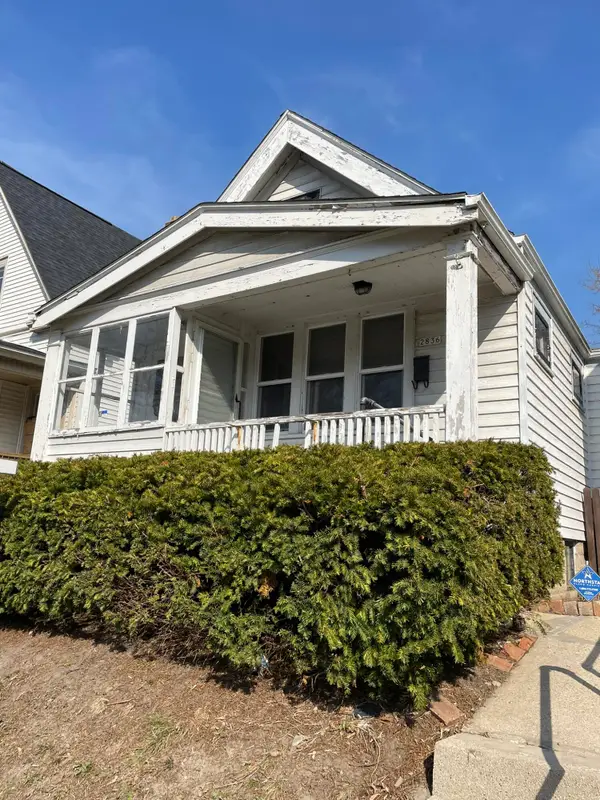 $135,000Active2 beds 1 baths871 sq. ft.
2836 N Richards St, Milwaukee, WI 53212
MLS# 1955293Listed by: LANNON STONE REALTY LLC - New
 $295,000Active-- beds -- baths3,686 sq. ft.
2441 N 1st St, Milwaukee, WI 53212
MLS# 1955296Listed by: MAHLER SOTHEBY'S INTERNATIONAL REALTY - New
 $325,000Active-- beds -- baths2,623 sq. ft.
3143 N Holton St, Milwaukee, WI 53212
MLS# 1954718Listed by: KELLER WILLIAMS MILWAUKEE SOUTH SHORE  $169,900Active-- beds -- baths1,531 sq. ft.
134 E Concordia Ave, Milwaukee, WI 53212
MLS# 1954697Listed by: TRELORA REALTY, INC. $25,000Pending0.42 Acres
3456 N Buffum St, Milwaukee, WI 53212
MLS# 1954648Listed by: RE/MAX LAKESIDE-NORTH $269,900Active3 beds 2 baths1,290 sq. ft.
3341 N Richards St, Milwaukee, WI 53212
MLS# 1954318Listed by: REALTY EXPERTS $209,900Pending-- beds -- baths2,374 sq. ft.
3139 N Buffum St, Milwaukee, WI 53212
MLS# 1954019Listed by: KELLER WILLIAMS REALTY-MILWAUKEE NORTH SHORE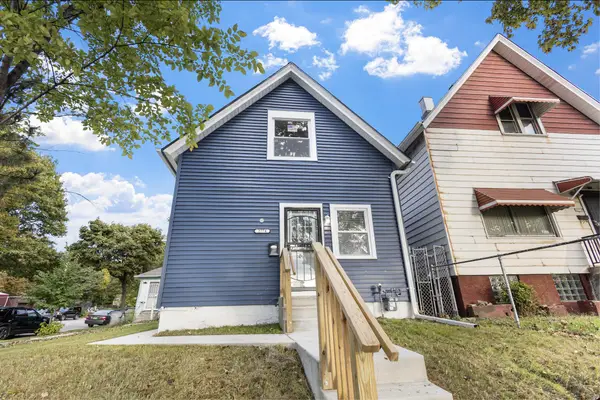 $160,000Pending3 beds 2 baths1,640 sq. ft.
2774 N 7th St, Milwaukee, WI 53212
MLS# 1953678Listed by: REAL BROKER MILWAUKEE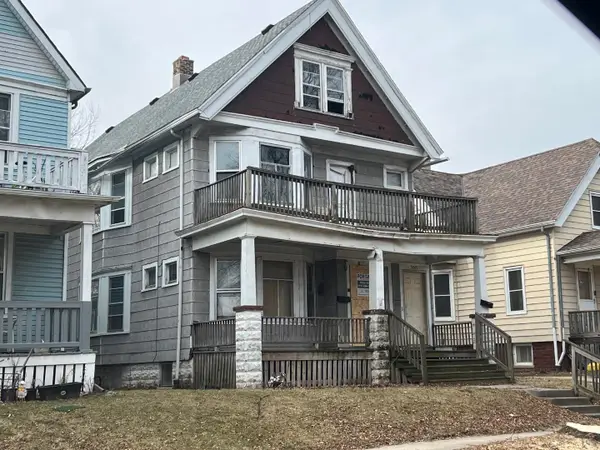 $69,000Active-- beds -- baths2,412 sq. ft.
3341 N Buffum St, Milwaukee, WI 53212
MLS# 1952963Listed by: REALTY AMONG FRIENDS, LLC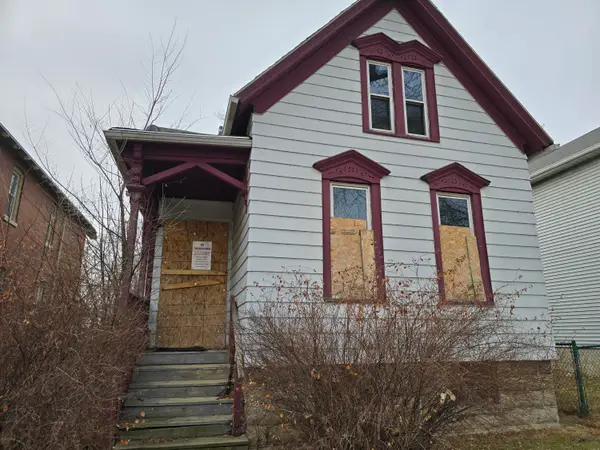 $74,400Active4 beds 1 baths1,201 sq. ft.
2935 N Vel R Phillips Ave, Milwaukee, WI 53212
MLS# 1952927Listed by: BOARDWALK REALTY LLC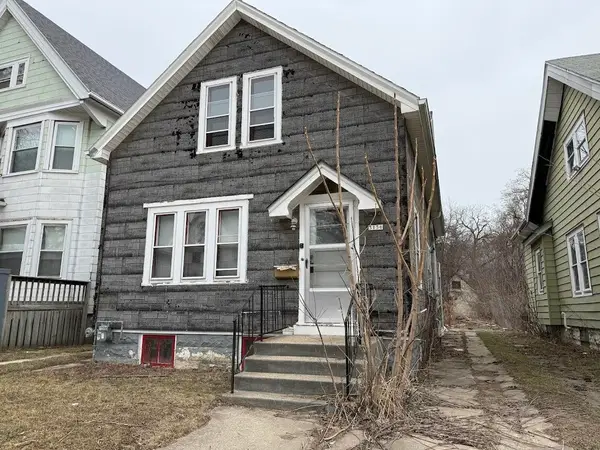 $50,000Active6 beds 1 baths1,245 sq. ft.
3156 N 6th St, Milwaukee, WI 53212
MLS# 1952942Listed by: HOMESTEAD REALTY, INC $60,000Active-- beds -- baths2,598 sq. ft.
3153 N Buffum St, Milwaukee, WI 53212
MLS# 1952953Listed by: HOMESTEAD REALTY, INC $45,000Active2 beds 2 baths958 sq. ft.
3419 N 2nd St, Milwaukee, WI 53212
MLS# 1952724Listed by: THE ROSEMONT GROUP REALTY LLC $8,000Active3 beds 1 baths1,126 sq. ft.
2846 N 6th St, Milwaukee, WI 53212
MLS# 1952574Listed by: WHITTEN REALTY $369,800Active5 beds 4 baths2,604 sq. ft.
2356 N 1st St, Milwaukee, WI 53212
MLS# 1952161Listed by: SHOREWEST REALTORS, INC.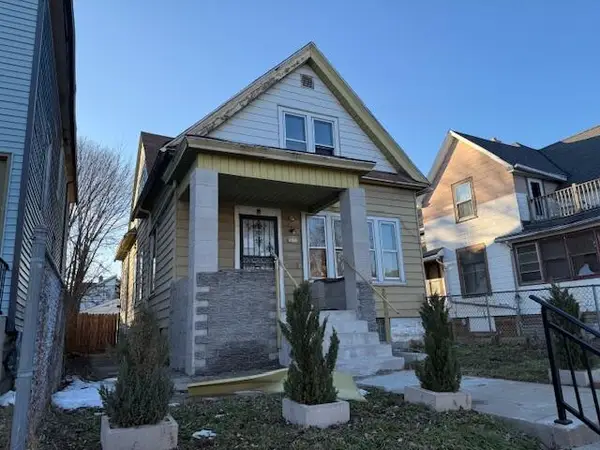 $129,900Pending3 beds 1 baths1,652 sq. ft.
3033 N Holton St, Milwaukee, WI 53212
MLS# 1951584Listed by: WELCOME HOME REAL ESTATE GROUP, LLC $51,100Active2 beds 1 baths787 sq. ft.
2922 N 6th St, Milwaukee, WI 53212
MLS# 1951272Listed by: REDEVELOPMENT AUTHORITY CITY OF MKE $53,800Active-- beds -- baths1,930 sq. ft.
2818 N Palmer St, Milwaukee, WI 53212
MLS# 1951274Listed by: REDEVELOPMENT AUTHORITY CITY OF MKE $53,400Active-- beds -- baths2,047 sq. ft.
3014 N Buffum St, Milwaukee, WI 53212
MLS# 1951276Listed by: REDEVELOPMENT AUTHORITY CITY OF MKE $159,200Active-- beds -- baths1,826 sq. ft.
2661 N Vel R Phillips Ave, Milwaukee, WI 53212
MLS# 1951313Listed by: REDEVELOPMENT AUTHORITY CITY OF MKE $269,900Active-- beds -- baths3,818 sq. ft.
2664 N 2nd St, Milwaukee, WI 53212
MLS# 1951185Listed by: COLDWELL BANKER REALTY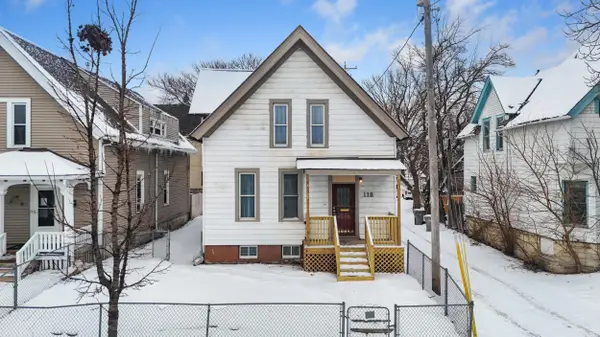 $265,000Pending4 beds 2 baths1,953 sq. ft.
118 E North Ave, Milwaukee, WI 53212
MLS# 1950258Listed by: HOMESTEAD REALTY, INC $110,000Pending3 beds 2 baths1,268 sq. ft.
2538 N Hubbard St, Milwaukee, WI 53212
MLS# 1949271Listed by: MCKENNA REAL ESTATE LLC $23,000Active0.14 Acres
2401 N Richards St, Milwaukee, WI 53212
MLS# 1948832Listed by: REDEVELOPMENT AUTHORITY CITY OF MKE $105,000Pending3 beds 1 baths1,008 sq. ft.
3348 N Vel R Phillips Ave, Milwaukee, WI 53212
MLS# 1948792Listed by: IDEAL REALTY $137,900Pending-- beds -- baths2,174 sq. ft.
608 W Burleigh St, Milwaukee, WI 53212
MLS# 1948208Listed by: RIVERWEST REALTY MILWAUKEE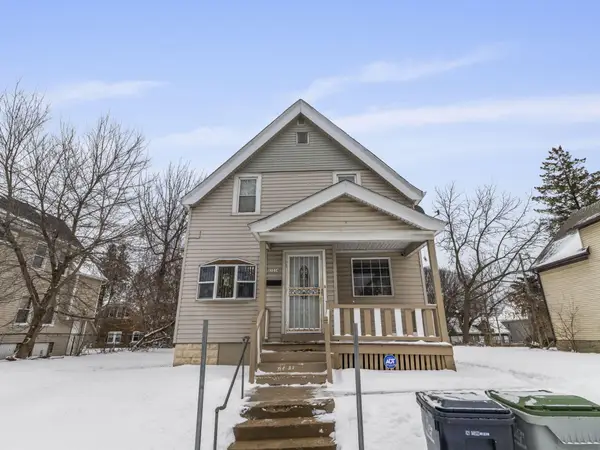 $125,000Active4 beds 2 baths1,645 sq. ft.
3234 N Achilles St, Milwaukee, WI 53212
MLS# 1948083Listed by: BOARDWALK REALTY LLC $139,000Pending-- beds -- baths2,046 sq. ft.
2477 N 6th St, Milwaukee, WI 53212
MLS# 1947666Listed by: REAL BROKER MILWAUKEE $105,000Pending3 beds 1 baths1,008 sq. ft.
3260 N Achilles St, Milwaukee, WI 53212
MLS# 1948790Listed by: IDEAL REALTY $199,900Pending5 beds 2 baths1,862 sq. ft.
2631 N Richards St, Milwaukee, WI 53212
MLS# 1946857Listed by: MCKENNA REAL ESTATE LLC $50,000Active0.13 Acres
3024 N 2nd St, Milwaukee, WI 53212
MLS# 1945346Listed by: REAL BROKER MILWAUKEE $185,000Active4 beds 2 baths1,444 sq. ft.
212 W Center St, Milwaukee, WI 53212
MLS# 1943905Listed by: EXP REALTY, LLC~MKE $304,900Active4 beds 2 baths2,320 sq. ft.
2378 N 1st St, Milwaukee, WI 53212
MLS# 1942566Listed by: STANLEY REALTY GROUP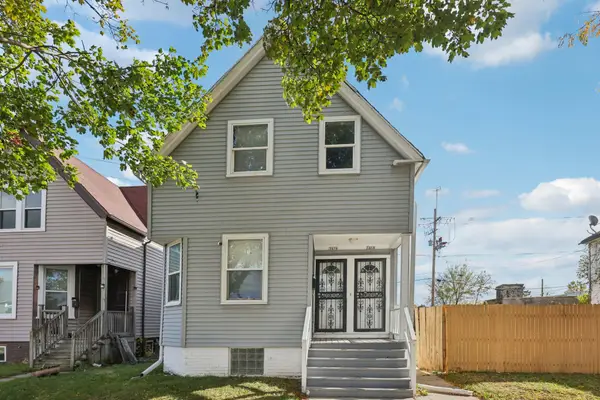 $224,900Pending-- beds -- baths1,640 sq. ft.
3468 N Richards St, Milwaukee, WI 53212
MLS# 1940664Listed by: REDFIN CORPORATION $199,900Pending-- beds -- baths2,077 sq. ft.
220 E Clarke St, Milwaukee, WI 53212
MLS# 1947264Listed by: MINETTE REALTY, LLC $137,900Pending2 beds 1 baths866 sq. ft.
2646 N Vel R Phillips Ave, Milwaukee, WI 53212
MLS# 1937735Listed by: EXP REALTY, LLC~MKE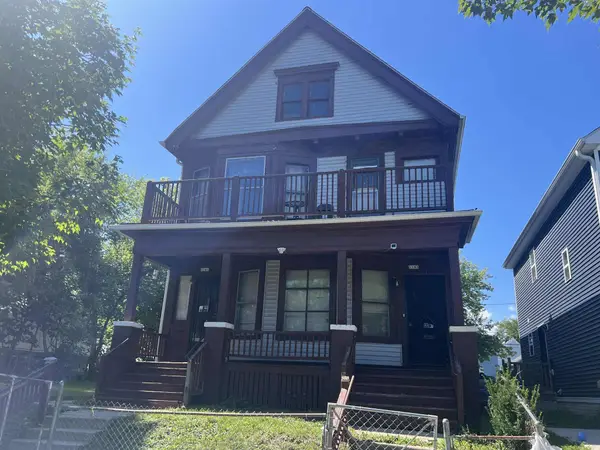
 $115,000Pending-- beds -- baths2,292 sq. ft.
3341 N 3rd St, Milwaukee, WI 53212
MLS# 1933540Listed by: CENTURY 21 AFFILIATED $60,000Pending-- beds -- baths1,960 sq. ft.
3042 N 2nd St, Milwaukee, WI 53212
MLS# 1937587Listed by: THE ROSEMONT GROUP REALTY LLC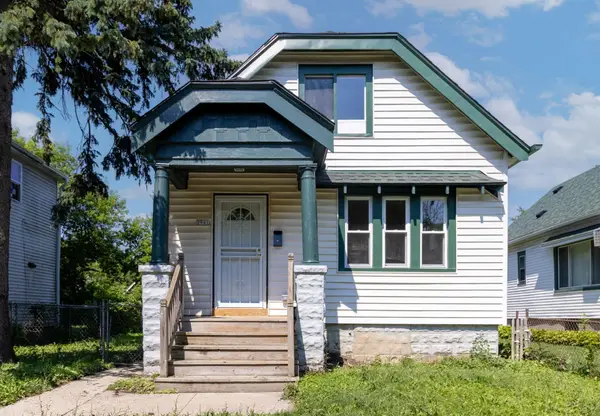 $154,000Active3 beds 1 baths971 sq. ft.
2941 N Dr William Finlayson St, Milwaukee, WI 53212
MLS# 1925586Listed by: ACTS CDC
Local realty services provided by:CENTURY 21 North East
The information being provided by Wisconsin Real Estate Exchange is for the consumer’s personal, non-commercial use and may not be used for any purpose other than to identify prospective properties consumers may be interested in purchasing. Information is supplied by seller and other third parties and has not been verified. 2026 Wisconsin Real Estate Exchange All rights reserved.
Popular neighborhoods near Harambee, Milwaukee, WI
Zip codes near Harambee, Milwaukee, WI
- 53202 homes for sale
- 53203 homes for sale
- 53204 homes for sale
- 53205 homes for sale
- 53206 homes for sale
- 53207 homes for sale
- 53208 homes for sale
- 53209 homes for sale
- 53210 homes for sale
- 53211 homes for sale
- 53212 homes for sale
- 53213 homes for sale
- 53214 homes for sale
- 53215 homes for sale
- 53216 homes for sale
- 53217 homes for sale
- 53218 homes for sale
- 53219 homes for sale
- 53222 homes for sale
- 53233 homes for sale
Counties near Harambee, Milwaukee, WI
- Boone County homes for sale
- Calumet County homes for sale
- Columbia County homes for sale
- Dodge County homes for sale
- Fond du Lac County homes for sale
- Jefferson County homes for sale
- Kenosha County homes for sale
- Lake County homes for sale
- Manitowoc County homes for sale
- McHenry County homes for sale
- Milwaukee County homes for sale
- Muskegon County homes for sale
- Ottawa County homes for sale
- Ozaukee County homes for sale
- Racine County homes for sale
- Rock County homes for sale
- Sheboygan County homes for sale
- Walworth County homes for sale
- Washington County homes for sale
- Waukesha County homes for sale
Protect your home and budget from life's surprises with an Assurant Home Warranty, backed by a partner that supports you through every step of homeownership. Explore Plans.
©2026 Century 21 Real Estate LLC. All rights reserved. CENTURY 21®, the CENTURY 21 Logo and C21® are service marks owned by Century 21 Real Estate LLC. Century 21 Real Estate LLC fully supports the principles of the Fair Housing Act and the Equal Opportunity Act. Each office is independently owned and operated. Listing information is deemed reliable but not guaranteed accurate.