- Avalon, McDonough homes for sale
- Blythe, Blythe homes for sale
- Brown's Farm, Locust Grove homes for sale
- City Square, McDonough homes for sale
- Deer Run, Conyers homes for sale
- Eagle's Brooke Country Club, Locust Grove homes for sale
- Eagles Landing, McDonough homes for sale
- Eatlanta Farm, Covington Porterdale homes for sale
- Hephzibah, Hephzibah homes for sale
- Heron Bay, Locust Grove homes for sale
- Honey Creek, Conyers homes for sale
- Kelarie, Grovetown homes for sale
- Lake Capri, Conyers homes for sale
- Lakewood Estates, Covington homes for sale
- Nelson Heights, Covington homes for sale
- Stone Lea, Oxford homes for sale
- Tara, Loganville homes for sale
- Walton County Estates, Social Circle homes for sale
- Wesley Lakes, McDonough homes for sale
- Woodlake, Monroe homes for sale
Hardwick, GA - homes for sale
11 of 11 results displayed
- New
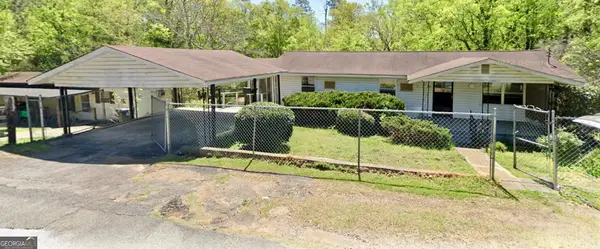 $150,000Active4 beds 2 baths1,152 sq. ft.
143 Park Avenue, Milledgeville, GA 31061
MLS# 10714321Listed by: Virtual Properties Realty.com
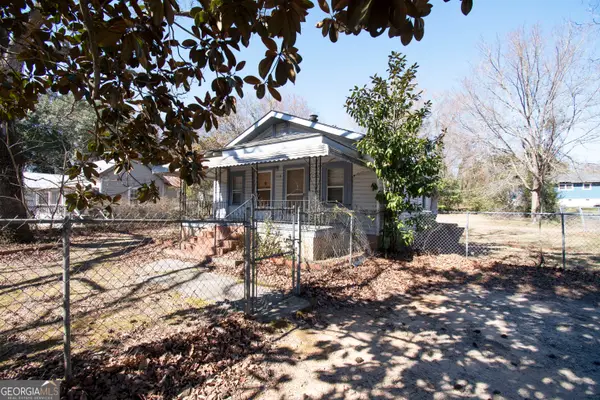 $125,000Active2 beds 1 baths1,024 sq. ft.
118 Park Avenue, Milledgeville, GA 31061
MLS# 10695546Listed by: Virtual Properties Realty.com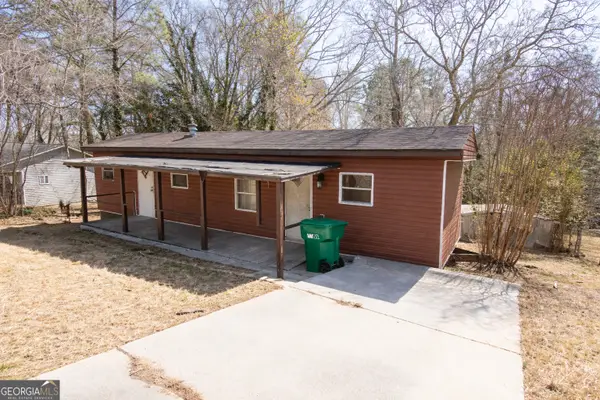 $75,000Active1 beds 1 baths862 sq. ft.
145 Park Avenue Se, Milledgeville, GA 31061
MLS# 10692966Listed by: Virtual Properties Realty.com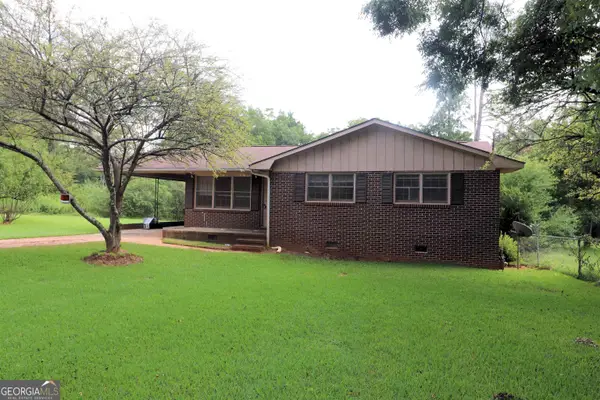 $129,000Active3 beds 2 baths1,230 sq. ft.
156 Deacon J Simmons Road Sw, Milledgeville, GA 31061
MLS# 10670989Listed by: Atlanta Communities $109,000Active3 beds 2 baths2,547 sq. ft.
1620 Irwinton Road, Milledgeville, GA 31061
MLS# 10664575Listed by: J.W. Professional Services LLC $12,000Active0.32 Acres
153&157 Wolverine Street, Milledgeville, GA 31061
MLS# 10657407Listed by: Fickling Lake Country,LLC $224,900Active4 beds 2 baths2,600 sq. ft.
1975 Irwinton Road, Milledgeville, GA 31061
MLS# 10654317Listed by: Peeler Realty Associates $45,000Active3 beds 2 baths1,056 sq. ft.
106 3rd Street Sw, Milledgeville, GA 31061
MLS# 10626594Listed by: Fickling Lake Country,LLC $75,000Active3 beds 1 baths976 sq. ft.
135 Ramsey Street, Milledgeville, GA 31061
MLS# 10620802Listed by: Southern Classic Realtors $89,900Active2 beds 1 baths672 sq. ft.
121 Elder Drive Sw, Milledgeville, GA 31061
MLS# 10616575Listed by: Peeler Realty Associates $199,000Active4 beds 4 baths3,032 sq. ft.
2445 Irwinton Road, Milledgeville, GA 31061
MLS# 10585468Listed by: Southern Classic Realtors
Local realty services provided by:CENTURY 21 Crowe Realty
2026 Georgia MLS. All rights reserved. Information Deem Reliable But Not Guaranteed March 24, 2026
Neighborhoods near Hardwick, GA
Zip codes near Hardwick, GA
- 31020 homes for sale
- 31024 homes for sale
- 31031 homes for sale
- 31032 homes for sale
- 31033 homes for sale
- 31038 homes for sale
- 31042 homes for sale
- 31044 homes for sale
- 31046 homes for sale
- 31054 homes for sale
- 31061 homes for sale
- 31064 homes for sale
- 31082 homes for sale
- 31087 homes for sale
- 31089 homes for sale
- 31090 homes for sale
- 31201 homes for sale
- 31204 homes for sale
- 31211 homes for sale
- 31217 homes for sale
Popular searches near Hardwick, GA
- Coopers homes for sale
- Crooked Creek homes for sale
- Devereux homes for sale
- East Baldwin homes for sale
- Eatonton homes for sale
- Gordon homes for sale
- Gray homes for sale
- Gray-Macon East homes for sale
- Haddock homes for sale
- Hillsboro homes for sale
- Irwinton homes for sale
- Ivey homes for sale
- Linton homes for sale
- Little River homes for sale
- McIntyre homes for sale
- Milledgeville homes for sale
- Phoenix homes for sale
- Round Oak homes for sale
- Sparta homes for sale
- Toomsboro homes for sale
Protect your home and budget from life's surprises with an Assurant Home Warranty, backed by a partner that supports you through every step of homeownership. Explore Plans.
©2026 Century 21 Real Estate LLC. All rights reserved. CENTURY 21®, the CENTURY 21 Logo and C21® are service marks owned by Century 21 Real Estate LLC. Century 21 Real Estate LLC fully supports the principles of the Fair Housing Act and the Equal Opportunity Act. Each office is independently owned and operated. Listing information is deemed reliable but not guaranteed accurate.