- Arroyo Colorado Estates homes for sale
- Combes homes for sale
- El Camino Angosto homes for sale
- Green Valley Farms homes for sale
- Harlingen homes for sale
- Harlingen-San Benito homes for sale
- La Feria homes for sale
- La Feria North homes for sale
- La Paloma homes for sale
- La Tina Ranch homes for sale
- Las Palmas II homes for sale
- Laureles homes for sale
- Palm Valley homes for sale
- Primera homes for sale
- Rice Tracts homes for sale
- Rio Hondo homes for sale
- San Benito homes for sale
- Santa Rosa homes for sale
- Sebastian homes for sale
- Solis homes for sale
78550, TX - homes for sale
300 of 556 results displayed
- New
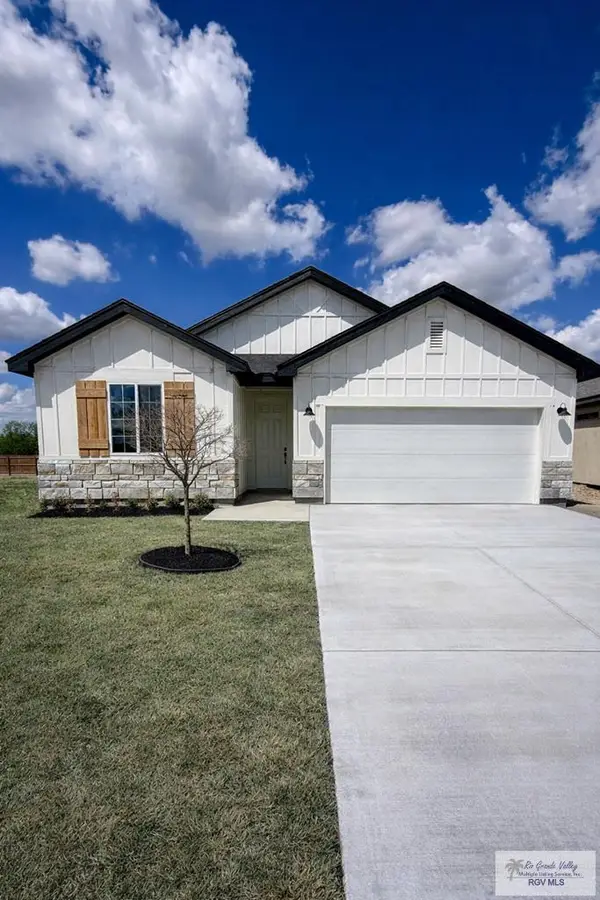
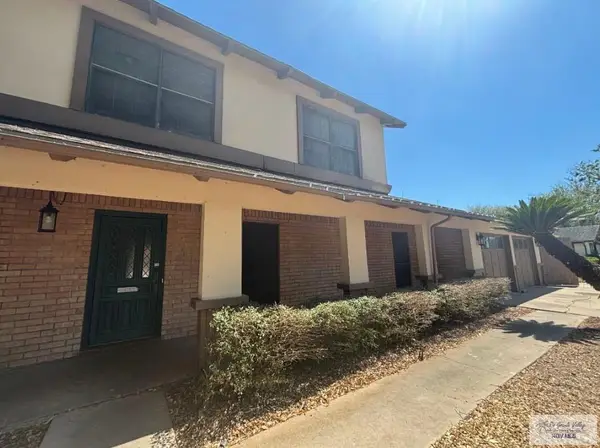 $309,900Active5 beds 4 baths2,964 sq. ft.
2508 Lotus Dr., HARLINGEN, TX 78550
MLS# 29775308Listed by: MISSION REAL ESTATE GROUP - New
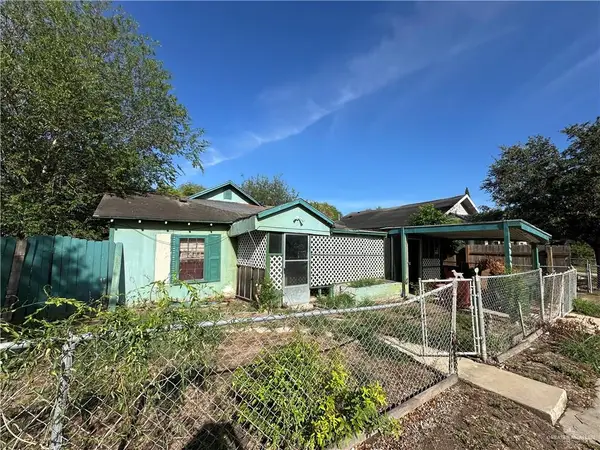
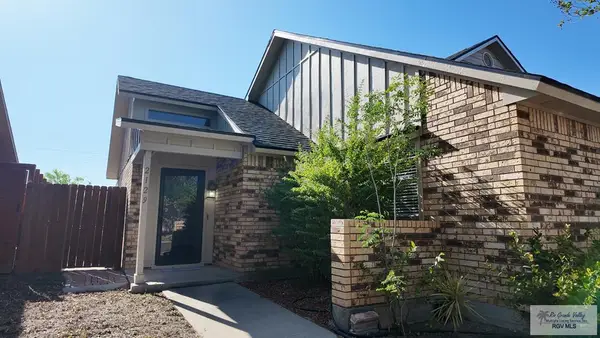 $139,500Active1 beds 1 baths900 sq. ft.
2129 Shadowbrook Cir, HARLINGEN, TX 78550
MLS# 29775303Listed by: KELLER WILLIAMS LRGV - New
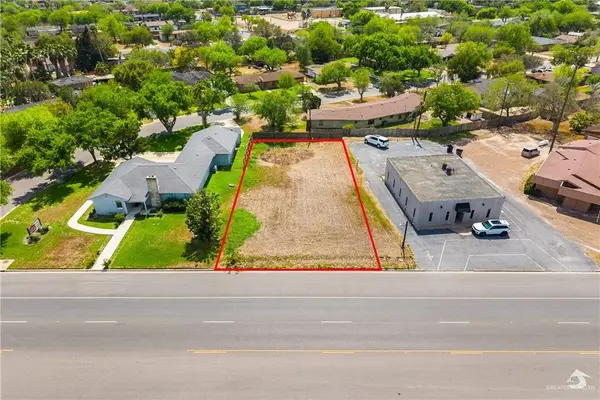 $119,900Active0.23 Acres
1101 N 77 Sunshine Strip Street, Harlingen, TX 78550
MLS# 497810Listed by: Re/Max Platinum - New
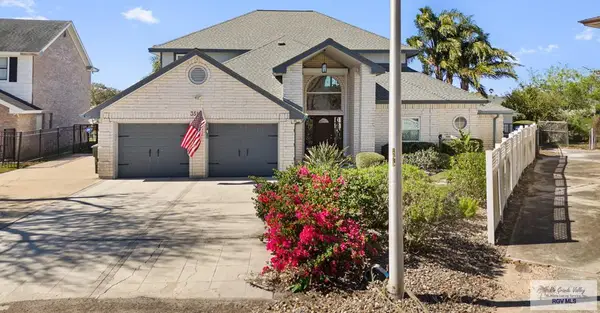
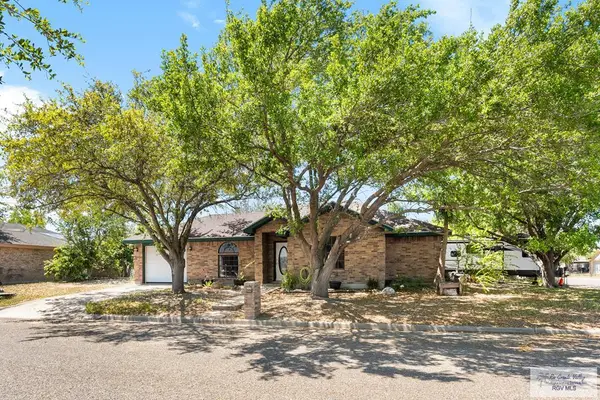 $189,500Active2 beds 2 baths1,231 sq. ft.
2926 Hapner Ave., HARLINGEN, TX 78550
MLS# 29775295Listed by: LEGACY REALTY GROUP RGV - New
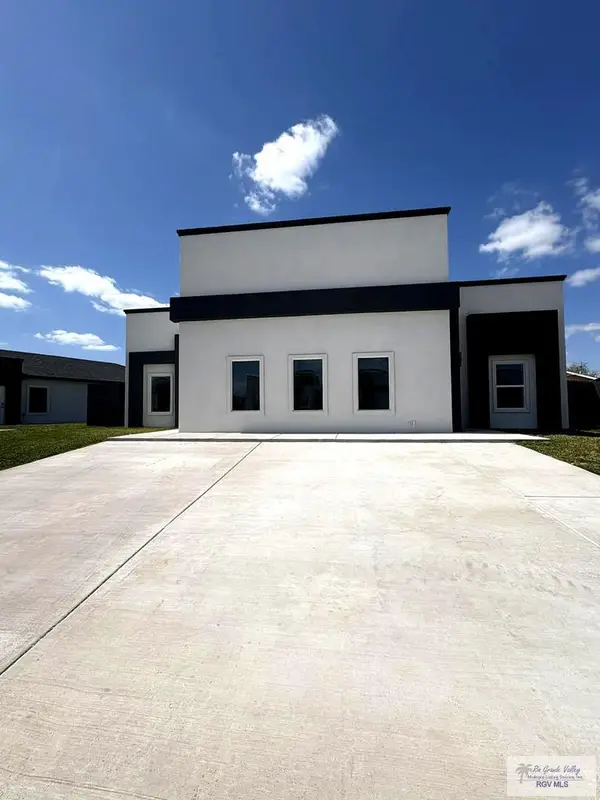
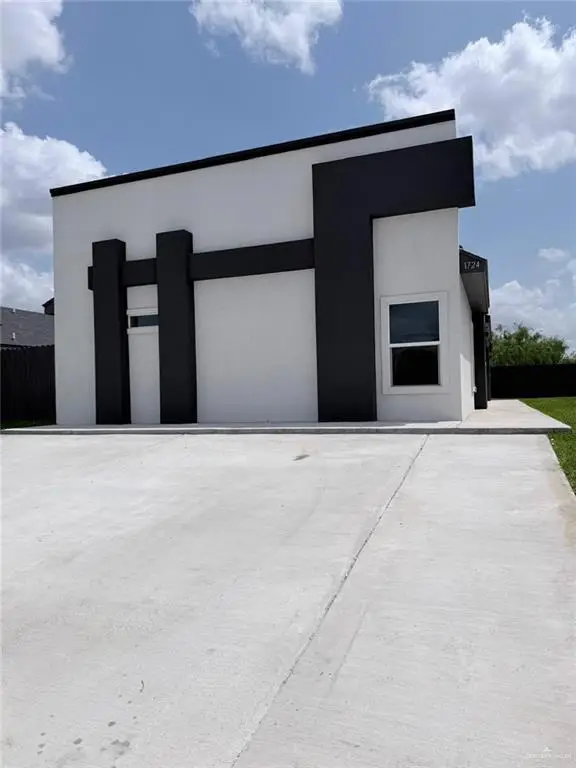 $329,999Active-- beds -- baths2,016 sq. ft.
1724 Clinton Street, Harlingen, TX 78550
MLS# 500349Listed by: Candela Realty Llc - New
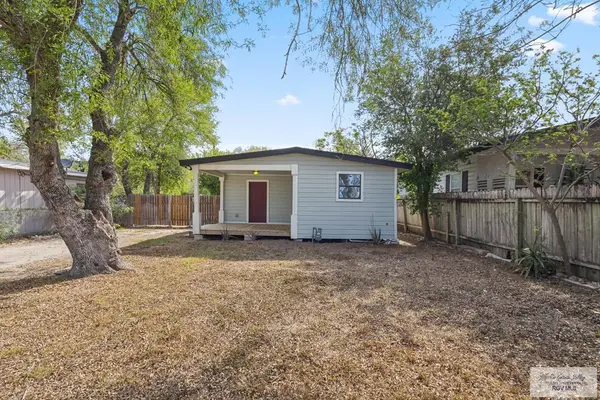
 $165,000Active2 beds 2 baths1,032 sq. ft.
210 E Linda Street, Harlingen, TX 78550
MLS# 500146Listed by: Cornerstone Tx Realty - New
 $219,900Active3 beds 2 baths1,539 sq. ft.
3829 Arroyo Vista Ct., HARLINGEN, TX 78550
MLS# 29775256Listed by: COLDWELL BANKER IMPACT PROPERTIES - New
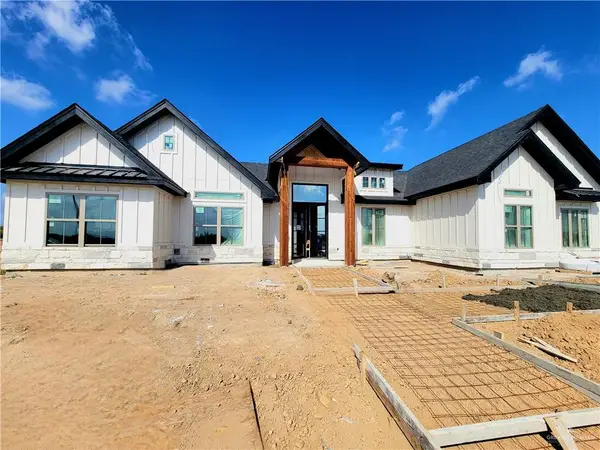 $419,000Active3 beds 3 baths1,753 sq. ft.
21078 Azalea Street, Harlingen, TX 78550
MLS# 500029Listed by: Re/Max Platinum - New
 $279,500Active3 beds 2 baths1,474 sq. ft.
2426 Treasure Cove, Harlingen, TX 78550
MLS# 498756Listed by: Legacy Realty Group Rgv - New
 $589,000Active4 beds 3 baths3,485 sq. ft.
1619 Sam Houston, HARLINGEN, TX 78550
MLS# 29775245Listed by: REALTY ONE GROUP, MODERN EDGE - New
 $154,995Active3 beds 2 baths1,104 sq. ft.
609 S M St., HARLINGEN, TX 78550
MLS# 29775217Listed by: GRT REALTY - New
 $185,000Active3 beds 2 baths1,755 sq. ft.
510 W Buchanan Ave., HARLINGEN, TX 78550
MLS# 29775213Listed by: CAVALRY REAL ESTATE TEAM - New
 $272,615Active3 beds 2 baths1,522 sq. ft.
1837 Miley Ln, HARLINGEN, TX 78550
MLS# 29775209Listed by: IMPERIO REAL ESTATE - New
 $45,000Active4 beds 3 baths2,200 sq. ft.
1216 S E Street, Harlingen, TX 78550
MLS# 500220Listed by: Trademark Real Estate Group - New
 $325,000Active-- beds -- baths1,615 sq. ft.
1725 Clinton St #17, HARLINGEN, TX 78550
MLS# 29775175Listed by: KELLER WILLIAMS LRGV - New
 $480,000Active4 beds 4 baths3,544 sq. ft.
3513 Pebble Beach Dr., HARLINGEN, TX 78550
MLS# 29775173Listed by: COLDWELL BANKER IMPACT PROPERTIES - New
 $69,900Active0.3 Acres
1001 Markowsky Ave., HARLINGEN, TX 78550
MLS# 29775165Listed by: HOMESMART - New
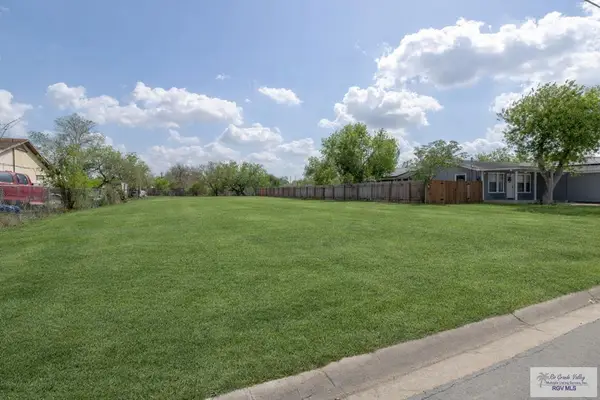
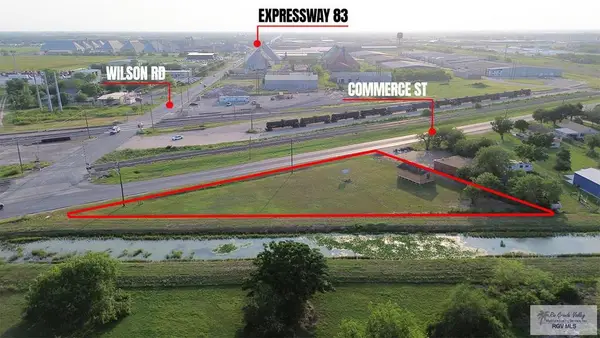 $185,000Active0.73 Acres
1902 N Commerce St., HARLINGEN, TX 78550
MLS# 29775146Listed by: CORNERSTONE TX REALTY - New
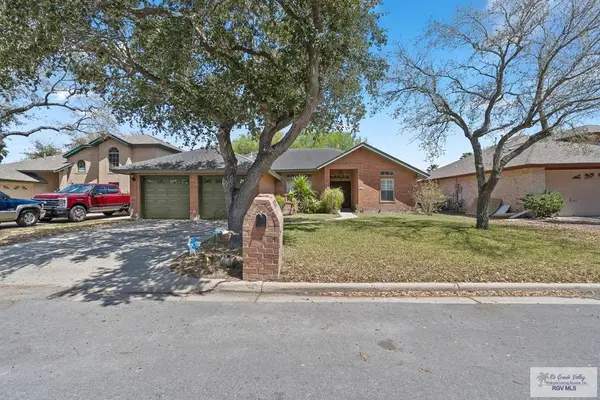
 $339,000Active4 beds 3 baths2,247 sq. ft.
2909 Cypress Dr., Harlingen, TX 78550
MLS# 106039Listed by: REAL  $110,000Pending4 beds 4 baths2,921 sq. ft.
1618 S Parkwood Dr, HARLINGEN, TX 78550
MLS# 29775118Listed by: REAL BROKER, LLC- New
 $329,900Active0.31 Acres
1310 Morgan Boulevard, Harlingen, TX 78550
MLS# 498974Listed by: Exp Realty Llc - New
 $81,767Active7.51 Acres
000 Bass Boulevard, Harlingen, TX 78550
MLS# 500099Listed by: Legacy Realty Group Rgv - New
 $760,000Active-- beds -- baths5,004 sq. ft.
2124 Multi-national, Harlingen, TX 78550
MLS# 497851Listed by: Nai Stx - New
 $510,000Active-- beds -- baths3,384 sq. ft.
2112 Multi-national, Harlingen, TX 78550
MLS# 497855Listed by: Nai Stx - New
 $305,000Active4 beds 2 baths1,799 sq. ft.
1626 Fairfield Drive, Harlingen, TX 78550
MLS# 498480Listed by: Keller Williams Lrgv - New
 $145,000Active4 beds 3 baths1,200 sq. ft.
608 W Polk St., HARLINGEN, TX 78550
MLS# 29775099Listed by: CAVALRY REAL ESTATE TEAM - New
 $204,800Active3 beds 2 baths1,222 sq. ft.
3318 Legacy Lane, Harlingen, TX 78550
MLS# 498851Listed by: Big Realty - New
 $175,000Active0.29 Acres
00 W Kimble Ave., HARLINGEN, TX 78550
MLS# 29775065Listed by: RODRIGUEZ PROPERTIES - New
 $169,999Active3 beds 2 baths1,152 sq. ft.
Address Withheld By Seller, HARLINGEN, TX 78550
MLS# 29775062Listed by: KELLER WILLIAMS LRGV - New
 $339,000Active4 beds 3 baths2,247 sq. ft.
2909 Cypress Drive, Harlingen, TX 78550
MLS# 498788Listed by: Real Broker Llc  $349,900Active4 beds 3 baths2,376 sq. ft.
3306 Pebble Beach Drive, Harlingen, TX 78550
MLS# 498743Listed by: Keller Williams Lrgv $159,000Active2 beds 2 baths1,086 sq. ft.
4332 Minnesota St., HARLINGEN, TX 78550
MLS# 29772502Listed by: LANDMARK PROPERTIES $220,370Active3 beds 2 baths1,204 sq. ft.
17962 Redwood Street, Combes, TX 78552
MLS# 498581Listed by: Keller Williams Lrgv $84,900Active3 beds 2 baths1,656 sq. ft.
1007 N 7th Street, Harlingen, TX 78550
MLS# 498643Listed by: Wall Street Real Estate Llc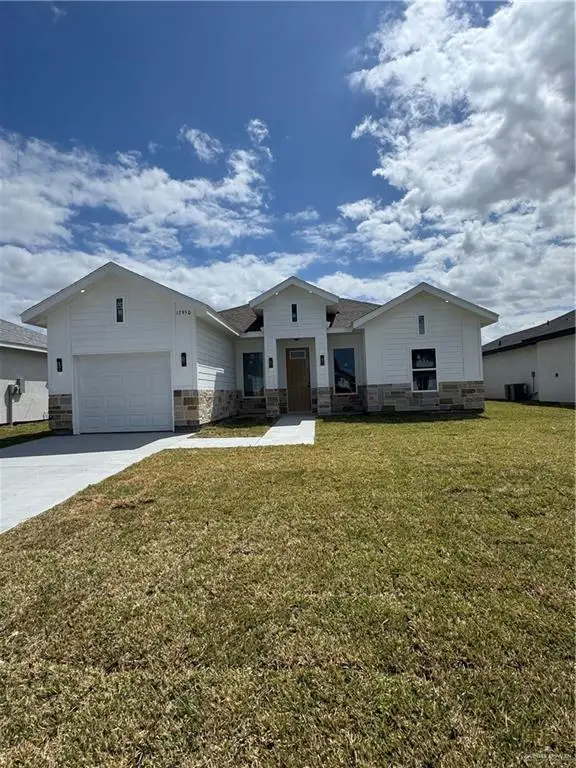 $216,637Active3 beds 2 baths1,183 sq. ft.
17950 Redwood Street, Combes, TX 78552
MLS# 498578Listed by: Keller Williams Lrgv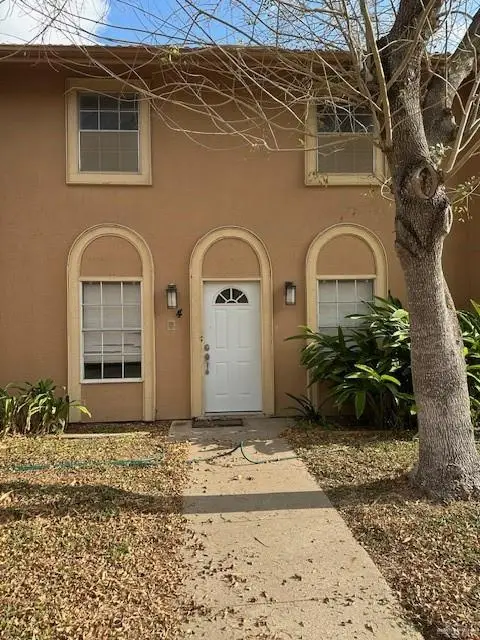 $130,000Active3 beds 3 baths1,588 sq. ft.
2402 N Ed Carey Drive #4, Harlingen, TX 78550
MLS# 498554Listed by: Bahnman Realty, Inc. $216,637Active3 beds 2 baths1,183 sq. ft.
17950 Redwood St #LOT 79, COMBES, TX 78552
MLS# 29775004Listed by: KELLER WILLIAMS LRGV $220,370Active3 beds 2 baths1,204 sq. ft.
17962 Redwood St #LOT 80, COMBES, TX 78552
MLS# 29775005Listed by: KELLER WILLIAMS LRGV $69,900Active0.12 Acres
4349 Casamigos St #31, HARLINGEN, TX 78550
MLS# 29774976Listed by: REAL BROKER, LLC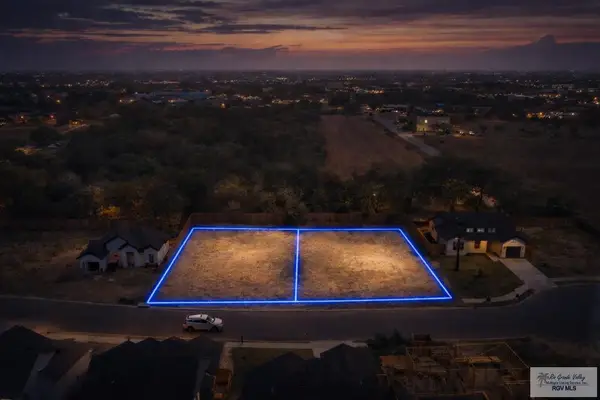 $69,900Active0.12 Acres
4353 Casamigos St #32, HARLINGEN, TX 78550
MLS# 29774977Listed by: REAL BROKER, LLC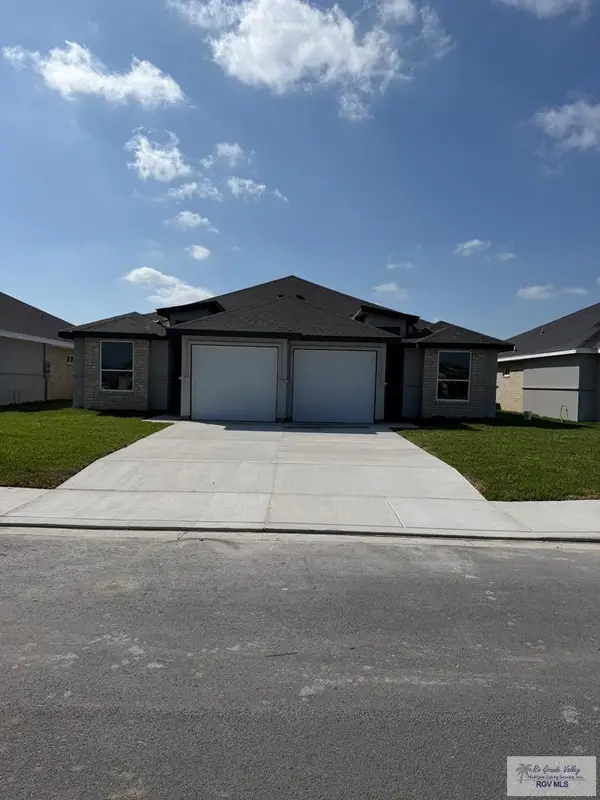 $385,000Active-- beds -- baths2,628 sq. ft.
4422 Escondido Ln. #A & B, HARLINGEN, TX 78550
MLS# 29774968Listed by: RGV REALTY, LLC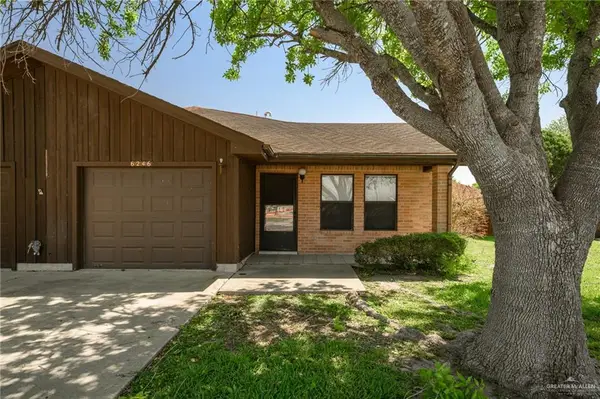 $154,000Active2 beds 2 baths1,258 sq. ft.
6246 Camelot Drive, Harlingen, TX 78550
MLS# 497986Listed by: The Mbteam $239,000Active-- beds -- baths1,603 sq. ft.
1821-1823 Warren Street, Harlingen, TX 78550
MLS# 498057Listed by: The Mbteam $310,000Active3 beds 3 baths2,362 sq. ft.
2202 Ella Ave., HARLINGEN, TX 78550
MLS# 29774915Listed by: REALTY ONE GROUP, MODERN EDGE $199,999Active3 beds 2 baths2,001 sq. ft.
21660 Fm 507, HARLINGEN, TX 78550
MLS# 29774886Listed by: ROCKING K REALTY & AUCTIONS $249,900Active3 beds 2 baths1,390 sq. ft.
17856 Redwood Street, Combes, TX 78552
MLS# 498168Listed by: Keller Williams Lrgv $205,000Active3 beds 2 baths1,277 sq. ft.
3017 Brushy Ct, HARLINGEN, TX 78550
MLS# 29774874Listed by: EZ REALTY & PROPERTY MGT, LLC $59,999Active0.12 Acres
4113 Herradura St, HARLINGEN, TX 78550
MLS# 29774869Listed by: RCR REAL CONNECT REALTY $169,999Active2 beds 2 baths1,262 sq. ft.
2717 Hunters Crossing St., HARLINGEN, TX 78550
MLS# 29774862Listed by: KELLER WILLIAMS LRGV $259,900Active3 beds 2 baths1,919 sq. ft.
1514 S Christian Cir, HARLINGEN, TX 78550
MLS# 29774851Listed by: REALTY ONE GROUP, MODERN EDGE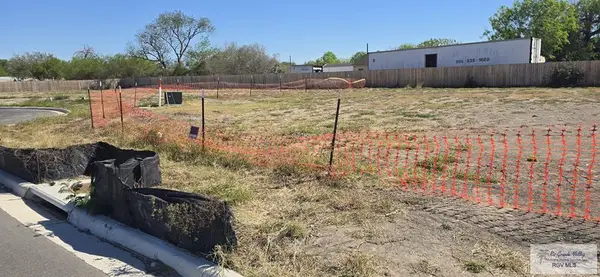 $58,999Active0.12 Acres
4109 Herradura St, HARLINGEN, TX 78550
MLS# 29774852Listed by: RCR REAL CONNECT REALTY $59,999Active0.12 Acres
4309 Casamigos St, HARLINGEN, TX 78550
MLS# 29774853Listed by: RCR REAL CONNECT REALTY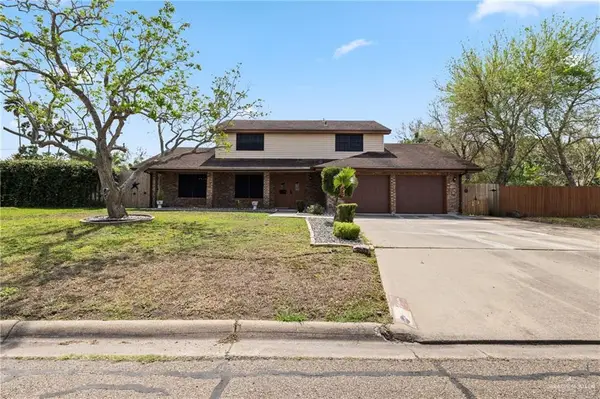 $315,000Active3 beds 3 baths2,263 sq. ft.
2702 Cypress Drive, Harlingen, TX 78550
MLS# 497988Listed by: Candela Realty Llc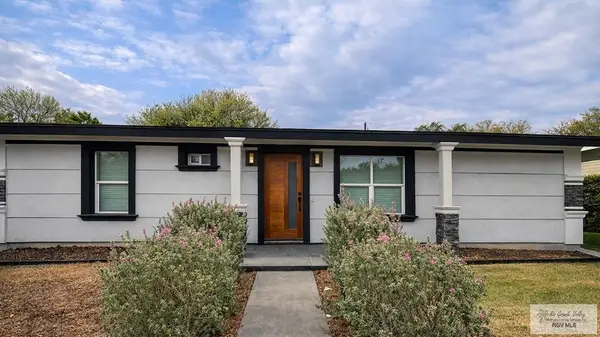 $195,000Active3 beds 2 baths1,200 sq. ft.
910 Cardinal Dr, HARLINGEN, TX 78550
MLS# 29774848Listed by: REALTY ONE GROUP, MODERN EDGE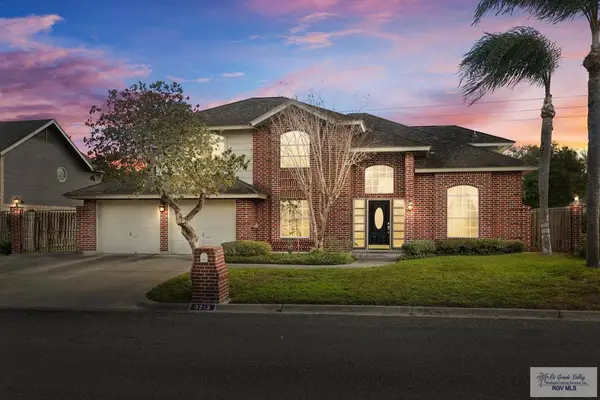 $340,000Active4 beds 3 baths3,045 sq. ft.
3213 Banyan Dr., HARLINGEN, TX 78550
MLS# 29774841Listed by: TNT REAL ESTATE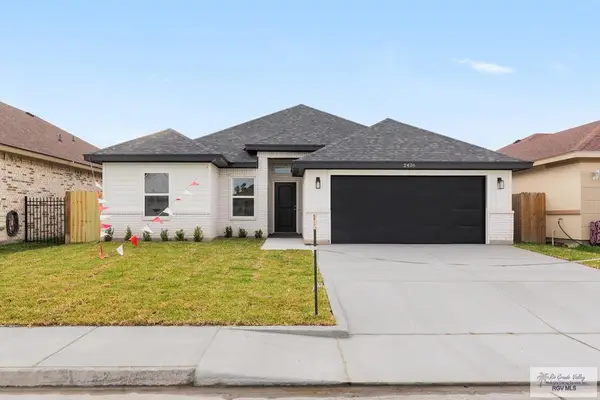 $279,500Active3 beds 2 baths1,474 sq. ft.
2426 Treasure Cove, HARLINGEN, TX 78550
MLS# 29774836Listed by: LEGACY REALTY GROUP RGV $219,999Active3 beds 2 baths2,141 sq. ft.
3201 Hapner Ave., HARLINGEN, TX 78550
MLS# 29774831Listed by: KELLER WILLIAMS LRGV $229,900Active4 beds 3 baths1,796 sq. ft.
2802 Sugar Pine Ct., HARLINGEN, TX 78550
MLS# 29774815Listed by: KELLER WILLIAMS LRGV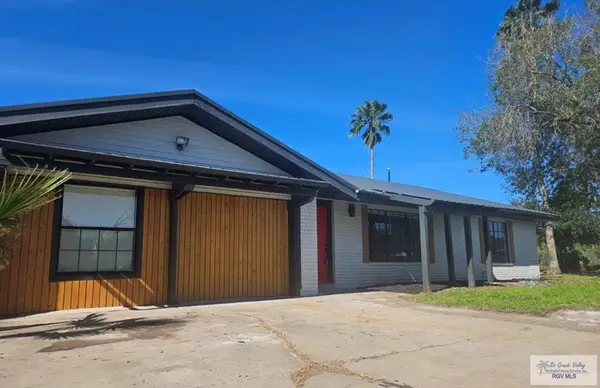 $249,000Active4 beds 4 baths2,320 sq. ft.
1115 Falcon Dr., HARLINGEN, TX 78550
MLS# 29771679Listed by: COASTAL REALTY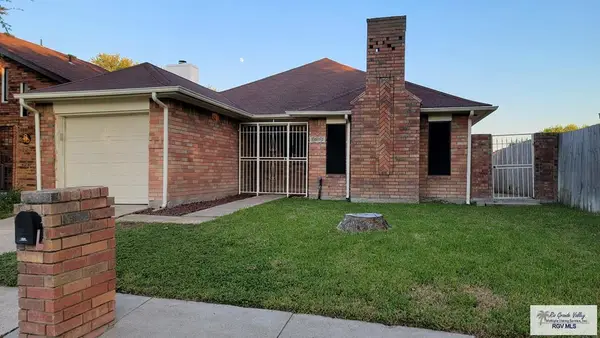 $197,000Active3 beds 2 baths1,268 sq. ft.
1902 White Tail Dr., HARLINGEN, TX 78550
MLS# 29774803Listed by: REALTY ONE GROUP, MODERN EDGE $77,000Active3 beds 1 baths1,296 sq. ft.
1118 W Grant Ave., HARLINGEN, TX 78550
MLS# 29774798Listed by: KELLER WILLIAMS LRGV $90,000Active0.15 Acres
0 W Escondido Ln., HARLINGEN, TX 78550
MLS# 29774763Listed by: SUPERIOR ONE REALTY $60,000Active2 beds 1 baths937 sq. ft.
2622 S Calle Duquesa, HARLINGEN, TX 78550
MLS# 29774743Listed by: EXCEL REALTY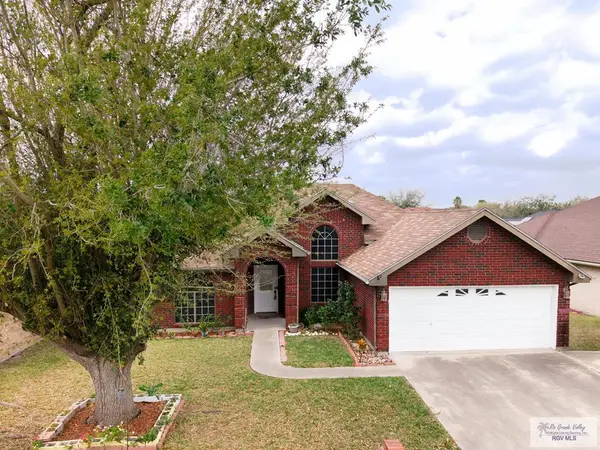 $248,000Active3 beds 2 baths1,541 sq. ft.
1513 Autumn Ct., HARLINGEN, TX 78550
MLS# 29774738Listed by: LEGACY REALTY GROUP RGV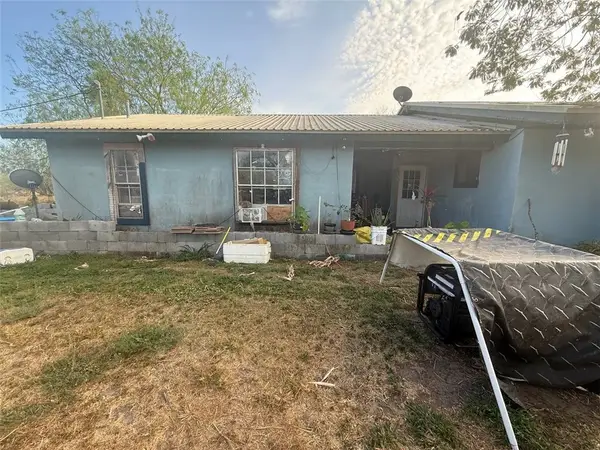 $199,000Active3 beds 2 baths1,874 sq. ft.
21310 Fm 508, Harlingen, TX 78550
MLS# 472871Listed by: EXP REALTY LLC $245,000Active3 beds 2 baths2,110 sq. ft.
2010 River Oaks Dr, HARLINGEN, TX 78550
MLS# 29774721Listed by: ALTUS REAL ESTATE GROUP, LLC $225,000Active1 beds 2 baths900 sq. ft.
21687 Gonzalez Rd., HARLINGEN, TX 78550
MLS# 29774688Listed by: LEGACY REALTY GROUP RGV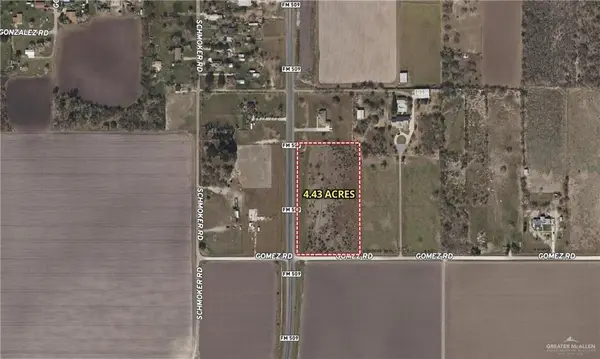 $149,900Active4.43 Acres
00 Gomez Road, Rio Hondo, TX 78583
MLS# 497346Listed by: Bahnman Realty, Inc.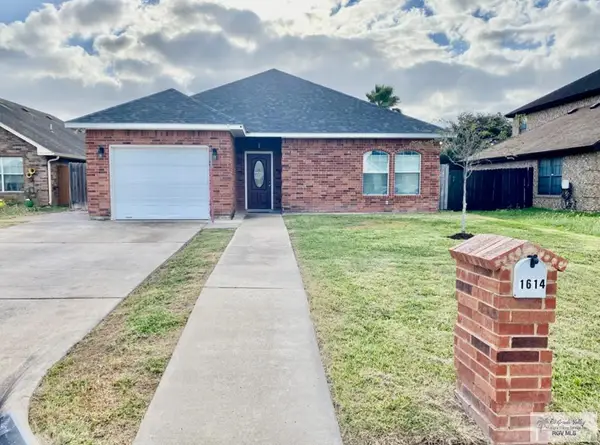 $215,000Active3 beds 2 baths1,429 sq. ft.
1614 Carter St., HARLINGEN, TX 78550
MLS# 29773678Listed by: REALTY ONE GROUP, MODERN EDGE $182,000Active3 beds 2 baths1,370 sq. ft.
605 W Ballard Avenue, Harlingen, TX 78550
MLS# 497433Listed by: Tnt Real Estate $129,000Active2 beds 1 baths900 sq. ft.
310 W Filmore St, HARLINGEN, TX 78550
MLS# 29772665Listed by: ACCLAIM PROPERTIES $79,000Active0.62 Acres
LOT #11 Orichid St #11, HARLINGEN, TX 78550
MLS# 29772616Listed by: KELLER WILLIAMS LRGV $148,000Active3 beds 3 baths1,464 sq. ft.
702 E Carrol Street, Harlingen, TX 78550
MLS# 497316Listed by: Monarca Real Estate Group Llc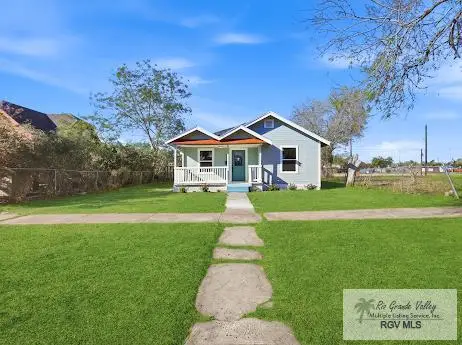 $139,900Pending3 beds 2 baths1,128 sq. ft.
605 Madison Ave, HARLINGEN, TX 78550
MLS# 29772600Listed by: FOX REAL ESTATE PROS $60,000Active0.28 Acres
506 Bowie Ave., HARLINGEN, TX 78550
MLS# 29772586Listed by: EZ REALTY & PROPERTY MGT, LLC $60,000Active0.28 Acres
510 Bowie Ave., HARLINGEN, TX 78550
MLS# 29772587Listed by: EZ REALTY & PROPERTY MGT, LLC $60,000Active0.28 Acres
514 Bowie Ave., HARLINGEN, TX 78550
MLS# 29772588Listed by: EZ REALTY & PROPERTY MGT, LLC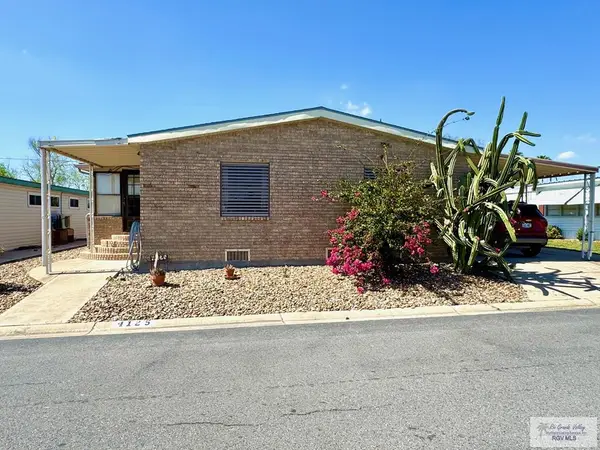 $159,900Active3 beds 2 baths1,888 sq. ft.
4125 Minnesota St., HARLINGEN, TX 78550
MLS# 29772594Listed by: LANDMARK PROPERTIES $55,500Active0.19 Acres
1130 Julie Ln, HARLINGEN, TX 78550
MLS# 29772567Listed by: EZ REALTY & PROPERTY MGT, LLC $55,500Active0.19 Acres
1126 Julie Ln, HARLINGEN, TX 78550
MLS# 29772569Listed by: EZ REALTY & PROPERTY MGT, LLC $55,500Active0.19 Acres
1110 Julie Ln, HARLINGEN, TX 78550
MLS# 29772571Listed by: EZ REALTY & PROPERTY MGT, LLC $58,000Active0.25 Acres
1114 Julie Ln, HARLINGEN, TX 78550
MLS# 29772573Listed by: EZ REALTY & PROPERTY MGT, LLC $55,500Active0.19 Acres
1118 Julie Ln, HARLINGEN, TX 78550
MLS# 29772574Listed by: EZ REALTY & PROPERTY MGT, LLC $55,500Active0.19 Acres
1122 Julie Ln, HARLINGEN, TX 78550
MLS# 29772578Listed by: EZ REALTY & PROPERTY MGT, LLC $399,900Active5 Acres
109 N Fm 509, HARLINGEN, TX 78550
MLS# 29772584Listed by: CHRE CINDY HOPKINS REAL ESTATE $55,500Active0.19 Acres
1105 Julie Ln, HARLINGEN, TX 78550
MLS# 29772544Listed by: EZ REALTY & PROPERTY MGT, LLC $55,500Active0.19 Acres
1109 Julie Ln, HARLINGEN, TX 78550
MLS# 29772545Listed by: EZ REALTY & PROPERTY MGT, LLC $55,500Active0.19 Acres
1113 Julie Ln, HARLINGEN, TX 78550
MLS# 29772546Listed by: EZ REALTY & PROPERTY MGT, LLC $55,500Active0.19 Acres
1117 Julie Ln, HARLINGEN, TX 78550
MLS# 29772549Listed by: EZ REALTY & PROPERTY MGT, LLC $55,500Active0.19 Acres
1121 Julie Ln, HARLINGEN, TX 78550
MLS# 29772550Listed by: EZ REALTY & PROPERTY MGT, LLC $55,500Active0.19 Acres
1125 Julie Ln, HARLINGEN, TX 78550
MLS# 29772551Listed by: EZ REALTY & PROPERTY MGT, LLC $55,500Active0.19 Acres
1129 Julie Ln, HARLINGEN, TX 78550
MLS# 29772552Listed by: EZ REALTY & PROPERTY MGT, LLC $55,500Active0.19 Acres
1131 Julie Ln, HARLINGEN, TX 78550
MLS# 29772553Listed by: EZ REALTY & PROPERTY MGT, LLC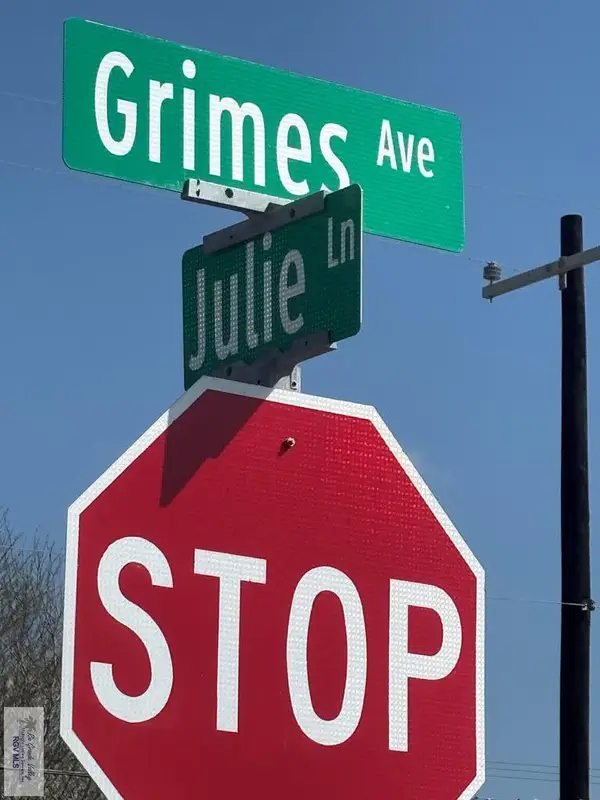 $55,500Active0.19 Acres
1102 Julie Ln, HARLINGEN, TX 78550
MLS# 29772555Listed by: EZ REALTY & PROPERTY MGT, LLC $55,500Active0.21 Acres
1106 Julie Ln, HARLINGEN, TX 78550
MLS# 29772556Listed by: EZ REALTY & PROPERTY MGT, LLC $179,900Active3 beds 3 baths1,350 sq. ft.
313 E Flynn Ave., HARLINGEN, TX 78550
MLS# 29772498Listed by: CAVALRY REAL ESTATE TEAM $335,000Active-- beds -- baths2,570 sq. ft.
2631/2635 Hunters Crossing St., HARLINGEN, TX 78550
MLS# 29772511Listed by: REAL BROKER, LLC $179,000Active2 beds 2 baths1,111 sq. ft.
1920 W Wisconsin Ave, HARLINGEN, TX 78550
MLS# 29772486Listed by: COLDWELL BANKER IMPACT PROPERTIES $153,000Active3 beds 1 baths1,265 sq. ft.
2214 E Pendleton Street, Harlingen, TX 78550
MLS# 496893Listed by: Nexthome Rgv Realty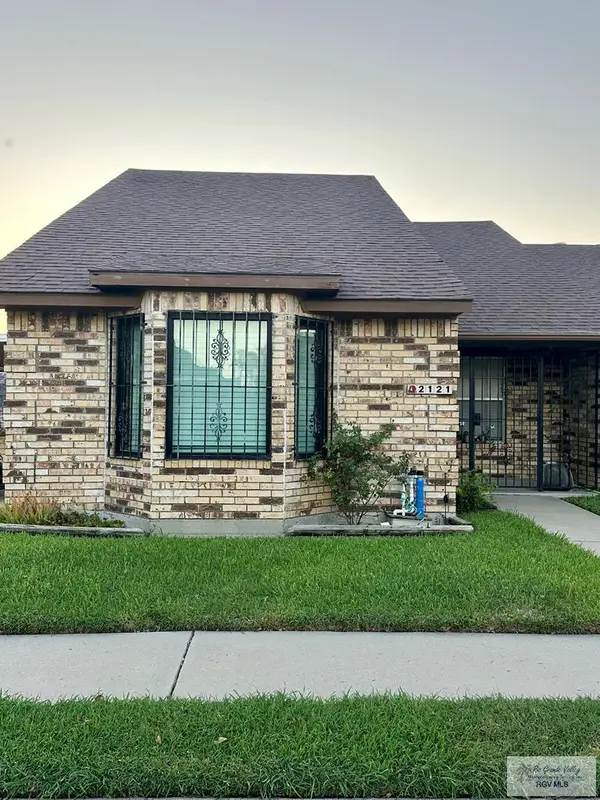 $149,000Pending2 beds 2 baths977 sq. ft.
2121 Shadowbrook Cir, HARLINGEN, TX 78550
MLS# 29772453Listed by: KELLER WILLIAMS LRGV $145,000Active3 beds 2 baths1,730 sq. ft.
222 W Buchanan Ave., HARLINGEN, TX 78550
MLS# 29772457Listed by: FOX REAL ESTATE PROS $209,999Active3 beds 2 baths1,479 sq. ft.
705 Nantucket Dr., HARLINGEN, TX 78550
MLS# 29772448Listed by: KELLER WILLIAMS LRGV $189,900Active3 beds 2 baths1,294 sq. ft.
1926 N 8th St., HARLINGEN, TX 78550
MLS# 29772451Listed by: KELLER WILLIAMS LRGV $136,900Pending3 beds 1 baths960 sq. ft.
2101 E Van Buren Ave., HARLINGEN, TX 78550
MLS# 29772438Listed by: MARCUS PHIPPS REAL ESTATE, LLC $240,000Active3 beds 2 baths1,382 sq. ft.
5910 Queen Sago Drive, Harlingen, TX 78550
MLS# 496927Listed by: Keller Williams Lrgv $269,000Active2 beds 2 baths1,305 sq. ft.
645 Esplanade Court, Harlingen, TX 78550
MLS# 491604Listed by: Keller Williams Lrgv $240,000Active3 beds 2 baths2,062 sq. ft.
1513 E Crockett Ave., Harlingen, TX 78550
MLS# 104930Listed by: LEGACY REALTY GROUP RGV $189,900Pending3 beds 2 baths1,237 sq. ft.
1605 Hapner Ave., HARLINGEN, TX 78550
MLS# 29772398Listed by: ROCKING K REALTY & AUCTIONS $210,000Pending3 beds 2 baths1,783 sq. ft.
1725 Peach Tree Court, Harlingen, TX 78550
MLS# 21188938Listed by: MONUMENT REALTY $64,900Pending0.15 Acres
809 Saint Street, Harlingen, TX 78552
MLS# 496749Listed by: Realty One Group, Modern Edge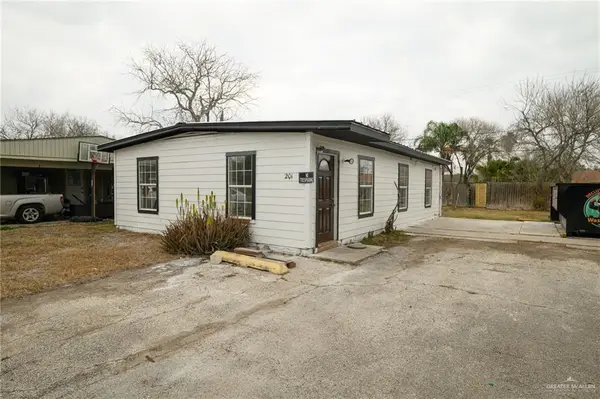 $229,000Pending-- beds -- baths1,977 sq. ft.
201-203 Mcgregor Avenue, Harlingen, TX 78550
MLS# 496529Listed by: The Mbteam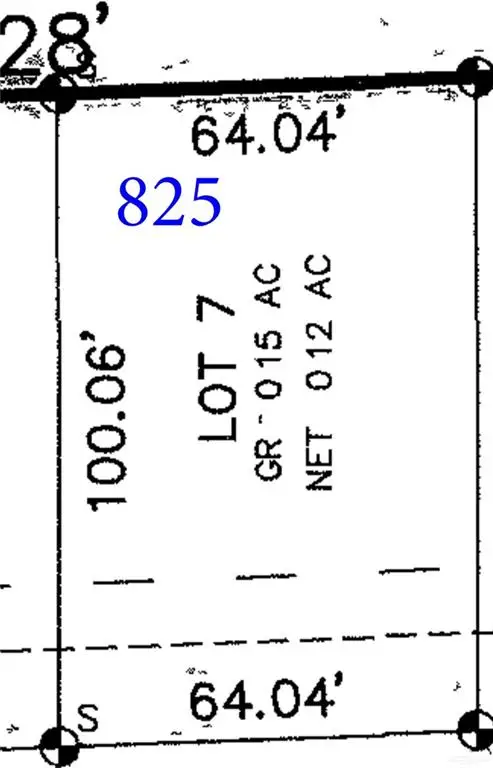 $64,900Active0.15 Acres
825 Saint Street, Harlingen, TX 78552
MLS# 494458Listed by: Lv Real Estate Group, Llc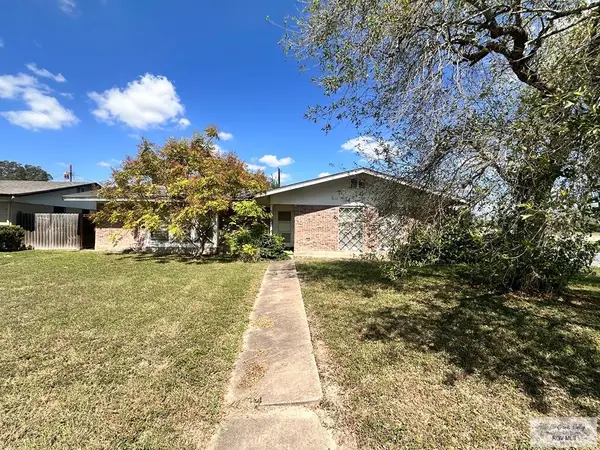 $120,000Pending3 beds 2 baths1,574 sq. ft.
2425 E Austin Ave., HARLINGEN, TX 78550
MLS# 29772309Listed by: LEGACY REALTY GROUP RGV $60,000Active0.14 Acres
00 Golden Bear Dr., HARLINGEN, TX 78550
MLS# 29772294Listed by: RCR REAL CONNECT REALTY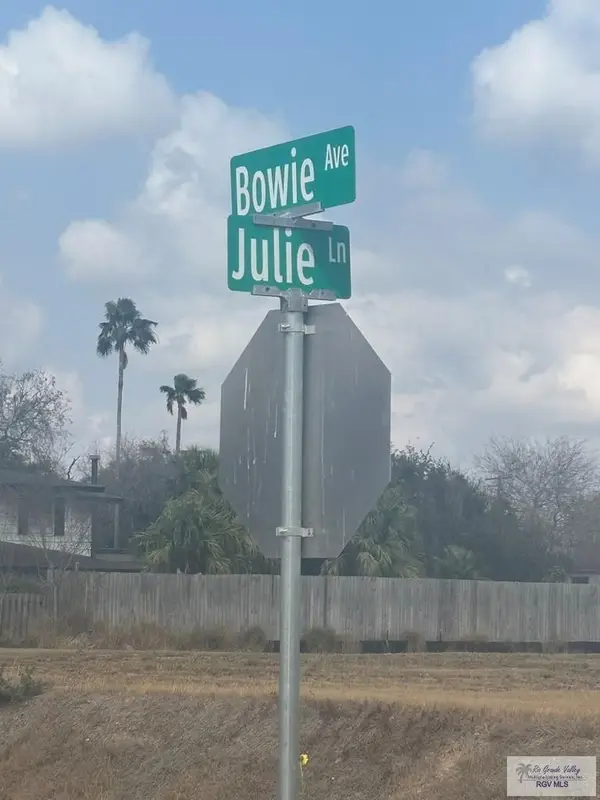 $55,500Active0.19 Acres
1101 Julie Ln, HARLINGEN, TX 78550
MLS# 29772278Listed by: EZ REALTY & PROPERTY MGT, LLC $185,000Active2 beds 2 baths1,488 sq. ft.
2029 W Michigan, HARLINGEN, TX 78550
MLS# 29772273Listed by: RE/MAX ELITE $67,000Active0.35 Acres
733 Washington Cir., HARLINGEN, TX 78550
MLS# 29772264Listed by: KELLER WILLIAMS LRGV $305,000Active3 beds 4 baths1,655 sq. ft.
3202 Legacy Ln., HARLINGEN, TX 78550
MLS# 29772252Listed by: COLDWELL BANKER IMPACT PROPERTIES $264,000Active3 beds 2 baths1,556 sq. ft.
8725 Spoonbill St., HARLINGEN, TX 78550
MLS# 29772235Listed by: KELLER WILLIAMS LRGV $379,000Active4 beds 3 baths2,319 sq. ft.
9713 Heights South, HARLINGEN, TX 78550
MLS# 29772237Listed by: KELLER WILLIAMS LRGV $254,000Active3 beds 2 baths1,788 sq. ft.
1418 S 1st, HARLINGEN, TX 78550
MLS# 29771592Listed by: MARCUS PHIPPS REAL ESTATE, LLC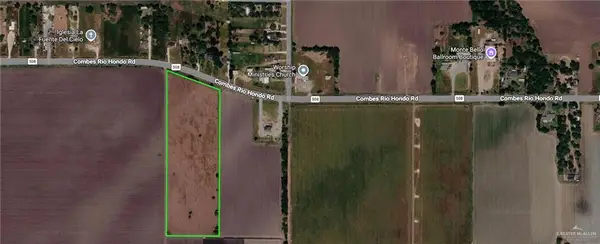 $325,000Active12.46 Acres
00 Fm 508, Harlingen, TX 78550
MLS# 494800Listed by: Fox Real Estate Pros $269,900Pending3 beds 2 baths1,851 sq. ft.
2509 Mariposa Ln., HARLINGEN, TX 78550
MLS# 29772222Listed by: STRUBHART REAL ESTATE, LLC $55,000Pending2 beds 2 baths1,005 sq. ft.
618 W Polk St., HARLINGEN, TX 78550
MLS# 29772187Listed by: REALTY ONE GROUP, MODERN EDGE $72,000Active1 beds 1 baths683 sq. ft.
1505 N 25th St. #404, HARLINGEN, TX 78550
MLS# 29772186Listed by: ROCKING K REALTY & AUCTIONS $75,000Pending3 beds 1 baths896 sq. ft.
1010 E Sul Ross Ave., HARLINGEN, TX 78550
MLS# 29772178Listed by: KELLER WILLIAMS LRGV $245,000Active5 beds 4 baths2,367 sq. ft.
2406 & 2408 Treasure Hills Cove, Harlingen, TX 78550
MLS# 90143513Listed by: JLA REALTY $227,900Active4 beds 3 baths1,826 sq. ft.
2213 S Haine Dr., HARLINGEN, TX 78550
MLS# 29772123Listed by: BALLI REALTY GROUP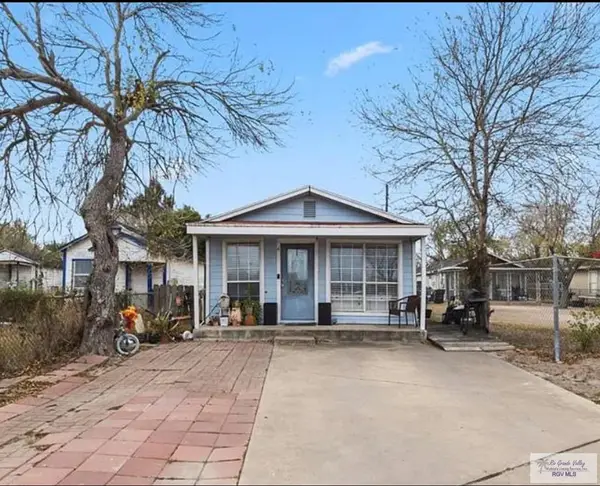 $120,000Active2 beds 2 baths1,440 sq. ft.
1018 S West Street, HARLINGEN, TX 78550
MLS# 29772121Listed by: KELLER WILLIAMS LRGV $219,000Pending4 beds 2 baths1,862 sq. ft.
2702 Emerald Lake Dr., HARLINGEN, TX 78550
MLS# 29772118Listed by: LOLLY BURNS REAL ESTATE, LLC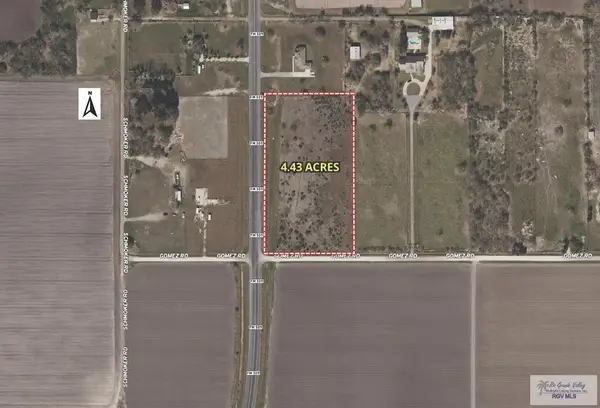 $120,000Active5 Acres
N/A Gomez Rd, RIO HONDO, TX 78583
MLS# 29772447Listed by: BAHNMAN REALTY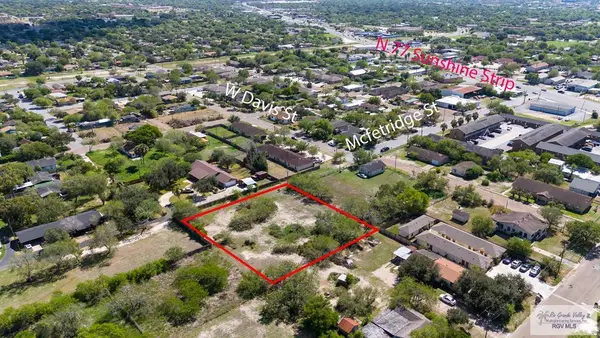 $50,000Active0.29 Acres
00 Mcfetridge, HARLINGEN, TX 78550
MLS# 29772098Listed by: KELLER WILLIAMS LRGV $215,000Active3 beds 2 baths1,384 sq. ft.
3309 Legacy Ln., HARLINGEN, TX 78550
MLS# 29772085Listed by: RE/MAX ELITE $265,000Active3 beds 2 baths1,722 sq. ft.
2402 Ella Ave., HARLINGEN, TX 78552
MLS# 29772084Listed by: KELLER WILLIAMS LRGV $210,000Active3 beds 2 baths1,786 sq. ft.
1629 W Teege Avenue, Harlingen, TX 78550
MLS# 494739Listed by: Exp Realty Llc $149,999Pending2 beds 2 baths968 sq. ft.
910 E Van Buren Ave., HARLINGEN, TX 78550
MLS# 29772070Listed by: KELLER WILLIAMS LRGV $169,000Active2 beds 2 baths1,613 sq. ft.
2004 Iowa, HARLINGEN, TX 78550
MLS# 29772072Listed by: LOLLY BURNS REAL ESTATE, LLC $149,000Active2 beds 2 baths1,088 sq. ft.
909 E Adams Ave, HARLINGEN, TX 78550
MLS# 29772073Listed by: MARCUS PHIPPS REAL ESTATE, LLC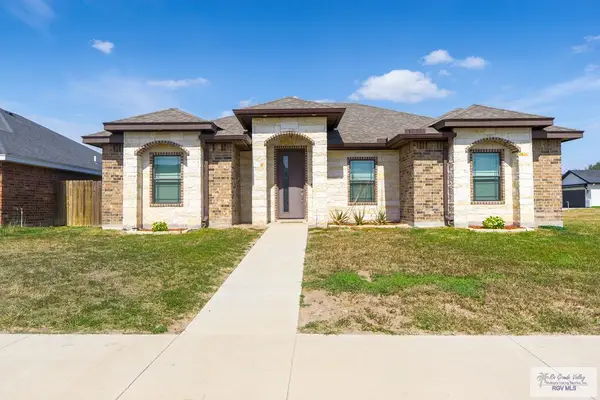 $269,900Active3 beds 2 baths1,568 sq. ft.
1717 S Adams Crossing, HARLINGEN, TX 78550
MLS# 29772056Listed by: KELLER WILLIAMS LRGV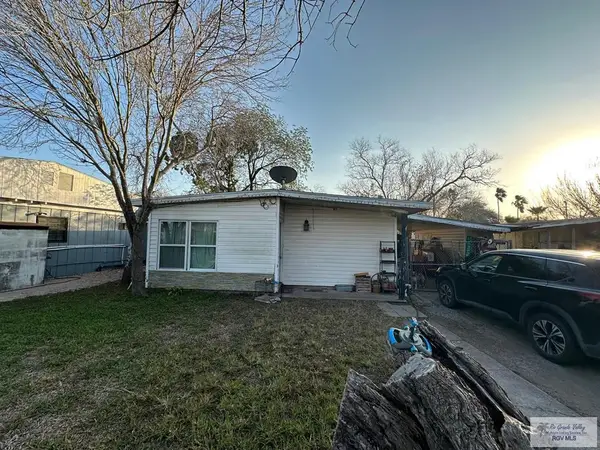 $115,000Active3 beds 1 baths977 sq. ft.
210 Mcgregor Ave., HARLINGEN, TX 78550
MLS# 29772050Listed by: EXP REALTY, LLC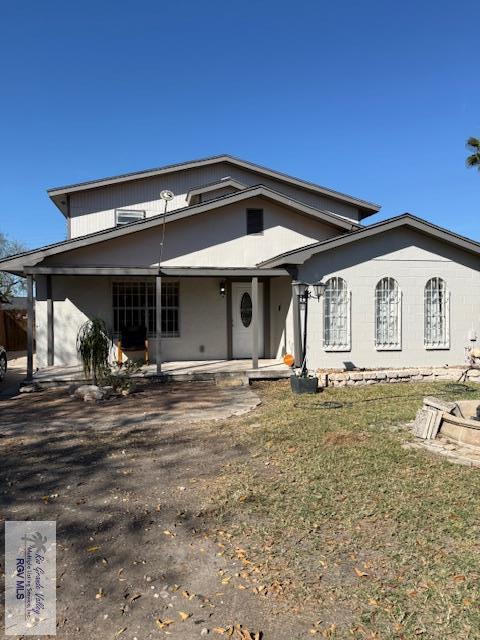 $225,000Active5 beds 3 baths2,157 sq. ft.
517 P St., HARLINGEN, TX 78552
MLS# 29772037Listed by: REALTY ONE GROUP, MODERN EDGE $350,000Pending3 beds 3 baths2,007 sq. ft.
2613 N 20 1/2 St, HARLINGEN, TX 78550
MLS# 29772033Listed by: KELLER WILLIAMS LRGV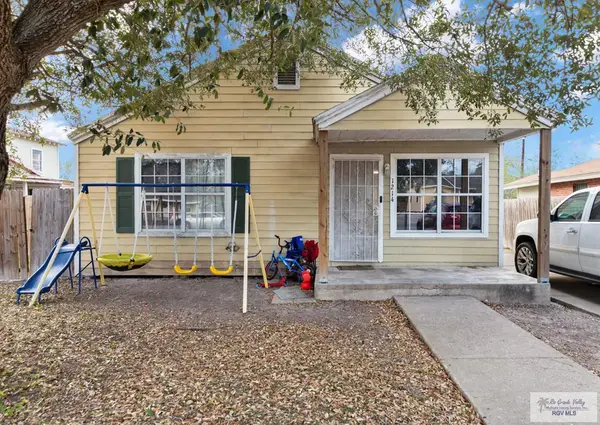 $95,000Active2 beds 1 baths841 sq. ft.
1214 S C, HARLINGEN, TX 78550
MLS# 29771995Listed by: COLDWELL BANKER IMPACT PROPERTIES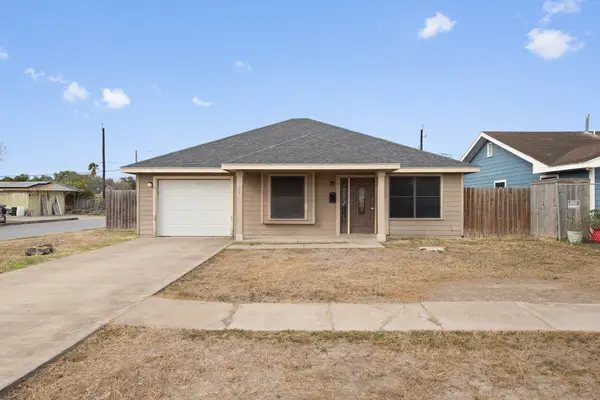 $210,000Active3 beds 2 baths1,524 sq. ft.
1001 E Monroe St., HARLINGEN, TX 78550
MLS# 29771996Listed by: COLDWELL BANKER IMPACT PROPERTIES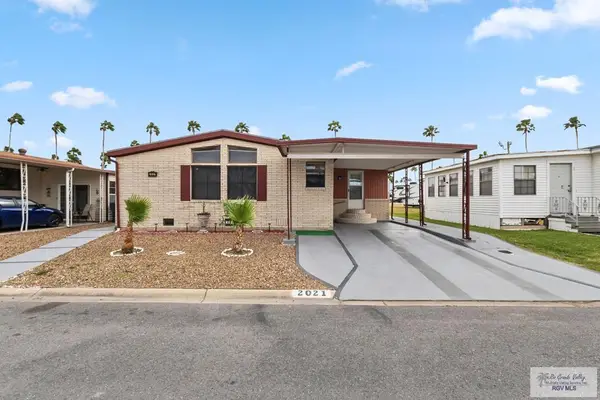 $135,000Active2 beds 2 baths1,307 sq. ft.
2021 Montana, HARLINGEN, TX 78550
MLS# 29771960Listed by: MARIPOSA REALTY RGV INC $360,000Pending-- beds -- baths2,808 sq. ft.
749 Sonesta Drive, Harlingen, TX 78550
MLS# 494275Listed by: Monarca Real Estate Group Llc $264,000Active4 beds 3 baths2,278 sq. ft.
1514 Walnut Ct., HARLINGEN, TX 78550
MLS# 29771949Listed by: KELLER WILLIAMS LRGV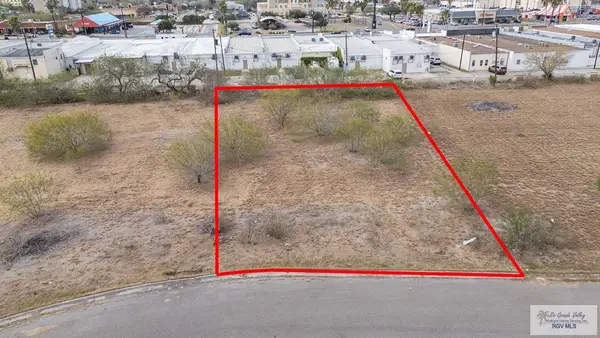 $205,000Active0.52 Acres
613 Kamali Dr., HARLINGEN, TX 78550
MLS# 29771944Listed by: COLDWELL BANKER IMPACT PROPERTIES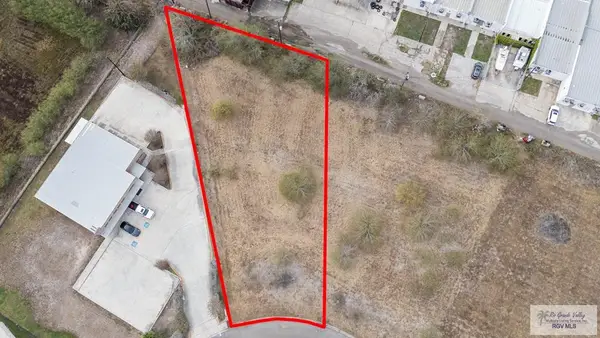 $275,000Active0.7 Acres
609 Kamali Dr., HARLINGEN, TX 78550
MLS# 29771945Listed by: COLDWELL BANKER IMPACT PROPERTIES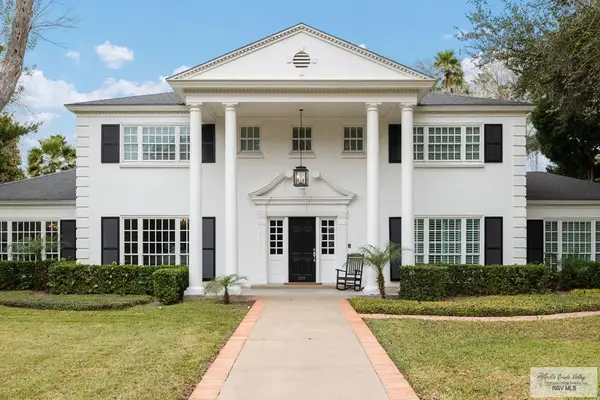 $649,000Active4 beds 4 baths4,572 sq. ft.
501 Lake Drive, HARLINGEN, TX 78550
MLS# 29771931Listed by: LOLLY BURNS REAL ESTATE, LLC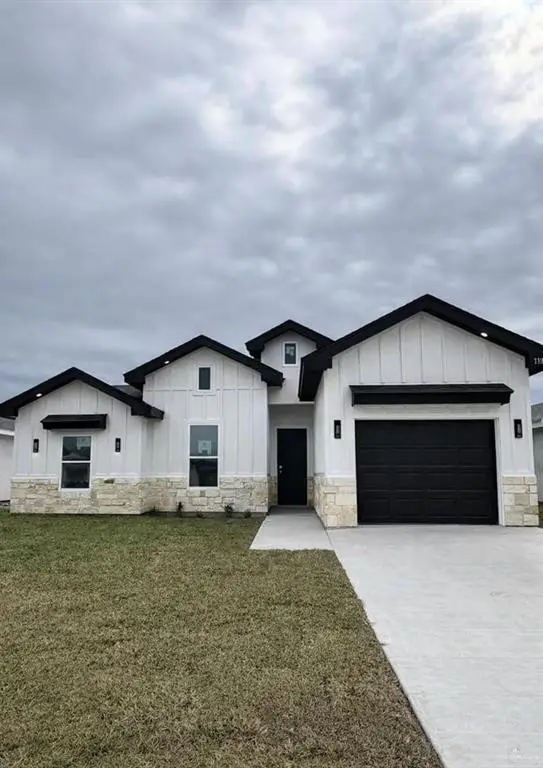 $219,147Active3 beds 2 baths1,216 sq. ft.
17938 Redwood Street, Harlingen, TX 78552
MLS# 494182Listed by: Keller Williams Lrgv $219,147Pending3 beds 2 baths1,235 sq. ft.
17928 Redwood Street, Harlingen, TX 78552
MLS# 494189Listed by: Keller Williams Lrgv $216,147Pending3 beds 2 baths1,196 sq. ft.
17918 Redwood Street, Harlingen, TX 78552
MLS# 494192Listed by: Keller Williams Lrgv $55,000Active0.19 Acres
418 N J St., HARLINGEN, TX 78550
MLS# 29771909Listed by: LIVING IN SOUTH TEXAS REALTY $210,000Pending3 beds 2 baths1,373 sq. ft.
2330 S 25th St., HARLINGEN, TX 78550
MLS# 29771894Listed by: KELLER WILLIAMS LRGV $149,900Pending3 beds 2 baths1,200 sq. ft.
2113 E Van Buren Avenue, Harlingen, TX 78550
MLS# 494044Listed by: Marcus Phipps Real Estate Llc $460,000Active-- beds -- baths4,006 sq. ft.
1722 Stone Dr., HARLINGEN, TX 78550
MLS# 29771872Listed by: COLDWELL BANKER LA MANSION REAL ESTATE BROWNSVILLE $219,147Pending3 beds 2 baths1,197 sq. ft.
17928 Redwood St #LOT 77, COMBES, TX 78552
MLS# 29771851Listed by: KELLER WILLIAMS LRGV $219,147Active3 beds 2 baths1,197 sq. ft.
17938 Redwood St #LOT 78, COMBES, TX 78552
MLS# 29771853Listed by: KELLER WILLIAMS LRGV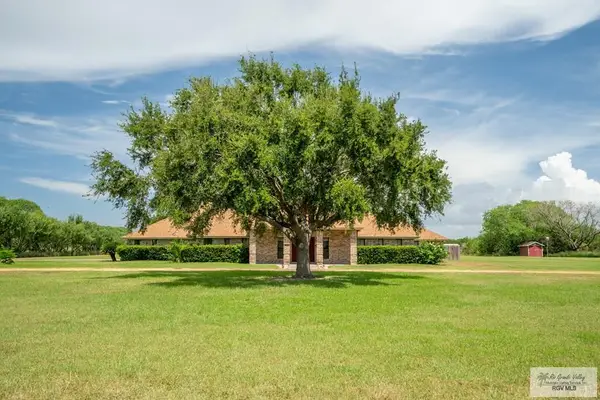 $595,000Active4 beds 3 baths3,954 sq. ft.
22301 Briggs Coleman Rd, HARLINGEN, TX 78550
MLS# 29771849Listed by: RE/MAX ELITE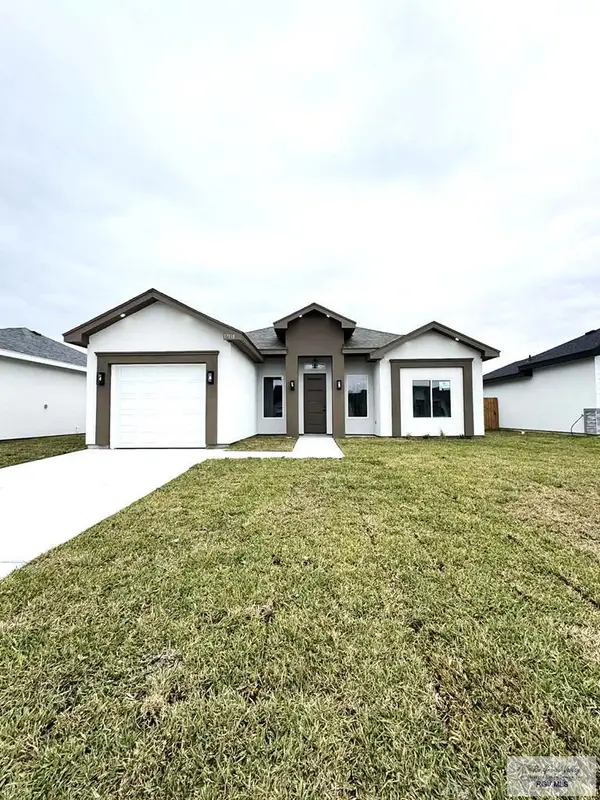 $216,147Pending3 beds 2 baths1,183 sq. ft.
17918 Redwood St #LOT 76, COMBES, TX 78552
MLS# 29771850Listed by: KELLER WILLIAMS LRGV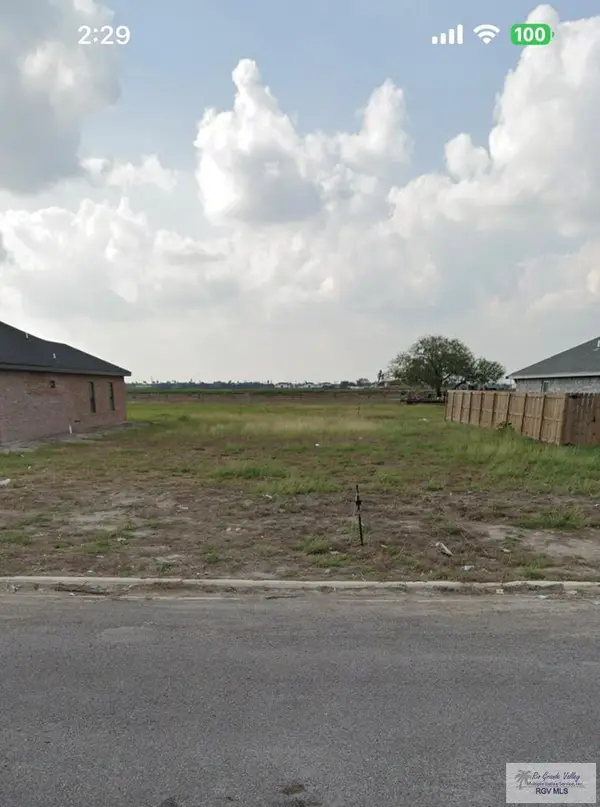 $73,000Pending0.15 Acres
1121 W Escondido Ln., HARLINGEN, TX 78550
MLS# 29771846Listed by: CAVALRY REAL ESTATE TEAM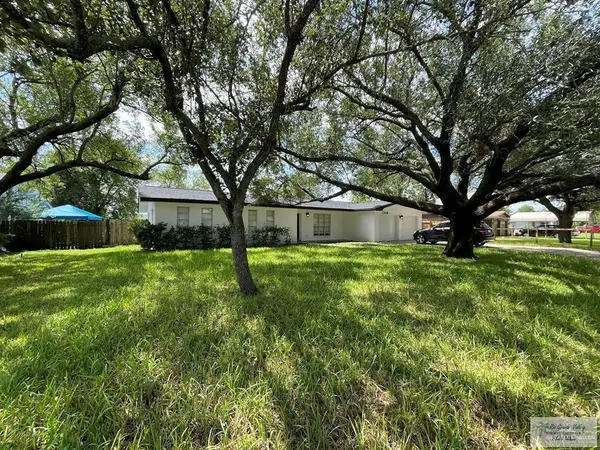 $220,000Active3 beds 2 baths1,638 sq. ft.
2308 Lisa Ann Avenue, Harlingen, TX 78550
MLS# 493787Listed by: Exp Realty Llc $230,000Active3 beds 2 baths2,134 sq. ft.
1802 Martha Street, Harlingen, TX 78550
MLS# 491315Listed by: Keller Williams Realty Rgv $175,000Active3 beds 1 baths1,168 sq. ft.
806 W Johnson Ave., HARLINGEN, TX 78550
MLS# 29771777Listed by: KELLER WILLIAMS LRGV $170,000Active3 beds 3 baths1,772 sq. ft.
1306 S B St., HARLINGEN, TX 78550
MLS# 29771756Listed by: REALTY ONE GROUP, MODERN EDGE $235,000Active3 beds 2 baths1,357 sq. ft.
1621 Dalton St., HARLINGEN, TX 78550
MLS# 29771750Listed by: KELLER WILLIAMS LRGV $460,000Active3 beds 3 baths2,411 sq. ft.
3002 Pinehurst Drive, Harlingen, TX 78550
MLS# 493541Listed by: Legacy Realty Group Rgv $285,000Active4 beds 3 baths1,704 sq. ft.
2321 Cove Real Dr, HARLINGEN, TX 78550
MLS# 29771746Listed by: KELLER WILLIAMS REALTY RIO GRANDE VALLEY $209,900Pending3 beds 2 baths1,672 sq. ft.
1913 Laurel Drive, Harlingen, TX 78550
MLS# 493510Listed by: V.I.P. Realty $154,000Active3 beds 2 baths1,190 sq. ft.
4201 S Houston Drive, Harlingen, TX 78550
MLS# 493026Listed by: Dominion Real Estate $155,000Pending2 beds 2 baths1,303 sq. ft.
1000 Camelot Drive #6213, Harlingen, TX 78550
MLS# 492682Listed by: The International Real Estate Company $279,990Active3 beds 2 baths1,690 sq. ft.
1933 Dean Dr, HARLINGEN, TX 78550
MLS# 29771651Listed by: IMPERIO REAL ESTATE $299,990Active4 beds 2 baths1,980 sq. ft.
1921 Dean Dr, HARLINGEN, TX 78550
MLS# 29771653Listed by: IMPERIO REAL ESTATE $135,000Active0.28 Acres
N 77 Sunshine Strip, HARLINGEN, TX 78550
MLS# 29771615Listed by: ENCORE FINE PROPERTIES $184,900Active3 beds 2 baths2,089 sq. ft.
1310 E Bowie Ave., HARLINGEN, TX 78550
MLS# 29771613Listed by: V.I.P. REALTY $189,000Active3 beds 2 baths1,303 sq. ft.
329 Chico Blvd, HARLINGEN, TX 78550
MLS# 29771601Listed by: KELLER WILLIAMS LRGV $78,000Pending1 beds 1 baths647 sq. ft.
1000 Camelot Dr. #6075, HARLINGEN, TX 78550
MLS# 29771596Listed by: COLDWELL BANKER IMPACT PROPERTIES $269,900Active3 beds 2 baths1,540 sq. ft.
21148 Breedlove Road, Harlingen, TX 78550
MLS# 477420Listed by: The Mbteam $269,900Active3 beds 2 baths1,540 sq. ft.
21148 Breedlove St., HARLINGEN, TX 78550
MLS# 29767354Listed by: THE MBTEAM $240,685Active3 beds 2 baths1,315 sq. ft.
17919 Redwood Street, Combes, TX 78552
MLS# 492891Listed by: Exp Realty Llc $299,000Active3 beds 2 baths1,496 sq. ft.
2402 Treasure, Harlingen, TX 78550
MLS# 492872Listed by: Keller Williams Lrgv $289,000Active3 beds 2 baths1,525 sq. ft.
2318 Treasure, Harlingen, TX 78550
MLS# 492864Listed by: Keller Williams Lrgv $245,000Pending3 beds 2 baths1,715 sq. ft.
1602 Dalton St., HARLINGEN, TX 78550
MLS# 29771552Listed by: LEGACY REALTY GROUP RGV $119,000Active2 beds 1 baths1,188 sq. ft.
1317 S B Street, Harlingen, TX 78550
MLS# 492730Listed by: Bordertown Realty, Llc $85,000Pending5.07 Acres
00 Hoening Rd., HARLINGEN, TX 78550
MLS# 29771514Listed by: EZ REALTY & PROPERTY MGT, LLC $914,760Active2 Acres
2803 S Expressway 83, HARLINGEN, TX 78550
MLS# 29771492Listed by: CHRE CINDY HOPKINS REAL ESTATE $225,000Pending4 beds 2 baths2,362 sq. ft.
2313 Susan St., HARLINGEN, TX 78550
MLS# 29771493Listed by: BAHNMAN REALTY $160,000Active2 beds 1 baths975 sq. ft.
909 W Curtis St., HARLINGEN, TX 78550
MLS# 29771346Listed by: LOLLY BURNS REAL ESTATE, LLC $125,000Active2 beds 1 baths1,000 sq. ft.
1019 5th St., HARLINGEN, TX 78552
MLS# 29771470Listed by: JOE NUNEZ REALTY $182,500Pending4 beds 3 baths1,486 sq. ft.
609 E Filmore Ave, HARLINGEN, TX 78550
MLS# 29771466Listed by: V.I.P. REALTY $185,000Pending3 beds 2 baths1,203 sq. ft.
605 Lozano Street, Harlingen, TX 78550
MLS# 492497Listed by: Jade Real Estate Llc
 $79,900Pending2 beds 1 baths780 sq. ft.
2721 Quail Run #5, HARLINGEN, TX 78550
MLS# 29771440Listed by: CENTURY 21 JOHNSTON COMPANY $80,000Pending0.56 Acres
0 Paloma Celeste Ct., HARLINGEN, TX 78550
MLS# 29771425Listed by: RCR REAL CONNECT REALTY $218,750Active3 beds 2 baths1,200 sq. ft.
1410 W Monroe Ave., HARLINGEN, TX 78550
MLS# 29771426Listed by: KELLER WILLIAMS LRGV $218,750Active3 beds 2 baths1,200 sq. ft.
1406 W Monroe Ave., HARLINGEN, TX 78550
MLS# 29771423Listed by: KELLER WILLIAMS LRGV $60,000Active0.16 Acres
1402 W Monroe Ave. #Lot 9, HARLINGEN, TX 78550
MLS# 29771424Listed by: KELLER WILLIAMS LRGV $289,000Active3 beds 2 baths1,525 sq. ft.
2318 Treasure Cove # 12, HARLINGEN, TX 78550
MLS# 29771412Listed by: KELLER WILLIAMS LRGV $82,500Pending1 beds 2 baths952 sq. ft.
4225 N Minnesota St., HARLINGEN, TX 78550
MLS# 29771381Listed by: RE/MAX ELITE $239,000Active4 beds 2 baths1,796 sq. ft.
2401 E Austin Ave., HARLINGEN, TX 78550
MLS# 29771367Listed by: MARCUS PHIPPS REAL ESTATE, LLC- Open Sat, 11 to 2pm
 $263,500Active2 beds 2 baths2,119 sq. ft.
1706 Hickory Ct., HARLINGEN, TX 78550
MLS# 29771341Listed by: KELLER WILLIAMS LRGV  $399,000Active4 beds 3 baths3,180 sq. ft.
2405 Lazy Lake Drive, Harlingen, TX 78550
MLS# 492194Listed by: Keller Williams Lrgv $89,900Pending2 beds 3 baths1,300 sq. ft.
212 E Polk, Harlingen, TX 78550
MLS# 104749Listed by: PATRICK MCNULTY, BROKER $89,900Pending2 beds 2 baths1,300 sq. ft.
212 E Polk #3, HARLINGEN, TX 78550
MLS# 29771256Listed by: PATRICK MCNULTY, BROKER $299,000Pending4 beds 3 baths2,040 sq. ft.
717 Vinson Ave., HARLINGEN, TX 78550
MLS# 29771249Listed by: LOLLY BURNS REAL ESTATE, LLC $69,900Active0.16 Acres
0 E Madison Ave #9, HARLINGEN, TX 78550
MLS# 29771208Listed by: RCR REAL CONNECT REALTY $219,600Pending3 beds 2 baths1,200 sq. ft.
17909 Redwood St, HARLINGEN, TX 78552
MLS# 29771201Listed by: LEGACY REALTY GROUP RGV $325,000Pending3 beds 3 baths2,097 sq. ft.
1521 Autumn Court, Harlingen, TX 78550
MLS# 491942Listed by: Marcus Phipps Real Estate Llc $125,000Active2 beds 1 baths900 sq. ft.
206 N 27th St., HARLINGEN, TX 78550
MLS# 29771154Listed by: HOMESMART $177,028Active3 beds 2 baths1,394 sq. ft.
206 W Beck Ave., HARLINGEN, TX 78550
MLS# 29771136Listed by: KELLER WILLIAMS LRGV $299,000Active-- beds -- baths2,746 sq. ft.
722 Tumbleweed Ct, HARLINGEN, TX 78550
MLS# 29771124Listed by: LOLLY BURNS REAL ESTATE, LLC $195,500Pending3 beds 2 baths1,700 sq. ft.
719 W White House Cir, HARLINGEN, TX 78550
MLS# 29771120Listed by: KELLER WILLIAMS LRGV $129,000Pending2 beds 2 baths1,380 sq. ft.
718 E Pierce Ave., HARLINGEN, TX 78550
MLS# 29771117Listed by: BAHNMAN REALTY $1,100,000Pending5 beds 6 baths8,241 sq. ft.
3201 Lazy Lake Dr, HARLINGEN, TX 78550
MLS# 29771109Listed by: BADIOLA REAL ESTATE LLC $225,000Pending3 beds 2 baths1,404 sq. ft.
2118 Skyview Circle, Harlingen, TX 78550
MLS# 491667Listed by: Star Properties Real Estate $189,900Pending4 beds 2 baths1,480 sq. ft.
229 E Beck Ave., HARLINGEN, TX 78550
MLS# 29771091Listed by: CAVALRY REAL ESTATE TEAM $288,000Active2 beds 2 baths1,578 sq. ft.
805 Parkview Circle, Harlingen, TX 78550
MLS# 491641Listed by: Southmost Realty $415,000Active-- beds -- baths3,504 sq. ft.
2207 Northridge Ave, HARLINGEN, TX 78550
MLS# 29771068Listed by: TNT REAL ESTATE $80,000Active2 beds 1 baths864 sq. ft.
1629 Barcelona Ave., HARLINGEN, TX 78550
MLS# 29771257Listed by: ELEMENT REALTY, LLC $225,000Active3 beds 2 baths1,742 sq. ft.
2910 La Costa Ct, HARLINGEN, TX 78550
MLS# 29771017Listed by: KELLER WILLIAMS LRGV $365,000Active3 beds 3 baths2,178 sq. ft.
313 Woodhollow Lane, Harlingen, TX 78550
MLS# 491305Listed by: Legacy Realty Group Rgv $320,000Pending3 beds 2 baths2,367 sq. ft.
1409 Pine Ct. #Lot 35, HARLINGEN, TX 78550
MLS# 29765523Listed by: RE/MAX ELITE $262,500Pending3 beds 3 baths1,442 sq. ft.
4326 Casamigos Street, Harlingen, TX 78550
MLS# 491059Listed by: Legacy Realty Group Rgv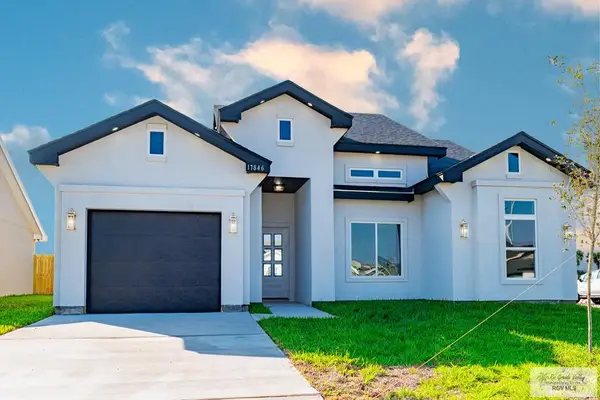 $251,830Pending3 beds 2 baths1,376 sq. ft.
17846 Redwood St, HARLINGEN, TX 78552
MLS# 29770951Listed by: REALTY ONE GROUP, MODERN EDGE $249,900Active4 beds 2 baths1,730 sq. ft.
206 Dominion, Harlingen, TX 78550
MLS# 1931195Listed by: REAL BROKER, LLC $224,175Active3 beds 2 baths1,225 sq. ft.
18043 Redwood St, HARLINGEN, TX 78552
MLS# 29770935Listed by: REALTY ONE GROUP, MODERN EDGE $365,000Active3 beds 3 baths2,029 sq. ft.
1869 Sam Circle, Harlingen, TX 78552
MLS# 489096Listed by: Realty One Group, Modern Edge $2,000,000Pending1.67 Acres
901 W Harrison Ave., HARLINGEN, TX 78550
MLS# 29770665Listed by: ROCKING K REALTY & AUCTIONS $229,900Active3 beds 2 baths1,373 sq. ft.
725 Washington Circle, Harlingen, TX 78550
MLS# 491016Listed by: Exp Realty Llc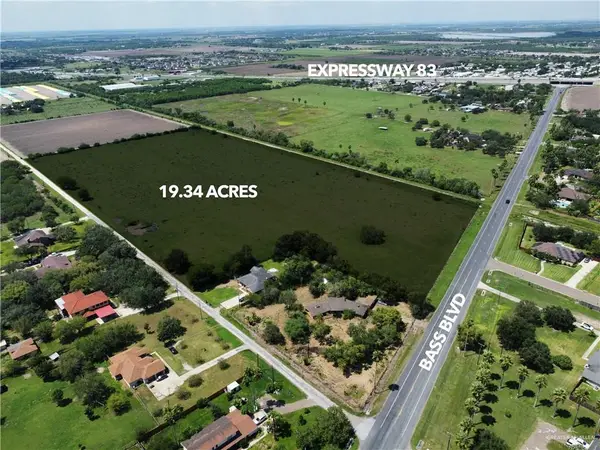 $785,000Active19.34 Acres
00 Bass Boulevard, Harlingen, TX 78550
MLS# 491008Listed by: Eric Real Estate Group, Llc $190,000Pending3 beds 2 baths1,570 sq. ft.
1922 Pheasant Drive, Harlingen, TX 78550
MLS# 490899Listed by: Keller Williams Lrgv $152,500Pending3 beds 2 baths1,492 sq. ft.
530 N P Street, Harlingen, TX 78550
MLS# 490839Listed by: Fox Real Estate Pros $289,000Active3 beds 2 baths1,496 sq. ft.
2326 Treasure Cove #LOT 14, HARLINGEN, TX 78550
MLS# 29770857Listed by: KELLER WILLIAMS LRGV $430,000Active5 beds 5 baths3,594 sq. ft.
2806 N Augusta National Drive, Harlingen, TX 78550
MLS# 490783Listed by: Redbird Realty, Llc $284,900Active3 beds 2 baths1,574 sq. ft.
2314 Treasure Cove #LOT 11, HARLINGEN, TX 78550
MLS# 29770856Listed by: KELLER WILLIAMS LRGV $99,999Active0.24 Acres
N 77 Sunshine Strip, HARLINGEN, TX 78550
MLS# 29770846Listed by: REALTY ONE GROUP, MODERN EDGE $284,900Active3 beds 2 baths1,496 sq. ft.
2402 Treasure Cove #Lot 15, HARLINGEN, TX 78550
MLS# 29770514Listed by: KELLER WILLIAMS LRGV $486,663Active0.41 Acres
814 W Harrison Ave., HARLINGEN, TX 78550
MLS# 29770812Listed by: ROCKING K REALTY & AUCTIONS $150,000Active0.5 Acres
Address Withheld By Seller, HARLINGEN, TX 78550
MLS# 29770804Listed by: REALTY ONE GROUP, MODERN EDGE $549,000Active4 beds 5 baths3,682 sq. ft.
3006 Cypress Gardens, HARLINGEN, TX 78550
MLS# 29770798Listed by: KELLER WILLIAMS LRGV $239,900Pending3 beds 2 baths1,589 sq. ft.
1602 Christian Circle, Harlingen, TX 78550
MLS# 490562Listed by: Keller Williams Lrgv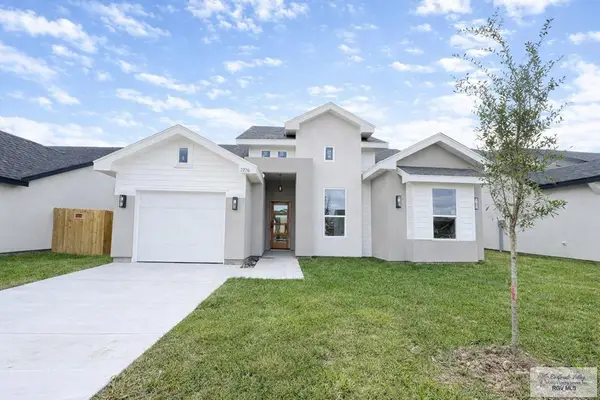 $249,900Active3 beds 2 baths1,390 sq. ft.
17856 Redwood St #LOT 70, COMBES, TX 78552
MLS# 29770787Listed by: KELLER WILLIAMS LRGV $224,900Active4 beds 3 baths1,466 sq. ft.
2214 S Christian Circle, Harlingen, TX 78550
MLS# 490271Listed by: The Mbteam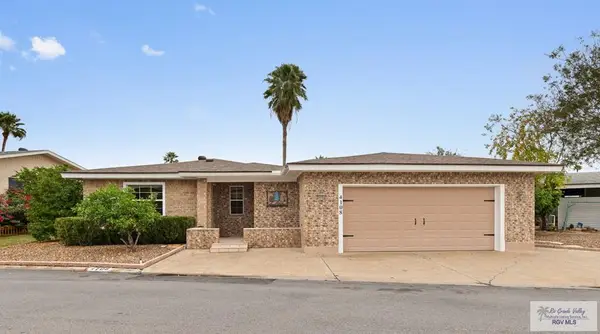 $240,000Active2 beds 2 baths1,515 sq. ft.
4108 Minnesota St., HARLINGEN, TX 78550
MLS# 29770761Listed by: MARCUS PHIPPS REAL ESTATE, LLC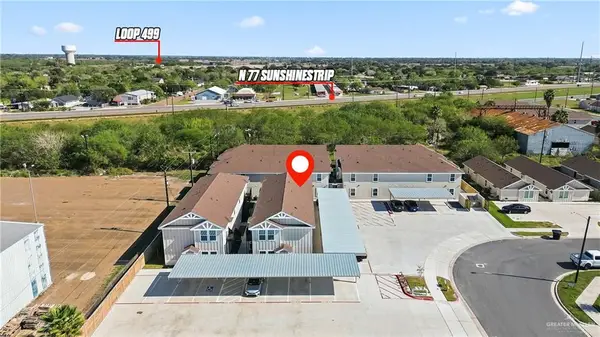 $3,200,000Active-- beds -- baths5,730 sq. ft.
2204 Northridge Avenue, Harlingen, TX 78550
MLS# 488897Listed by: Nai Stx $760,000Active-- beds -- baths2,544 sq. ft.
2005 Southridge Avenue, Harlingen, TX 78550
MLS# 488901Listed by: Nai Stx $760,000Active-- beds -- baths5,088 sq. ft.
2008 Southridge Avenue, Harlingen, TX 78550
MLS# 488934Listed by: Nai Stx $295,000Pending1.93 Acres
0 Expressway 77, HARLINGEN, TX 78550
MLS# 29770735Listed by: COLDWELL BANKER IMPACT PROPERTIES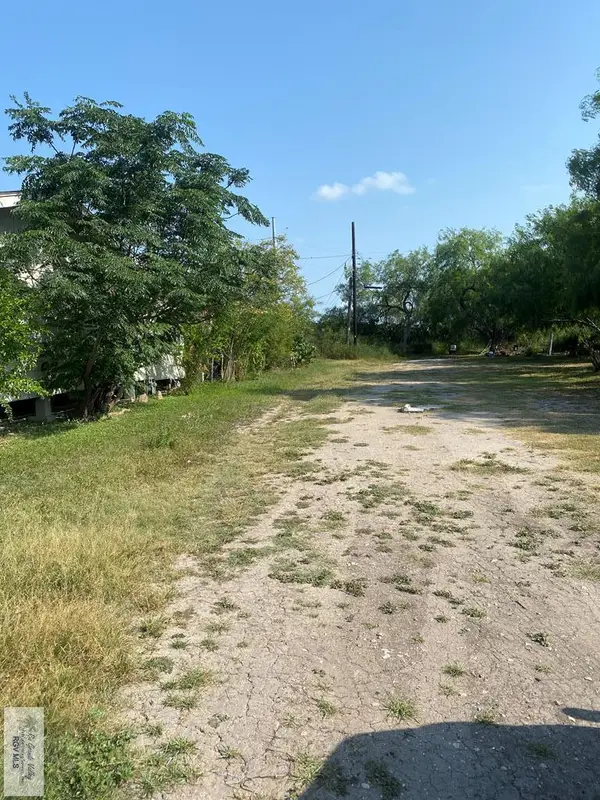 $34,999Active0 Acres
Address Withheld By Seller, HARLINGEN, TX 78550
MLS# 29765108Listed by: LEGACY REALTY GROUP RGV $259,900Pending4 beds 2 baths1,738 sq. ft.
2225 Ella Ave., HARLINGEN, TX 78550
MLS# 29770728Listed by: KELLER WILLIAMS LRGV $303,000Active3 beds 2 baths1,961 sq. ft.
2718 N Rose St., HARLINGEN, TX 78550
MLS# 29770711Listed by: KELLER WILLIAMS LRGV $215,900Pending4 beds 2 baths1,947 sq. ft.
129 W Spencer Ct., Harlingen, TX 78550
MLS# 104665Listed by: LEGACY REALTY GROUP RGV $188,000Pending4 beds 3 baths1,888 sq. ft.
808 E Whitehouse Circle, Harlingen, TX 78550
MLS# 490324Listed by: Bahnman Realty, Inc. $225,000Pending3 beds 2 baths1,400 sq. ft.
1301 S M Street, Harlingen, TX 78550
MLS# 488798Listed by: Ursa Real Estate $135,000Active1.42 Acres
lot 3 Briggs Cloeman Briggs Road, Harlingen, TX 78550
MLS# 490304Listed by: Walker Realty $135,000Active1.42 Acres
lot 2 Briggs Cloeman Briggs Coleman Road, Harlingen, TX 78550
MLS# 489189Listed by: Walker Realty $95,000Active4 beds 2 baths1,686 sq. ft.
817 E Parkwood Drive, Harlingen, TX 78550
MLS# 490282Listed by: Keller Williams Lrgv $119,000Pending2 beds 2 baths1,091 sq. ft.
1000 Camelot Dr. #6117, HARLINGEN, TX 78550
MLS# 29770682Listed by: KEY REALTY $180,500Active4 beds 2 baths1,230 sq. ft.
3914 Darrell Dr., HARLINGEN, TX 78550
MLS# 29770874Listed by: GRT REALTY $179,000Pending2 beds 2 baths1,667 sq. ft.
1928 W Indiana Cir., HARLINGEN, TX 78550
MLS# 29770651Listed by: LOLLY BURNS REAL ESTATE, LLC $229,000Pending3 beds 2 baths1,293 sq. ft.
4350 Casamigos St, HARLINGEN, TX 78550
MLS# 29770622Listed by: DURAN REALTY, LLC $162,000Pending3 beds 1 baths1,112 sq. ft.
2406 Cesar Menchaca Ct., HARLINGEN, TX 78550
MLS# 29770603Listed by: KELLER WILLIAMS LRGV $45,000Active0.14 Acres
0 Lamb Ave., HARLINGEN, TX 78550
MLS# 29770567Listed by: GRT REALTY $429,000Active4 beds 4 baths2,227 sq. ft.
3722 White Rock Circle, HARLINGEN, TX 78552
MLS# 29770561Listed by: SPI REALTY $74,900Pending2 beds 2 baths1,388 sq. ft.
1501 High Street, Harlingen, TX 78550
MLS# 488818Listed by: Big Realty $75,000Pending0.16 Acres
0 Gabriella St, HARLINGEN, TX 78550
MLS# 29770524Listed by: BALBOA REALTY $89,900Active0.41 Acres
0 W Jackson Avenue, Harlingen, TX 78550
MLS# 497873Listed by: Tnt Real Estate $128,000Pending2 beds 1 baths1,080 sq. ft.
1509 N Parkwood Dr, HARLINGEN, TX 78550
MLS# 29770485Listed by: BAHNMAN REALTY $239,500Active3 beds 2 baths1,398 sq. ft.
17879 Redwood St, COMBES, TX 78552
MLS# 29770481Listed by: COLDWELL BANKER LA MANSION REAL ESTATE BROWNSVILLE $249,900Active3 beds 2 baths1,513 sq. ft.
1830 Swan Ln., HARLINGEN, TX 78550
MLS# 29769919Listed by: GRT REALTY $440,000Pending5 beds 5 baths3,677 sq. ft.
21895 Amistad Rd., HARLINGEN, TX 78550
MLS# 29770424Listed by: THE MBTEAM $177,999Active4 beds 2 baths1,969 sq. ft.
1022 E Filmore Avenue, Harlingen, TX 78550
MLS# 488400Listed by: Real Broker Llc $167,000Pending3 beds 3 baths1,772 sq. ft.
1306 S B St., HARLINGEN, TX 78550
MLS# 29770409Listed by: ROCKING K REALTY & AUCTIONS $72,000Pending0.17 Acres
1205 Escondido Dr., HARLINGEN, TX 78550
MLS# 29770403Listed by: KELLER WILLIAMS LRGV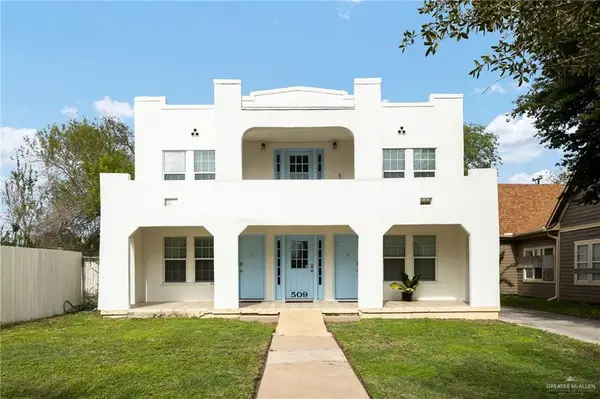 $272,000Pending-- beds -- baths2,992 sq. ft.
509 E Taylor Street, Harlingen, TX 78550
MLS# 488305Listed by: Exp Realty, Llc $149,900Pending3 beds 1 baths1,160 sq. ft.
209 W Beck Ave., HARLINGEN, TX 78550
MLS# 29770385Listed by: LOLLY BURNS REAL ESTATE, LLC $225,000Pending3 beds 2 baths1,318 sq. ft.
2401 Mariposa Ln., HARLINGEN, TX 78550
MLS# 29770386Listed by: LOLLY BURNS REAL ESTATE, LLC $55,000Active0.16 Acres
119 Filmore Avenue, Harlingen, TX 78550
MLS# 488250Listed by: Monarca Real Estate Group Llc $205,000Active3 beds 1 baths1,740 sq. ft.
822 E Polk, HARLINGEN, TX 78550
MLS# 29770351Listed by: MCNABB AND CO. REAL ESTATE SERVICES $269,900Active3 beds 2 baths1,540 sq. ft.
21120 Breedlove St., HARLINGEN, TX 78550
MLS# 29767692Listed by: RCR REAL CONNECT REALTY $179,900Pending3 beds 1 baths1,226 sq. ft.
21288 Road 839, Harlingen, TX 78550
MLS# 487801Listed by: Keller Williams Lrgv $110,500Pending2 beds 1 baths996 sq. ft.
422 E Polk, HARLINGEN, TX 78550
MLS# 29770303Listed by: CENTURY 21 JOHNSTON COMPANY $271,590Active3 beds 2 baths1,522 sq. ft.
1937 Dean Dr, HARLINGEN, TX 78550
MLS# 29771650Listed by: IMPERIO REAL ESTATE $220,034Pending3 beds 2 baths1,202 sq. ft.
17857 Redwood Street, Combes, TX 78552
MLS# 488033Listed by: Exp Realty, Llc $194,000Active2 beds 2 baths1,647 sq. ft.
218 E Dunkin Cir, HARLINGEN, TX 78550
MLS# 29770290Listed by: MARCUS PHIPPS REAL ESTATE, LLC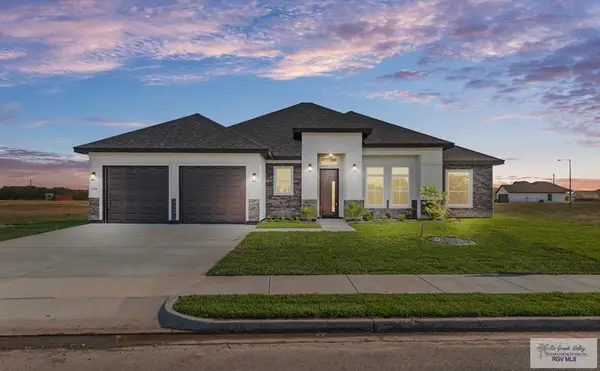 $396,825Active4 beds 3 baths2,145 sq. ft.
2906 Golden Bear Dr., HARLINGEN, TX 78550
MLS# 29770286Listed by: REALTY ONE GROUP, MODERN EDGE $269,900Pending3 beds 3 baths1,604 sq. ft.
4321 Casamigos St, HARLINGEN, TX 78522
MLS# 29770254Listed by: LIZ REALTY, LLC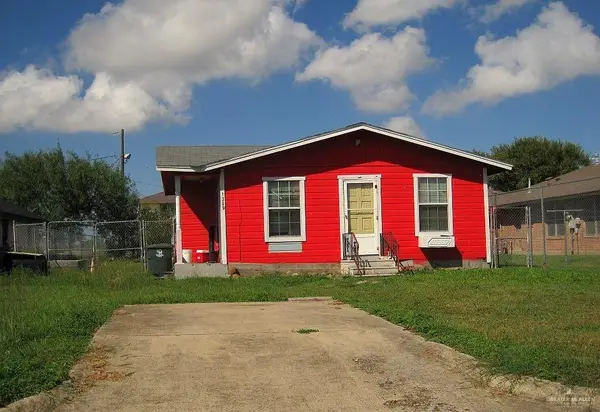 $115,000Active3 beds 1 baths1,184 sq. ft.
1309 N Sunset Drive, Harlingen, TX 78550
MLS# 487879Listed by: Walker Realty $370,000Active4 beds 3 baths2,000 sq. ft.
3402 Bear Creek Ct., HARLINGEN, TX 78550
MLS# 29770210Listed by: REALTY ONE GROUP, MODERN EDGE $40,000Active0.06 Acres
179 Chippewa, HARLINGEN, TX 78550
MLS# 29770207Listed by: RE/MAX PLATINUM $155,000Pending3 beds 3 baths1,859 sq. ft.
1825 E Washington Ave., HARLINGEN, TX 78550
MLS# 29770169Listed by: TRINITY REALTY & INVESTMENTS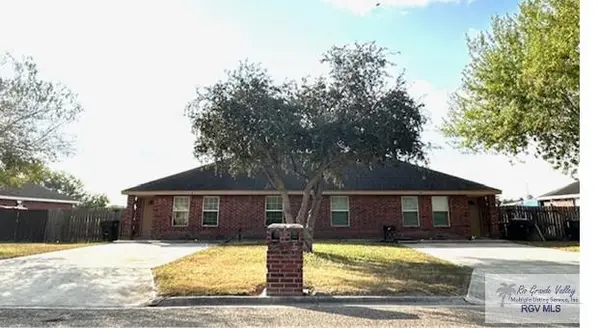 $260,000Active-- beds -- baths2,008 sq. ft.
2101 N G St., HARLINGEN, TX 78550
MLS# 29770164Listed by: BAHNMAN REALTY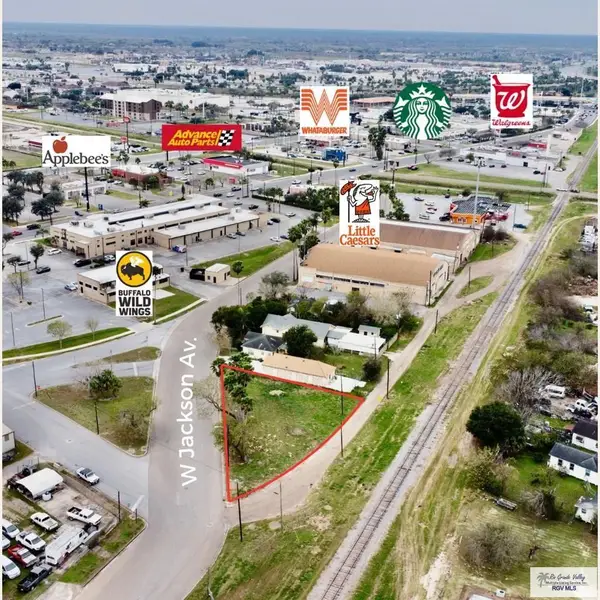 $89,900Active0.41 Acres
0 W Jackson Ave. #1, 2 & 3, HARLINGEN, TX 78550
MLS# 29774785Listed by: TNT REAL ESTATE $550,000Pending3 beds 4 baths3,889 sq. ft.
3006 Indian Wells, HARLINGEN, TX 78550
MLS# 29770136Listed by: ENCORE FINE PROPERTIES $259,000Pending3 beds 2 baths1,730 sq. ft.
429 Jennifer Ct., HARLINGEN, TX 78550
MLS# 29770132Listed by: LOLLY BURNS REAL ESTATE, LLC $259,000Pending-- beds -- baths3,604 sq. ft.
417 Mississippi St., HARLINGEN, TX 78550
MLS# 29770095Listed by: RE/MAX ELITE $375,000Active3 beds 2 baths2,750 sq. ft.
2913 Emerald Lake Dr., HARLINGEN, TX 78550
MLS# 29770091Listed by: CAVALRY REAL ESTATE TEAM $145,000Pending3 beds 2 baths1,208 sq. ft.
3310 Palmetto Palm Dr., HARLINGEN, TX 78550
MLS# 29770030Listed by: REALTY ONE GROUP, MODERN EDGE $218,000Pending3 beds 2 baths1,545 sq. ft.
1518 Burke Court, Harlingen, TX 78550
MLS# 486867Listed by: Cantwell & Co. Real Estate $52,000Active0.16 Acres
00 Botts Ave, HARLINGEN, TX 78550
MLS# 29769999Listed by: LEGACY REALTY GROUP RGV
Local realty services provided by:CENTURY 21 Johnston Company, CENTURY 21 North East, CENTURY 21 Alliance Properties, CENTURY 21 Lucky Money Real Estate, CENTURY 21 Middleton
Based on information from South Texas MLS, LLC as 2026. All information provided is deemed reliable but is not guaranteed and should be independently verified. South Texas MLS, LLC provides the MLS and all content therein “AS IS” and without any warranty, express or implied. MLS aggregate data is a copyright of Texas Association of REALTORS® (TAR) and that the reader may not reproduce or distribute the MLS aggregate data.
Information provided, in part, by North Texas Real Estate Information Systems, Inc. Last Updated April 1, 2026 Listings with the NTREIS logo are listed by brokerages other than CENTURY 21 Alliance Properties.
Copyright 2026, Houston Realtors Information Service, Inc. All information provided is deemed reliable but is not guaranteed and should be independently verified. IDX information is provided exclusively for consumers' personal, non-commercial use, it may not be used for any purpose other than to identify prospective properties consumers may be interested in purchasing, and the data is deemed reliable but is not guaranteed accurate by the MLS.
Popular searches near 78550
Popular neighborhoods near 78550
- Camelot Independent Retirement Village, Harlingen homes for sale
- Cottonwood Country Club & Golf Course, Harlingen homes for sale
- Country Club Estates at Vicc, Brownsville homes for sale
- Del Mar Heights, Los Fresnos homes for sale
- Edcouch, Edcouch homes for sale
- El Valle Grande, Brownsville homes for sale
- Encantada-Ranchito El Calaboz, San Benito homes for sale
- Indian Lake, Los Fresnos homes for sale
- La Paloma, San Benito homes for sale
- Laguna Vista, Port Isabel homes for sale
- Land O'Lake, Brownsville homes for sale
- Mercedes Original Townsite, Mercedes homes for sale
- Olmito, Olmito homes for sale
- Palm Valley, Harlingen homes for sale
- Rio Del Sol, Brownsville homes for sale
- South Padre Island Golf Club, Port Isabel homes for sale
- Tierra Santa, Weslaco homes for sale
- Treasure Hills, Harlingen homes for sale
- Villa Los Pinos, Brownsville homes for sale
- Winter Haven, Brownsville homes for sale
Protect your home and budget from life's surprises with an Assurant Home Warranty, backed by a partner that supports you through every step of homeownership. Explore Plans.
©2026 Century 21 Real Estate LLC. All rights reserved. CENTURY 21®, the CENTURY 21 Logo and C21® are service marks owned by Century 21 Real Estate LLC. Century 21 Real Estate LLC fully supports the principles of the Fair Housing Act and the Equal Opportunity Act. Each office is independently owned and operated. Listing information is deemed reliable but not guaranteed accurate.