- Angelus Mesa, Los Angeles homes for sale
- Arlington Park, Los Angeles homes for sale
- Baldwin Village, Los Angeles homes for sale
- Chesterfield Square, Los Angeles homes for sale
- Exposition Park, Los Angeles homes for sale
- Exposition Park West, Los Angeles homes for sale
- Florence, Los Angeles homes for sale
- Gramercy Park, Los Angeles homes for sale
- Hyde Park, Los Angeles homes for sale
- Jefferson Park, Los Angeles homes for sale
- King Estates, Los Angeles homes for sale
- Leimert Park, Los Angeles homes for sale
- Manchester Square, Los Angeles homes for sale
- South Los Angeles, Los Angeles homes for sale
- Vermont Knolls, Los Angeles homes for sale
- Vermont-Slauson, Los Angeles homes for sale
- Vermont Square, Los Angeles homes for sale
- Vermont Vista, Los Angeles homes for sale
- View Park-Windsor Hills, Los Angeles homes for sale
- Westmont, Los Angeles homes for sale
Harvard Park, Los Angeles, CA - homes for sale
41 of 41 results displayed
- New
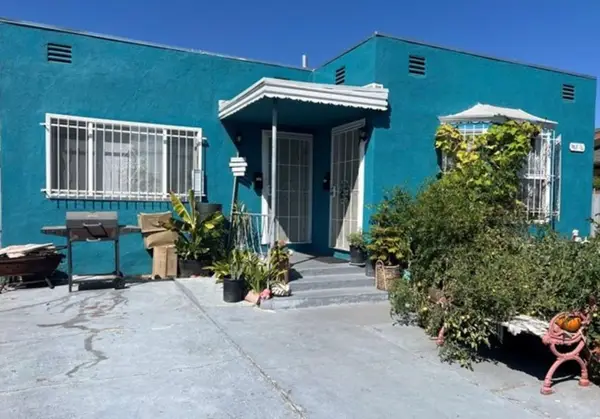 $875,000Active3 beds -- baths1,971 sq. ft.
1541 W 59th, Los Angeles, CA 90047
MLS# CRWS26066061Listed by: REAL CONSULTANTS - New
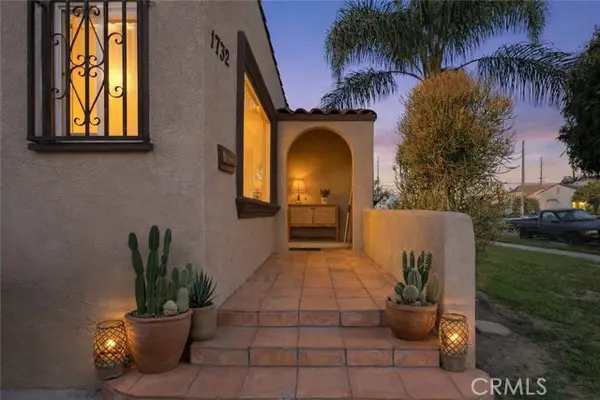 $719,000Active3 beds 2 baths1,276 sq. ft.
1732 W 65th Place, Los Angeles, CA 90047
MLS# CRDW26064152Listed by: EHOMES - New
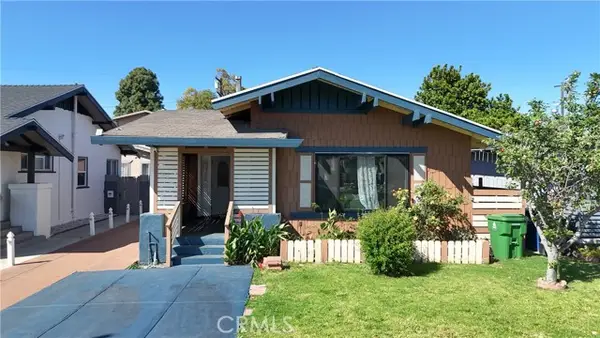 $799,000Active3 beds 2 baths1,470 sq. ft.
1453 W 56th, Los Angeles, CA 90062
MLS# CRCV26063670Listed by: NEXT BROKERAGE - Open Sat, 11am to 4pm
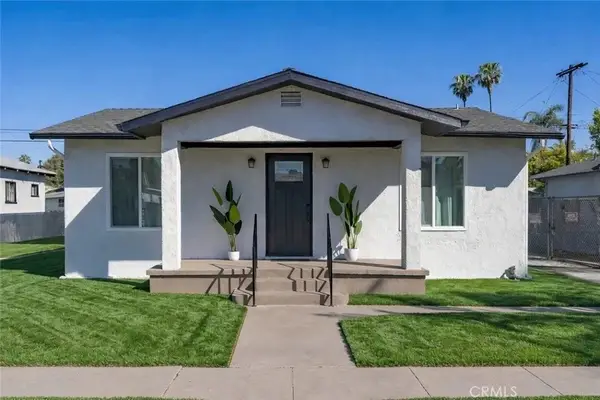 $765,000Active3 beds 2 baths1,338 sq. ft.
1615 W 67th, Los Angeles, CA 90047
MLS# DW26059845Listed by: ANVIL REAL ESTATE 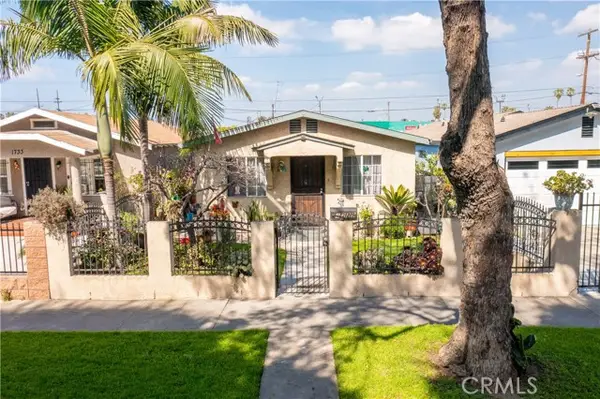 $630,000Pending2 beds 1 baths672 sq. ft.
1729 W 59th Place, Los Angeles, CA 90047
MLS# CRSR26053848Listed by: LUXURY COLLECTIVE $950,000Active3 beds 2 baths1,682 sq. ft.
1506 W 54th Street, Los Angeles, CA 90062
MLS# 26660741Listed by: SHERIE HOWARD & ASSOCIATES, INC $829,000Active3 beds -- baths1,588 sq. ft.
1445 W 58th, Los Angeles, CA 90062
MLS# CRIN26042624Listed by: REALTY BROKERAGE GROUP INC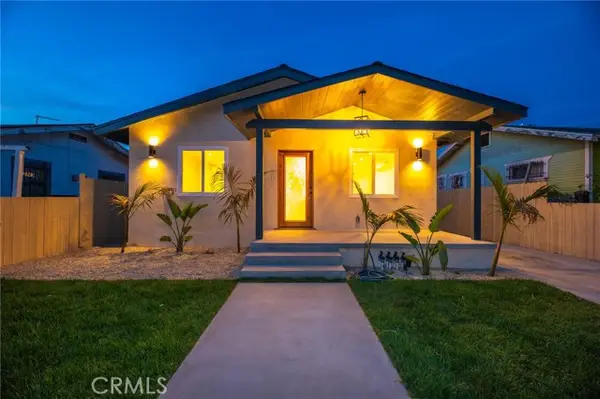 $750,000Active3 beds 1 baths1,048 sq. ft.
1535 W 70th, Los Angeles, CA 90047
MLS# CRDW26041941Listed by: NUEVA REAL ESTATE $780,000Active5 beds -- baths2,234 sq. ft.
6214 S Western Avenue, Los Angeles, CA 90047
MLS# CRDW26035417Listed by: KELLER WILLIAMS SELA $789,999Active2 beds 1 baths996 sq. ft.
1550 W 70th St, Los Angeles, CA 90047
MLS# IN25268975Listed by: D.S & CO REALTY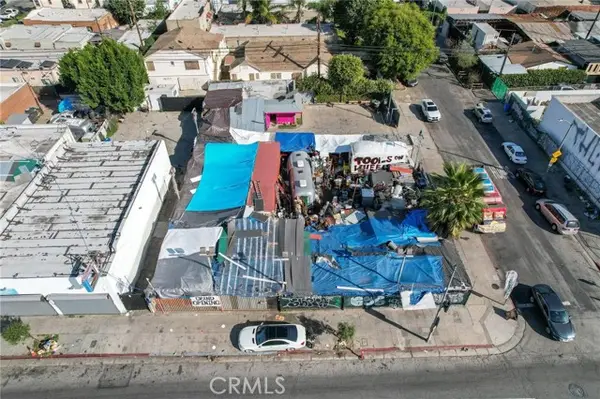 $1,600,000Active-- beds -- baths
5718 S Western Avenue, Los Angeles, CA 90062
MLS# CRSR26030835Listed by: LUXURY COLLECTIVE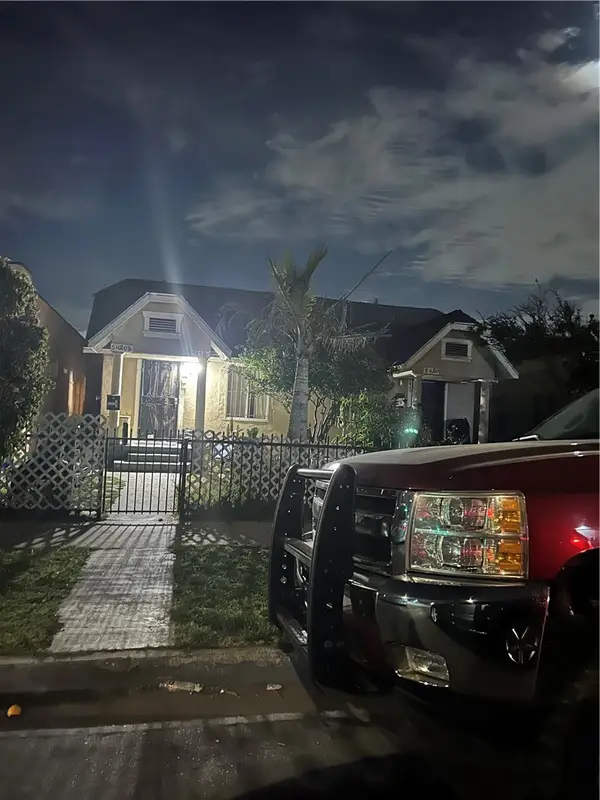 $850,000Active4 beds -- baths2,079 sq. ft.
5418 Denker, Los Angeles, CA 90062
MLS# CRDW26033068Listed by: TIERRA BELLA REALTY R-M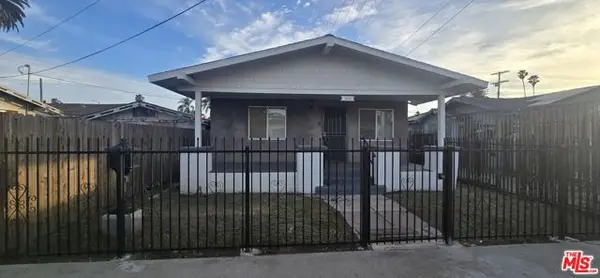 $584,900Active2 beds 2 baths864 sq. ft.
1612 W 55th Street, Los Angeles, CA 90062
MLS# CL26651235Listed by: DOMUS REALTY PARTNERS INC.
 $680,000Active3 beds 2 baths1,348 sq. ft.
1627 W 65th Street, Los Angeles, CA 90047
MLS# DW26029956Listed by: CENTURY 21 MASTERS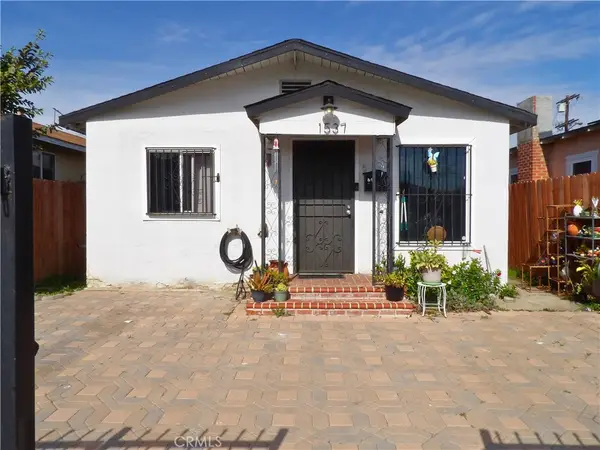 $640,000Active2 beds 2 baths924 sq. ft.
1537 W 60th, Los Angeles, CA 90047
MLS# TR26017652Listed by: CENTURY 21 MASTERS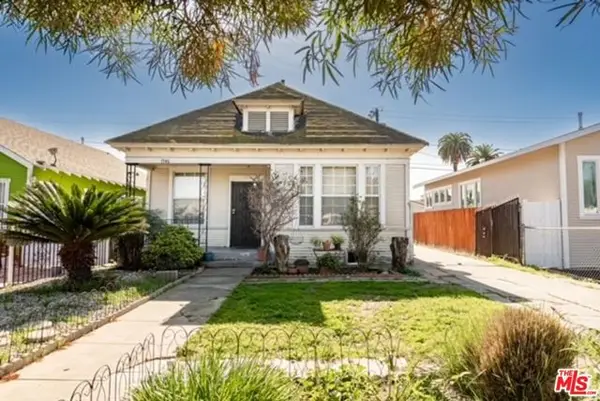 $599,000Pending2 beds 1 baths1,053 sq. ft.
1546 W 70th Street, Los Angeles, CA 90047
MLS# CL26646155Listed by: AGENTS OF LA INC.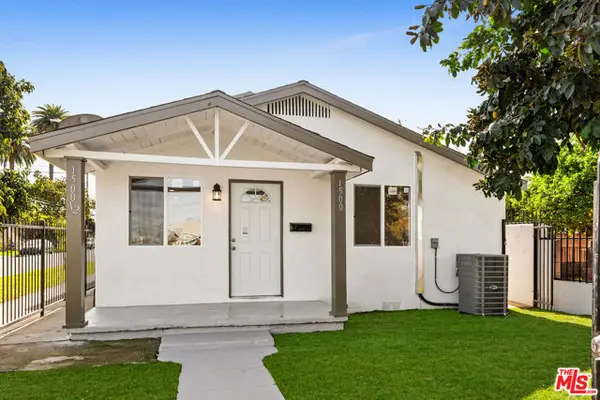 $929,000Active5 beds -- baths1,904 sq. ft.
1500 W 58th Place, Los Angeles, CA 90047
MLS# CL26645765Listed by: MATT ROTH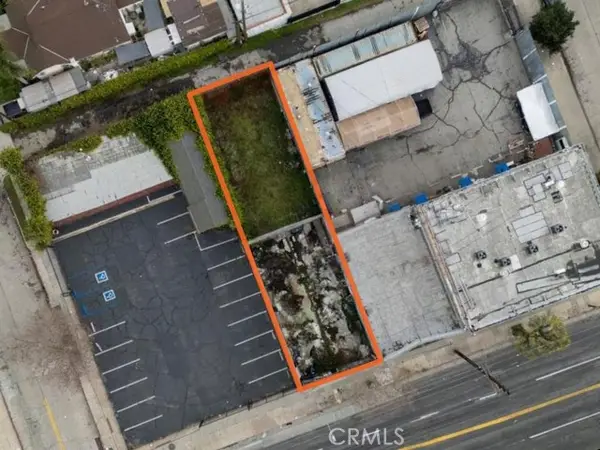 $415,000Active0.09 Acres
6710 S Western, Los Angeles, CA 90047
MLS# CROC26020677Listed by: SEVEN GABLES REAL ESTATE $725,000Active2 beds 3 baths1,153 sq. ft.
1555 W 71st Street, Los Angeles, CA 90047
MLS# 26643353Listed by: KELLER WILLIAMS LARCHMONT $599,000Active2 beds 2 baths735 sq. ft.
1619 W 68th, Los Angeles, CA 90047
MLS# PW26018158Listed by: KHORR REALTY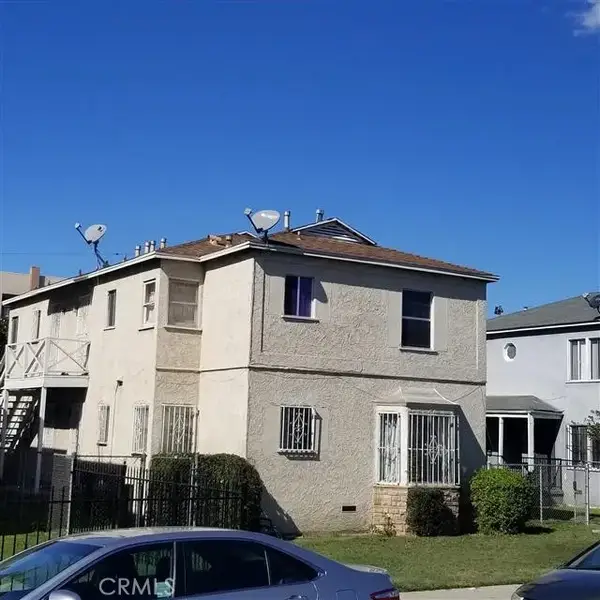 $799,500Active4 beds 4 baths
6143 S Hobart Boulevard, Los Angeles, CA 90047
MLS# DW26015600Listed by: NEW VENTURE REALTY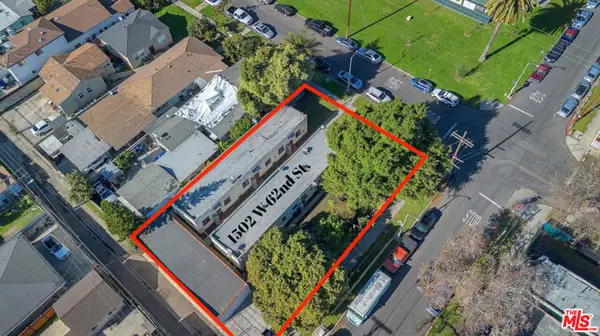 $829,000Active6 beds 6 baths2,652 sq. ft.
1502 W 62nd Street, Los Angeles, CA 90047
MLS# 26639731Listed by: COMPASS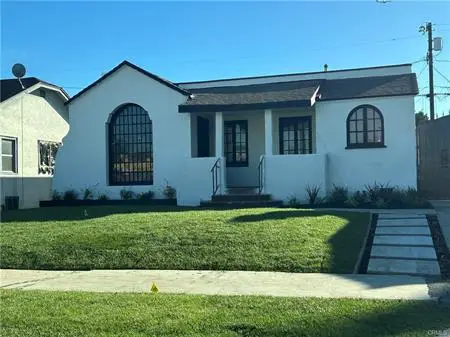 $799,000Pending3 beds 2 baths1,455 sq. ft.
1636 W 70th, Los Angeles, CA 90047
MLS# SB26010722Listed by: CENTURY 21 COASTAL PROPERTIES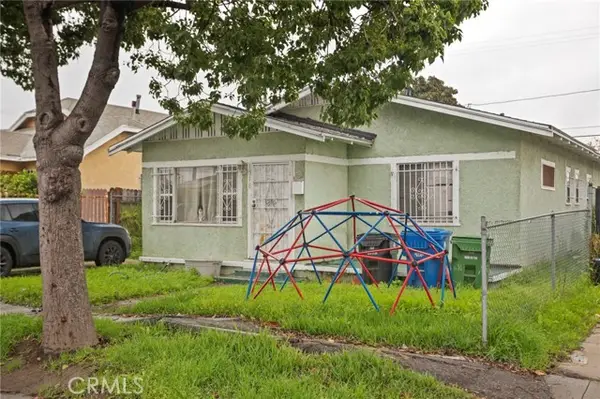 $660,000Pending4 beds 2 baths1,286 sq. ft.
1518 W 65th Place, Los Angeles, CA 90047
MLS# CRSB26001491Listed by: HOME SMART REALTY GROUP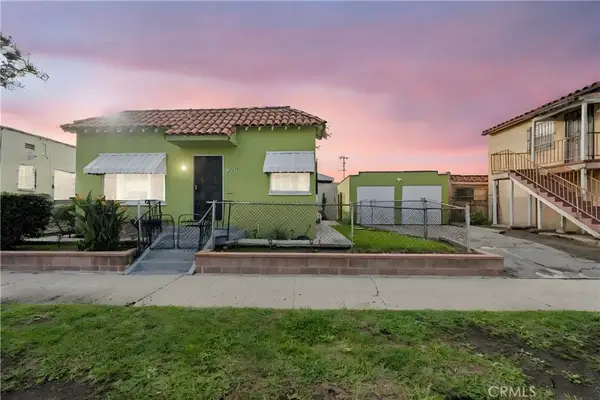 $699,900Active3 beds 2 baths1,826 sq. ft.
7015 S Harvard, Los Angeles, CA 90047
MLS# IV25280821Listed by: RE/MAX TIME REALTY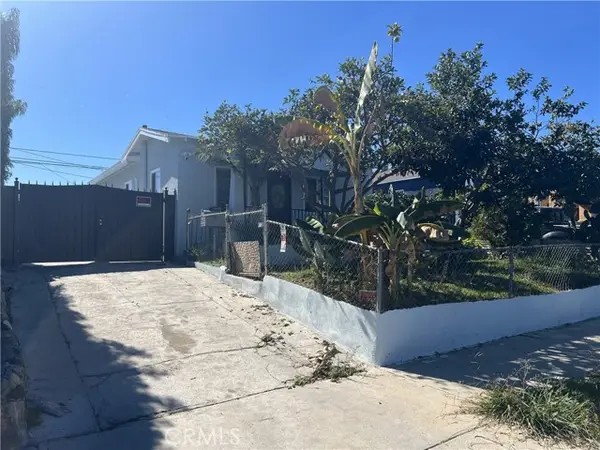 $728,000Active3 beds 2 baths1,181 sq. ft.
1612 W 71st, Los Angeles, CA 90047
MLS# CRTR25279384Listed by: REALTY MASTERS & ASSOCIATES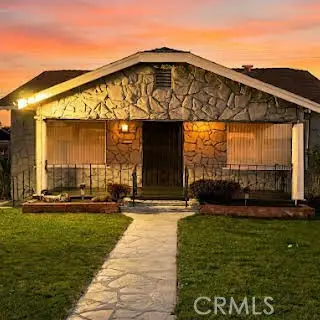 $630,000Active3 beds 1 baths1,040 sq. ft.
1706 W 65th Place, Los Angeles, CA 90047
MLS# CRDW25266822Listed by: RE/MAX DYNASTY $789,999Active2 beds 1 baths996 sq. ft.
1550 W 70th St, Los Angeles, CA 90047
MLS# IN25268975Listed by: D.S & CO REALTY $565,000Active4 beds 2 baths
1500 W 59th, Los Angeles, CA 90047
MLS# DW25257362Listed by: EXECUTIVE BANKERS REALTY $949,900Active4 beds 3 baths2,149 sq. ft.
6217 S Halldale Avenue, Los Angeles, CA 90047
MLS# 25610869Listed by: ARCHITECTURAL ESTATES $635,000Active2 beds 1 baths896 sq. ft.
1513 W 60th Street, Los Angeles, CA 90047
MLS# CRSR25279874Listed by: LUXURY COLLECTIVE $850,000Active5 beds -- baths1,992 sq. ft.
1601 W 69th Street, Los Angeles, CA 90047
MLS# CL25609221Listed by: WALL STREET REALTY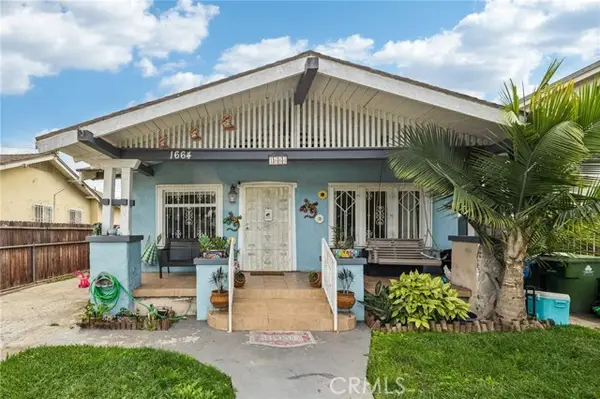 $625,000Pending3 beds 2 baths1,098 sq. ft.
1664 W 55th Street, Los Angeles, CA 90062
MLS# CRIV25239844Listed by: KELLER WILLIAMS RIVERSIDE CENT $699,000Pending2 beds -- baths1,504 sq. ft.
1743 W 60th Place, Los Angeles, CA 90047
MLS# CRDW25192702Listed by: CENTURY 21 JERVIS & ASSOCIATES $457,400Pending3 beds 1 baths1,497 sq. ft.
1514 W 55th Street, Los Angeles, CA 90062
MLS# CRIV25188221Listed by: REALHOME SERVICES & SOLUTIONS $800,000Pending5 beds -- baths2,306 sq. ft.
1625 W 55th Street, Los Angeles, CA 90062
MLS# CL25579611Listed by: RODEO REALTY- BRENTWOOD $2,000,000Active0.48 Acres
6617 S Normandie Avenue, Los Angeles, CA 90044
MLS# CRSR25102197Listed by: VINCO VINCO REALTY & INVESTMENTS INC $989,000Active4 beds -- baths1,600 sq. ft.
1407 W 59th Place, Los Angeles, CA 90047
MLS# CRDW25101117Listed by: REALTY ONE GROUP UNITED $989,000Active4 beds 4 baths1,600 sq. ft.
1407 W 59th Place W, Los Angeles, CA 90047
MLS# DW25101117Listed by: REALTY ONE GROUP UNITED $690,000Active3 beds 3 baths1,300 sq. ft.
1414 W 54th Street, Los Angeles, CA 90062
MLS# CL26634921Listed by: SARAVITA PROPERTIES INC $580,000Pending2 beds 1 baths1,324 sq. ft.
1632 W 60th Place, Los Angeles, CA 90047
MLS# IN23040159Listed by: JACKSON PROPERTY ADVISORS
Local realty services provided by:CENTURY 21 Wildwood Properties, Inc., CENTURY 21 Affiliated, CENTURY 21 Jordan-Link
This information is deemed reliable but not guaranteed. You should rely on this information only to decide whether or not to further investigate a particular property. BEFORE MAKING ANY OTHER DECISION, YOU SHOULD PERSONALLY INVESTIGATE THE FACTS (e.g. square footage and lot size) with the assistance of an appropriate professional. You may use this information only to identify properties you may be interested in investigating further. All uses except for personal, non-commercial use in accordance with the foregoing purpose are prohibited. Redistribution or copying of this information, any photographs or video tours is strictly prohibited. This information is derived from the Internet Data Exchange (IDX) service provided by San Diego MLS®. Displayed property listings may be held by a brokerage firm other than the broker and/or agent responsible for this display. The information and any photographs and video tours and the compilation from which they are derived is protected by copyright. Compilation © 2020 San Diego MLS®, Inc.
The information being provided by California Regional MLS (Southern California) is for the consumer's personal, non-commercial use and may not be used for any purpose other than to identify prospective properties consumer may be interested in purchasing. Any information relating to real estate for sale referenced on this web site comes from the Internet Data Exchange (IDX) program of the California Regional MLS (Southern California). CENTURY 21 Jordan-Link is not a Multiple Listing Service (MLS), nor does it offer MLS access. This website is a service of CENTURY 21 Jordan-Link, a broker participant of California Regional MLS (Southern California). This web site may reference real estate listing(s) held by a brokerage firm other than the broker and/or agent who owns this web site.
The accuracy of all information, regardless of source, including but not limited to open house information, square footages and lot sizes, is deemed reliable but not guaranteed and should be personally verified through personal inspection by and/or with the appropriate professionals. The data contained herein is copyrighted by California Regional MLS (Southern California) and is protected by all applicable copyright laws. Any unauthorized dissemination of this information is in violation of copyright laws and is strictly prohibited.
Copyright 2021 California Regional MLS (Southern California). All rights reserved.
Popular neighborhoods near Harvard Park, Los Angeles, CA
Zip codes near Harvard Park, Los Angeles, CA
- 90001 homes for sale
- 90002 homes for sale
- 90003 homes for sale
- 90007 homes for sale
- 90008 homes for sale
- 90011 homes for sale
- 90015 homes for sale
- 90016 homes for sale
- 90018 homes for sale
- 90037 homes for sale
- 90043 homes for sale
- 90044 homes for sale
- 90047 homes for sale
- 90056 homes for sale
- 90062 homes for sale
- 90301 homes for sale
- 90302 homes for sale
- 90303 homes for sale
- 90304 homes for sale
- 90305 homes for sale
Counties near Harvard Park, Los Angeles, CA
Protect your home and budget from life's surprises with an Assurant Home Warranty, backed by a partner that supports you through every step of homeownership. Explore Plans.
©2026 Century 21 Real Estate LLC. All rights reserved. CENTURY 21®, the CENTURY 21 Logo and C21® are service marks owned by Century 21 Real Estate LLC. Century 21 Real Estate LLC fully supports the principles of the Fair Housing Act and the Equal Opportunity Act. Each office is independently owned and operated. Listing information is deemed reliable but not guaranteed accurate.