- Athens, Los Angeles homes for sale
- Broadway - Manchester, Los Angeles homes for sale
- Gramercy Park, Los Angeles homes for sale
- Harbor Gateway, Gardena homes for sale
- Hermosa Beach East, Hermosa Beach homes for sale
- Hermosa Beach Sand, Hermosa Beach homes for sale
- Hermosa Beach Valley, Hermosa Beach homes for sale
- Manchester Square, Los Angeles homes for sale
- Manhattan Beach Mira Costa, Manhattan Beach homes for sale
- Manhattan Beach Sand, Manhattan Beach homes for sale
- Manhattan Beach Tree, Manhattan Beach homes for sale
- North Redondo Beach, Redondo Beach homes for sale
- North Torrance - East, Torrance homes for sale
- North Torrance - West, Torrance homes for sale
- South Bay, Torrance homes for sale
- Vermont Vista, Los Angeles homes for sale
- West Torrance, Torrance homes for sale
- Westchester, Los Angeles homes for sale
- Westmont, Los Angeles homes for sale
- Willowbrook, Los Angeles homes for sale
Hawthorne, CA - homes for sale
25 of 25 results displayed
- New
 $8,100,000Active30 beds 28 baths18,310 sq. ft.
14110 Yukon Avenue, Hawthorne, CA 90250
MLS# 26669667Listed by: GLOBAL PLATINUM PROPERTIES, INC. - New
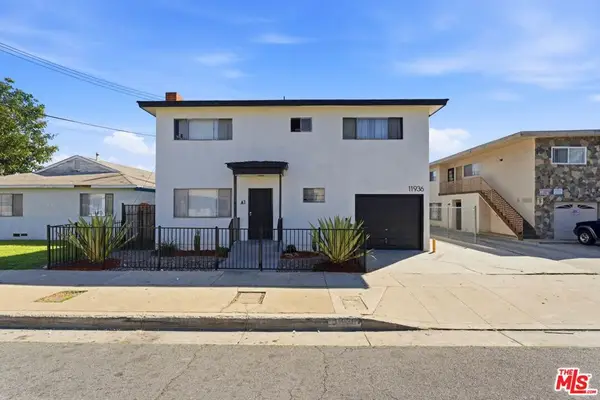 $2,125,000Active12 beds 9 baths5,971 sq. ft.
11936 Grevillea Avenue, Hawthorne, CA 90250
MLS# 26669525Listed by: SHIELD CRE, INC. 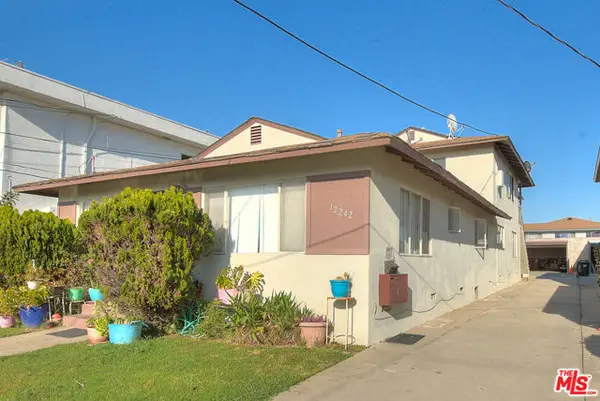 $1,250,000Active5 beds -- baths2,940 sq. ft.
12242 Manor Drive, Hawthorne, CA 90250
MLS# CL26665583Listed by: JOHN L. SCOTT REAL ESTATE $1,350,000Active8 beds -- baths3,780 sq. ft.
12240 Birch Avenue, Hawthorne, CA 90250
MLS# CL26665943Listed by: REALTY EXCEL $1,699,000Active-- beds -- baths4,800 sq. ft.
3702 W 126th, Hawthorne, CA 90250
MLS# PV26054107Listed by: SHOREVIEW PARTNERS REAL ESTATE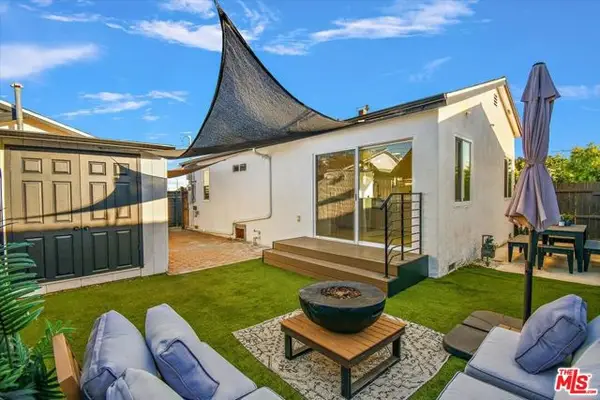 $1,049,000Active4 beds -- baths1,539 sq. ft.
13315 Eriel Avenue, Hawthorne, CA 90250
MLS# CL26659347Listed by: WATKINS REAL ESTATE GROUP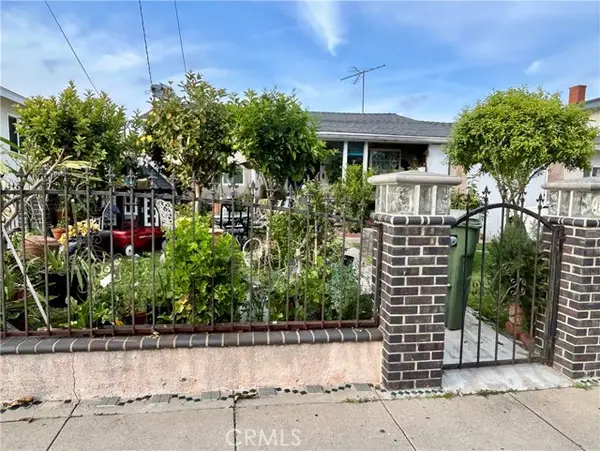 $1,099,000Active5 beds -- baths2,044 sq. ft.
4553 W 138th, Hawthorne, CA 90250
MLS# CRSB26044720Listed by: BERKSHIRE HATHAWAY HOMESERVICES CALIFORNIA PROPERTIES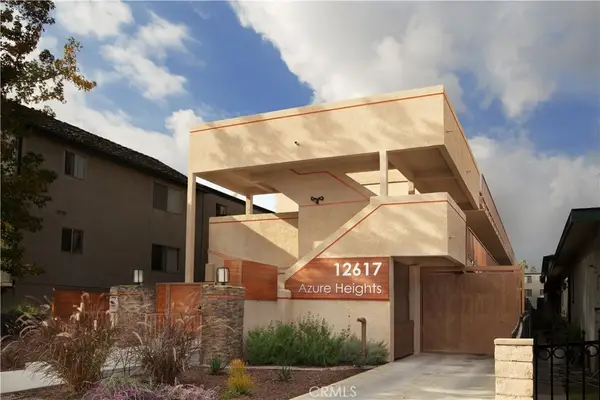 $3,700,000Active-- beds -- baths10,366 sq. ft.
12617 Eucalyptus Avenue, Hawthorne, CA 90250
MLS# SB26042957Listed by: ADW MANAGEMENT USA, INC.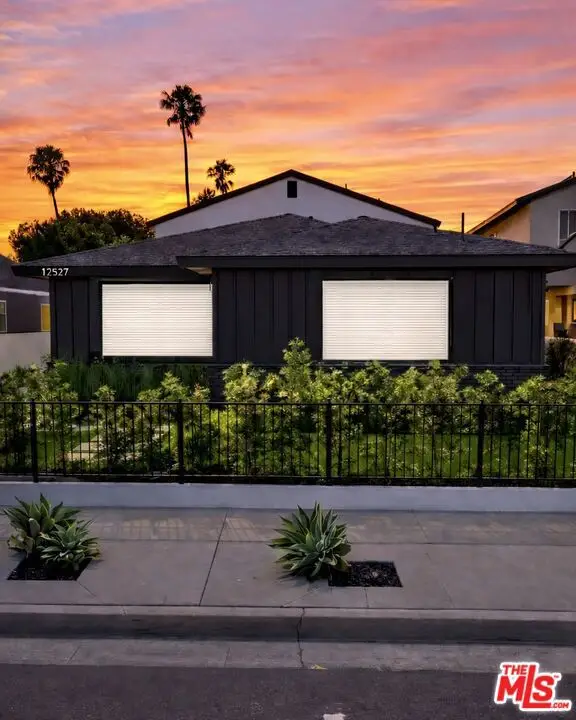 $2,295,000Active11 beds 8 baths5,030 sq. ft.
12527 Cranbrook Avenue, Hawthorne, CA 90250
MLS# 26658939Listed by: LYON STAHL INVESTMENT REAL ESTATE, INC. $1,850,000Active-- beds -- baths7,292 sq. ft.
4376 W 134th, Hawthorne, CA 90250
MLS# SB26032642Listed by: ROHERA CAPITAL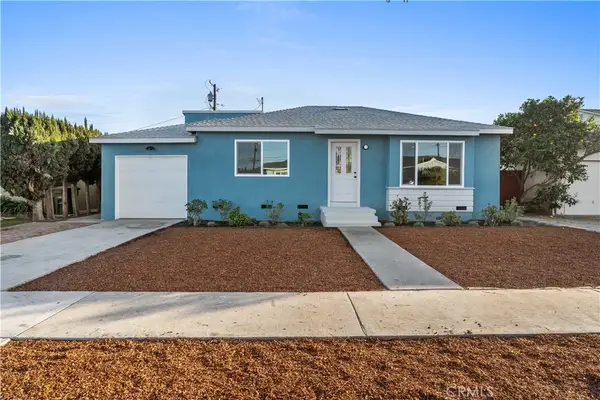 $1,450,000Pending-- beds -- baths1,755 sq. ft.
5324 W 121st, Hawthorne, CA 90250
MLS# SB26036127Listed by: BEACH CITY BROKERS $1,939,000Active13 beds 11 baths
13525 Kornblum Avenue, Hawthorne, CA 90250
MLS# SB26017333Listed by: HOME SMART REALTY GROUP $1,229,000Active7 beds -- baths3,221 sq. ft.
12526 Menlo Ave, Hawthorne, CA 90250
MLS# CRIN26010743Listed by: THE REAL ESTATE CONSULTANTS WESTSIDE INC. $5,295,000Active5 beds 5 baths
4055 W 129th St, Hawthorne, CA 90250
MLS# SB25272005Listed by: LYON STAHL INVESTMENT REAL ESTATE, INC. $1,600,000Active-- beds -- baths5,606 sq. ft.
4701 W El Segundo, Hawthorne, CA 90250
MLS# SB25274124Listed by: GUY HOCKER REALTORS $1,199,000Active3 beds -- baths1,128 sq. ft.
5027 W 135th, Hawthorne, CA 90250
MLS# CRSB25269269Listed by: BEACH CITY BROKERS $1,399,000Active5 beds 4 baths
11992 Oxford, Hawthorne, CA 90250
MLS# CV25265703Listed by: KW VISION- Open Thu, 1 to 4pm
 $860,000Active-- beds -- baths1,456 sq. ft.
5010 W El Segundo Boulevard, Hawthorne, CA 90250
MLS# PW25261951Listed by: KELLER WILLIAMS COASTAL PROP.  $1,495,000Pending8 beds 3 baths
11835 Gale Ave, Hawthorne, CA 90250
MLS# SB25214586Listed by: BUCKINGHAM INVESTMENTS, INC $1,099,000Active5 beds -- baths3,280 sq. ft.
12940 Prairie Ave, Hawthorne, CA 90250
MLS# CRSB25176869Listed by: REMAX AEGIS $1,099,000Active-- beds -- baths3,280 sq. ft.
12940 Prairie Ave, Hawthorne, CA 90250
MLS# SB25176869Listed by: REMAX AEGIS $1,190,000Active-- beds -- baths2,468 sq. ft.
5126 W El Segundo Boulevard, Hawthorne, CA 90250
MLS# DW25178745Listed by: COLDWELL BANKER REALTY $1,750,000Active4 beds 3 baths
12612 Kornblum Avenue, Hawthorne, CA 90250
MLS# OC25170666Listed by: MIKE MARCU, BROKER $2,400,000Pending11 beds 7 baths
4543 W 132nd Street, Hawthorne, CA 90250
MLS# SB24106338Listed by: JKB REALTY ADVISORS $1,350,000Pending6 beds 4 baths
4145 W 136th Street, Hawthorne, CA 90250
MLS# SB22122912Listed by: BONANZA REALTY
Local realty services provided by:CENTURY 21 Cornerstone, CENTURY 21 Sierra Properties, CENTURY 21 Affiliated
The information being provided by California Regional MLS (Southern California) is for the consumer's personal, non-commercial use and may not be used for any purpose other than to identify prospective properties consumer may be interested in purchasing. Any information relating to real estate for sale referenced on this web site comes from the Internet Data Exchange (IDX) program of the California Regional MLS (Southern California). CENTURY 21 Cornerstone is not a Multiple Listing Service (MLS), nor does it offer MLS access. This website is a service of CENTURY 21 Cornerstone, a broker participant of California Regional MLS (Southern California). This web site may reference real estate listing(s) held by a brokerage firm other than the broker and/or agent who owns this web site.
The accuracy of all information, regardless of source, including but not limited to open house information, square footages and lot sizes, is deemed reliable but not guaranteed and should be personally verified through personal inspection by and/or with the appropriate professionals. The data contained herein is copyrighted by California Regional MLS (Southern California) and is protected by all applicable copyright laws. Any unauthorized dissemination of this information is in violation of copyright laws and is strictly prohibited.
Copyright 2021 California Regional MLS (Southern California). All rights reserved.
This information is deemed reliable but not guaranteed. You should rely on this information only to decide whether or not to further investigate a particular property. BEFORE MAKING ANY OTHER DECISION, YOU SHOULD PERSONALLY INVESTIGATE THE FACTS (e.g. square footage and lot size) with the assistance of an appropriate professional. You may use this information only to identify properties you may be interested in investigating further. All uses except for personal, non-commercial use in accordance with the foregoing purpose are prohibited. Redistribution or copying of this information, any photographs or video tours is strictly prohibited. This information is derived from the Internet Data Exchange (IDX) service provided by San Diego MLS®. Displayed property listings may be held by a brokerage firm other than the broker and/or agent responsible for this display. The information and any photographs and video tours and the compilation from which they are derived is protected by copyright. Compilation © 2020 San Diego MLS®, Inc.
Neighborhoods near Hawthorne, CA
Zip codes near Hawthorne, CA
- 90043 homes for sale
- 90044 homes for sale
- 90045 homes for sale
- 90047 homes for sale
- 90061 homes for sale
- 90245 homes for sale
- 90247 homes for sale
- 90248 homes for sale
- 90249 homes for sale
- 90250 homes for sale
- 90254 homes for sale
- 90260 homes for sale
- 90266 homes for sale
- 90278 homes for sale
- 90301 homes for sale
- 90302 homes for sale
- 90303 homes for sale
- 90304 homes for sale
- 90305 homes for sale
- 90504 homes for sale
Popular searches near Hawthorne, CA
- Alondra Park homes for sale
- Del Aire homes for sale
- El Segundo homes for sale
- Gardena homes for sale
- Hermosa Beach homes for sale
- Inglewood homes for sale
- Ladera Heights homes for sale
- Lawndale homes for sale
- Lennox homes for sale
- Manhattan Beach homes for sale
- Playa Del Rey homes for sale
- Playa Vista homes for sale
- Redondo Beach homes for sale
- South Bay Cities homes for sale
- Torrance homes for sale
- View Park-Windsor Hills homes for sale
- West Athens homes for sale
- West Rancho Dominguez homes for sale
- Westchester homes for sale
- Westmont homes for sale
Protect your home and budget from life's surprises with an Assurant Home Warranty, backed by a partner that supports you through every step of homeownership. Explore Plans.
©2026 Century 21 Real Estate LLC. All rights reserved. CENTURY 21®, the CENTURY 21 Logo and C21® are service marks owned by Century 21 Real Estate LLC. Century 21 Real Estate LLC fully supports the principles of the Fair Housing Act and the Equal Opportunity Act. Each office is independently owned and operated. Listing information is deemed reliable but not guaranteed accurate.