- Cottontown homes for sale
- Cross Plains homes for sale
- Gallatin homes for sale
- Goodlettsville homes for sale
- Goodlettsville homes for sale
- Green Hill homes for sale
- Greenbrier homes for sale
- Hendersonville homes for sale
- Hermitage homes for sale
- Madison homes for sale
- Millersville homes for sale
- Mt. Juliet homes for sale
- Nashville-Davidson homes for sale
- New Deal homes for sale
- Old Hickory homes for sale
- Ridgetop homes for sale
- Shackle Island homes for sale
- Walnut Grove homes for sale
- White House homes for sale
- Whites Creek homes for sale
37075, TN - homes for sale
8 of 8 results displayed
- New
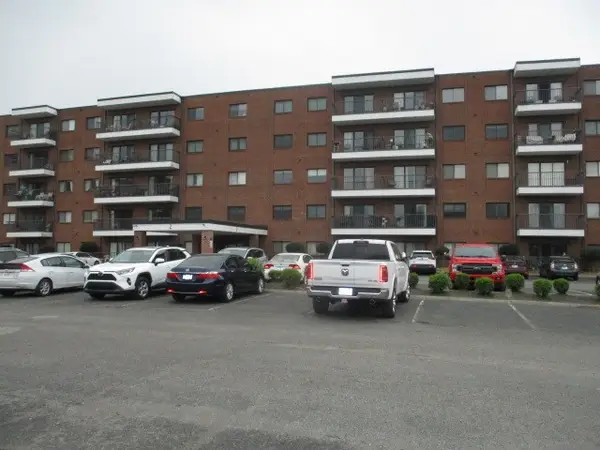 $300,000Active3 beds 2 baths1,462 sq. ft.
200 Sanders Ferry Rd #2301, Hendersonville, TN 37075
MLS# 3164038Listed by: GENE CARMAN R. E. & AUCTION 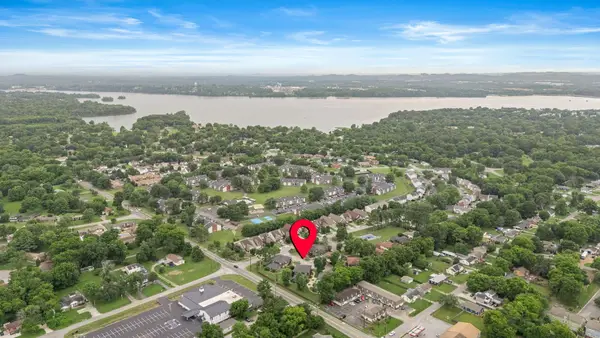 $212,900Active2 beds 1 baths924 sq. ft.
250 Donna Dr #4D, Hendersonville, TN 37075
MLS# 3149751Listed by: RELIANT REALTY ERA POWERED $248,000Active2 beds 2 baths1,020 sq. ft.
222 Edgewood Dr, Hendersonville, TN 37075
MLS# 3148653Listed by: HOMECOIN.COM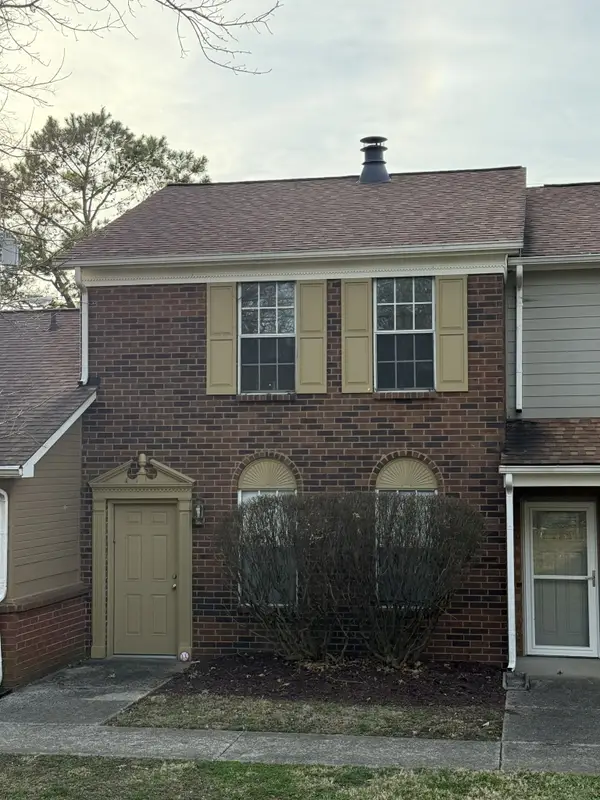 $245,000Active2 beds 3 baths1,152 sq. ft.
430 Walton Ferry Rd #1601, Hendersonville, TN 37075
MLS# 3143173Listed by: EXP REALTY $449,900Active2 beds 2 baths2,031 sq. ft.
141 Saundersville Rd #1402, Hendersonville, TN 37075
MLS# 3135395Listed by: RELIANT REALTY ERA POWERED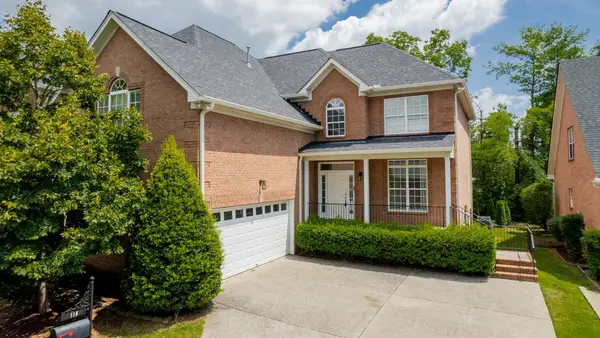 $449,000Pending3 beds 3 baths2,383 sq. ft.
119 Belmont Cir, Hendersonville, TN 37075
MLS# 3133713Listed by: BENCHMARK REALTY, LLC $235,000Active2 beds 2 baths1,064 sq. ft.
430 Walton Ferry Rd #807, Hendersonville, TN 37075
MLS# 3097773Listed by: RON POINDEXTER REAL ESTATE $289,000Active3 beds 2 baths1,462 sq. ft.
200 Sanders Ferry Rd #2202, Hendersonville, TN 37075
MLS# 2591881Listed by: NETWORK PROPERTIES, LLC
Local realty services provided by:CENTURY 21 Premier
Popular searches near 37075
Popular neighborhoods near 37075
- Brick Church Bellshire, Whites Creek homes for sale
- Cleveland Park, Nashville homes for sale
- Cloverhill, Nashville homes for sale
- Connell, Goodlettsville homes for sale
- Donelson, Hermitage homes for sale
- East Nashville, Nashville homes for sale
- Eastwood, Nashville homes for sale
- Fairvue Plantation, Gallatin homes for sale
- Historic Old Hickory Village, Old Hickory homes for sale
- Inglewood, Nashville homes for sale
- Lakewood, Old Hickory homes for sale
- Lockeland Springs, Nashville homes for sale
- Madison, Madison homes for sale
- Neely's Bend, Madison homes for sale
- Parkwood, Goodlettsville homes for sale
- Providence, Mount Juliet homes for sale
- Rosebank, Nashville homes for sale
- South Inglewood, Nashville homes for sale
- Sunset View, Nashville homes for sale
- Trinity RV Park, Nashville homes for sale
Counties near Hendersonville, 37075
- Allen County homes for sale
- Cannon County homes for sale
- Cheatham County homes for sale
- Davidson County homes for sale
- DeKalb County homes for sale
- Dickson County homes for sale
- Jackson County homes for sale
- Logan County homes for sale
- Macon County homes for sale
- Montgomery County homes for sale
- Robertson County homes for sale
- Rutherford County homes for sale
- Simpson County homes for sale
- Smith County homes for sale
- Sumner County homes for sale
- Todd County homes for sale
- Trousdale County homes for sale
- Warren County homes for sale
- Williamson County homes for sale
- Wilson County homes for sale
Protect your home and budget from life's surprises with an Assurant Home Warranty, backed by a partner that supports you through every step of homeownership. Explore Plans.
©2026 Century 21 Real Estate LLC. All rights reserved. CENTURY 21®, the CENTURY 21 Logo and C21® are service marks owned by Century 21 Real Estate LLC. Century 21 Real Estate LLC fully supports the principles of the Fair Housing Act and the Equal Opportunity Act. Each office is independently owned and operated. Listing information is deemed reliable but not guaranteed accurate.