- Arnold, Arnold homes for sale
- Barnhart, Barnhart homes for sale
- Carondelet, Saint Louis homes for sale
- Claremont, East Saint Louis homes for sale
- Crystal City, Crystal City homes for sale
- Downtown St. Louis, Saint Louis homes for sale
- Fountain Place, Fairview Heights homes for sale
- Imperial, Imperial homes for sale
- Iroquois Gardens, Evansville homes for sale
- Lasalle Park, Saint Louis homes for sale
- Lemay, Saint Louis homes for sale
- Marine Villa, Saint Louis homes for sale
- Mehlville, Saint Louis homes for sale
- Mount Pleasant, Saint Louis homes for sale
- Oakville, Saint Louis homes for sale
- Patch, Saint Louis homes for sale
- Reunion, Belleville homes for sale
- Soulard, Saint Louis homes for sale
- Tanglewood, Caseyville homes for sale
- The Orchards, Belleville homes for sale
Herrin, IL - homes for sale
7 of 7 results displayed
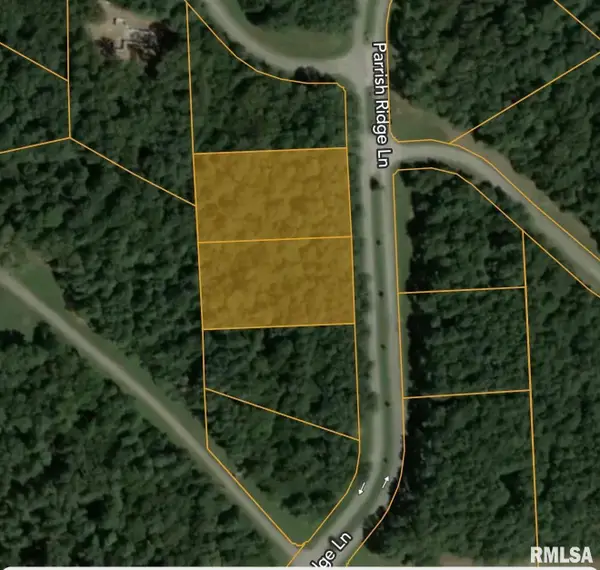 $39,500Active2.02 Acres
TBD Parrish Ridge Lane, Goreville, IL 62948-9999
MLS# PA1264839Listed by: SOUTHERN ILLINOIS REALTY EXPERTS - HERRIN $27,500Active0 Acres
Lot 19 Corbin Drive, Energy, IL 62933
MLS# PA1264556Listed by: HOUSE 2 HOME REALTY $11,000Active0 Acres
500 S 28th Street, Herrin, IL 62948
MLS# 12568600Listed by: PAUL WILSON REALTY
 $38,000Active3.24 Acres
1112 S 9th Street, Herrin, IL 62948
MLS# PA1264121Listed by: RIVER 2 RIVER REALTY $182,328Active17.12 Acres
0000 N Park Avenue, Herrin, IL 62948
MLS# EB460311Listed by: BUY A FARM LAND & AUCTION CO.
 $495,000Active4.32 Acres
10311 Fleming Road, Carterville, IL 62918
MLS# EB439050Listed by: C21 HOUSE OF REALTY, INC. $10,000Active0 Acres
000 N 19th Street, Herrin, IL 62948
MLS# PA1263567Listed by: HOUSE 2 HOME REALTY
Local realty services provided by:CENTURY 21 Broughton Team, CENTURY 21 Circle
Copyright 2026 Midwest Real Estate Data LLC. All rights reserved. The data relating to real estate for sale on this web site comes in part from the Broker Reciprocity Program of the Midwest Real Estate Data LLC. Listing information is deemed reliable but not guaranteed.
Neighborhoods near Herrin, IL
Zip codes near Herrin, IL
- 62812 homes for sale
- 62822 homes for sale
- 62865 homes for sale
- 62896 homes for sale
- 62901 homes for sale
- 62902 homes for sale
- 62915 homes for sale
- 62918 homes for sale
- 62922 homes for sale
- 62924 homes for sale
- 62932 homes for sale
- 62933 homes for sale
- 62948 homes for sale
- 62949 homes for sale
- 62951 homes for sale
- 62958 homes for sale
- 62959 homes for sale
- 62966 homes for sale
- 62974 homes for sale
- 62983 homes for sale
Popular searches near Herrin, IL
- Blairsville Precinct homes for sale
- Cambria homes for sale
- Carbondale homes for sale
- Carterville homes for sale
- Carterville Precinct homes for sale
- Crainville homes for sale
- De Soto Township homes for sale
- Denning homes for sale
- East Marion homes for sale
- Energy homes for sale
- Herrin Precinct homes for sale
- Hurst homes for sale
- Johnston City homes for sale
- Lake Creek homes for sale
- Marion homes for sale
- Pittsburg homes for sale
- Royalton homes for sale
- Six Mile homes for sale
- West Frankfort homes for sale
- West Marion homes for sale
Protect your home and budget from life's surprises with an Assurant Home Warranty, backed by a partner that supports you through every step of homeownership. Explore Plans.
©2026 Century 21 Real Estate LLC. All rights reserved. CENTURY 21®, the CENTURY 21 Logo and C21® are service marks owned by Century 21 Real Estate LLC. Century 21 Real Estate LLC fully supports the principles of the Fair Housing Act and the Equal Opportunity Act. Each office is independently owned and operated. Listing information is deemed reliable but not guaranteed accurate.