- Baker Ranch, Lake Forest homes for sale
- Canyon Estates, Mission Viejo homes for sale
- Casta del Sol, Mission Viejo homes for sale
- Foothill Ranch, Foothill Ranch homes for sale
- Los Ranchos Estates at Coto de Caza, Trabuco Canyon homes for sale
- Modjeska, Silverado homes for sale
- Painted Trails, Mission Viejo homes for sale
- Palm Gardens, Mission Viejo homes for sale
- Palmia, Mission Viejo homes for sale
- Portola Hills, Trabuco Canyon homes for sale
- Rancho Cielo, Trabuco Canyon homes for sale
- Rancho de los Alisos, Lake Forest homes for sale
- Rancho Santa Margarita SAMLARC, Rancho Santa Margarita homes for sale
- Rancho Trabuco, Rancho Santa Margarita homes for sale
- Robinson Ranch, Trabuco Canyon homes for sale
- Serrano Highlands, Lake Forest homes for sale
- Stoneridge, Mission Viejo homes for sale
- The Meadows, Lake Forest homes for sale
- Trabuco Canyon, Trabuco Canyon homes for sale
- Trabuco Highlands, Trabuco Canyon homes for sale
Hidden Ridge, Trabuco Canyon, CA - homes for sale
8 of 8 results displayed
- New
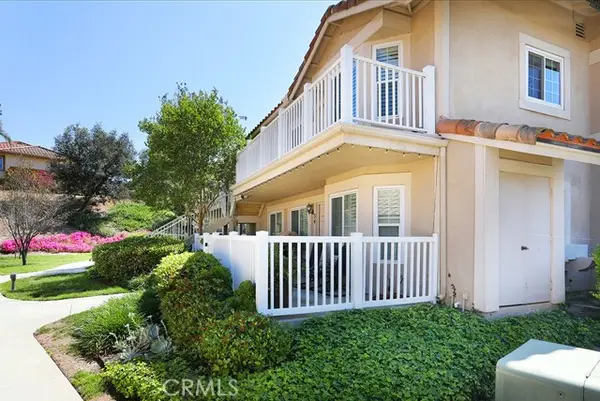 $574,999Active2 beds 2 baths816 sq. ft.
19801 Meadow Ridge #38, Trabuco Canyon, CA 92679
MLS# CROC26052674Listed by: BERKSHIRE HATHAWAY HOMESERVICE - Open Sat, 12 to 3pmNew
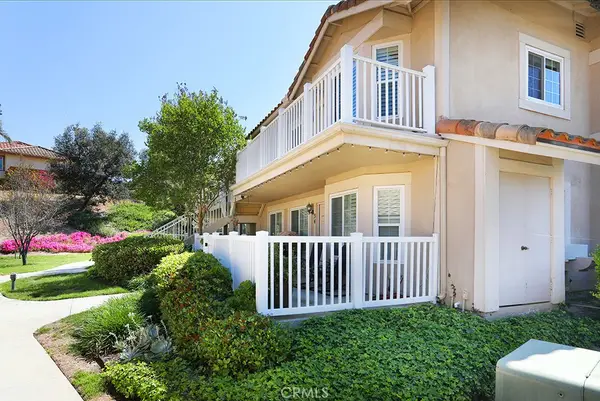 $574,999Active2 beds 2 baths816 sq. ft.
19801 Meadow Ridge #38, Trabuco Canyon, CA 92679
MLS# OC26052674Listed by: BERKSHIRE HATHAWAY HOMESERVICE - New
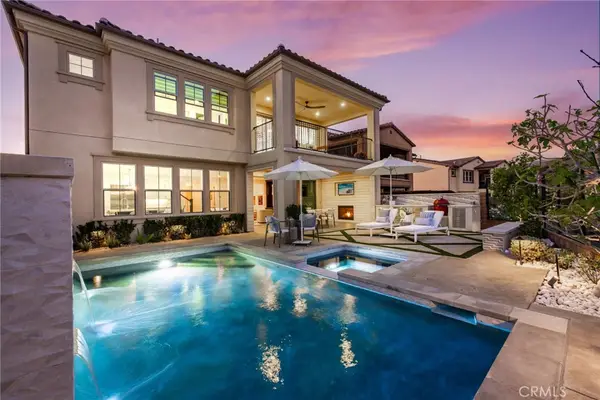
 $2,398,000Active4 beds 4 baths3,301 sq. ft.
33 Cielo Azul, Mission Viejo, CA 92692
MLS# OC26052743Listed by: ASPERO REALTY, INC - New
 $2,398,000Active4 beds 4 baths3,301 sq. ft.
33 Cielo Azul, Mission Viejo, CA 92692
MLS# OC26052743Listed by: ASPERO REALTY, INC  $549,000Active2 beds 2 baths831 sq. ft.
19801 Meadow Ridge #25, Trabuco Canyon, CA 92679
MLS# OC26051408Listed by: COLDWELL BANKER REALTY $1,249,000Pending3 beds 3 baths1,624 sq. ft.
24 Chisholm Trail, Trabuco Canyon, CA 92679
MLS# 260005929Listed by: REAL BROKER $1,325,000Active3 beds 3 baths1,624 sq. ft.
10 Moccasin Trail, Trabuco Canyon, CA 92679
MLS# OC26047059Listed by: REALTY SOURCE, INC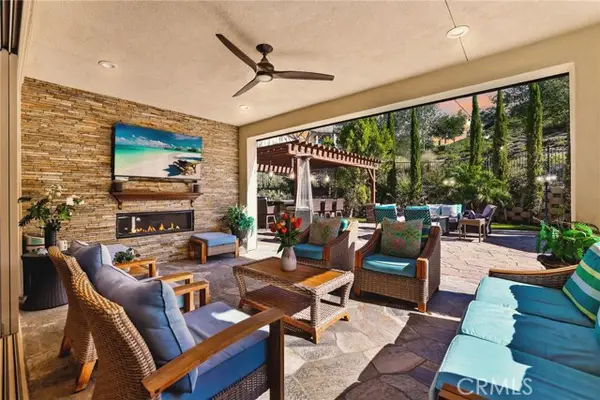 $2,345,000Active5 beds 4 baths3,284 sq. ft.
11 Cielo Arroyo, Mission Viejo, CA 92692
MLS# CROC26025934Listed by: ASPERO REALTY, INC
Local realty services provided by:CENTURY 21 Wildwood Properties, Inc., CENTURY 21 Jordan-Link, CENTURY 21 Affiliated
The information being provided by California Regional MLS (Southern California) is for the consumer's personal, non-commercial use and may not be used for any purpose other than to identify prospective properties consumer may be interested in purchasing. Any information relating to real estate for sale referenced on this web site comes from the Internet Data Exchange (IDX) program of the California Regional MLS (Southern California). CENTURY 21 Jordan-Link is not a Multiple Listing Service (MLS), nor does it offer MLS access. This website is a service of CENTURY 21 Jordan-Link, a broker participant of California Regional MLS (Southern California). This web site may reference real estate listing(s) held by a brokerage firm other than the broker and/or agent who owns this web site.
The accuracy of all information, regardless of source, including but not limited to open house information, square footages and lot sizes, is deemed reliable but not guaranteed and should be personally verified through personal inspection by and/or with the appropriate professionals. The data contained herein is copyrighted by California Regional MLS (Southern California) and is protected by all applicable copyright laws. Any unauthorized dissemination of this information is in violation of copyright laws and is strictly prohibited.
Copyright 2021 California Regional MLS (Southern California). All rights reserved.
This information is deemed reliable but not guaranteed. You should rely on this information only to decide whether or not to further investigate a particular property. BEFORE MAKING ANY OTHER DECISION, YOU SHOULD PERSONALLY INVESTIGATE THE FACTS (e.g. square footage and lot size) with the assistance of an appropriate professional. You may use this information only to identify properties you may be interested in investigating further. All uses except for personal, non-commercial use in accordance with the foregoing purpose are prohibited. Redistribution or copying of this information, any photographs or video tours is strictly prohibited. This information is derived from the Internet Data Exchange (IDX) service provided by San Diego MLS®. Displayed property listings may be held by a brokerage firm other than the broker and/or agent responsible for this display. The information and any photographs and video tours and the compilation from which they are derived is protected by copyright. Compilation © 2020 San Diego MLS®, Inc.
Popular neighborhoods near Hidden Ridge, Trabuco Canyon, CA
Zip codes near Hidden Ridge, Trabuco Canyon, CA
- 92602 homes for sale
- 92603 homes for sale
- 92604 homes for sale
- 92610 homes for sale
- 92618 homes for sale
- 92620 homes for sale
- 92630 homes for sale
- 92637 homes for sale
- 92653 homes for sale
- 92656 homes for sale
- 92676 homes for sale
- 92677 homes for sale
- 92679 homes for sale
- 92688 homes for sale
- 92691 homes for sale
- 92692 homes for sale
- 92694 homes for sale
- 92782 homes for sale
- 92882 homes for sale
- 92883 homes for sale
Counties near Hidden Ridge, Trabuco Canyon, CA
Protect your home and budget from life's surprises with an Assurant Home Warranty, backed by a partner that supports you through every step of homeownership. Explore Plans.
©2026 Century 21 Real Estate LLC. All rights reserved. CENTURY 21®, the CENTURY 21 Logo and C21® are service marks owned by Century 21 Real Estate LLC. Century 21 Real Estate LLC fully supports the principles of the Fair Housing Act and the Equal Opportunity Act. Each office is independently owned and operated. Listing information is deemed reliable but not guaranteed accurate.