- Cambridge Country, Mundelein homes for sale
- Conway Farms, Lake Forest homes for sale
- Deerfield Park, Deerfield homes for sale
- Edgebrook, Chicago homes for sale
- Edison Park, Chicago homes for sale
- Grennan Heights, Niles homes for sale
- Ivy Hill, Arlington Heights homes for sale
- Kenilworth, Kenilworth homes for sale
- Laudymont Terrace, Arlington Heights homes for sale
- Lyon Acres, Waukegan homes for sale
- Norwood Park West, Chicago homes for sale
- Rivershire, Lincolnshire homes for sale
- The Crossings, Buffalo Grove homes for sale
- The Woodlands at Fiore, Buffalo Grove homes for sale
- Village of Lake Bluff, Lake Bluff homes for sale
- Washburn Park, North Chicago homes for sale
- Waukegan Highlands, North Chicago homes for sale
- White Oak Estates, Long Grove homes for sale
- Wildwood, Chicago homes for sale
- Winston Park Northwest, Palatine homes for sale
Highland Park, IL - homes for sale
6 of 6 results displayed
- New
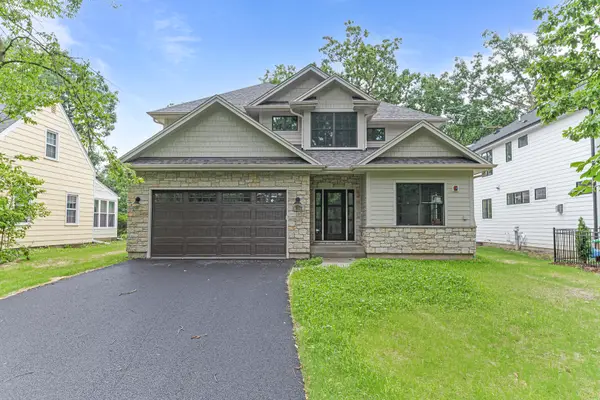 $1,350,000Active4 beds 4 baths3,216 sq. ft.
1672 Huntington Lane, Highland Park, IL 60035
MLS# 12604030Listed by: CIRCLE ONE REALTY
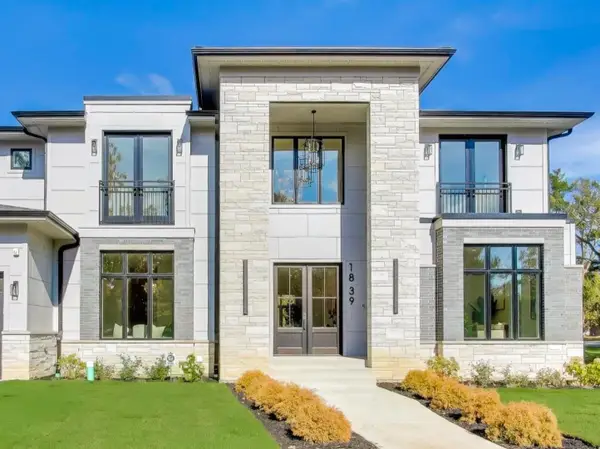 $2,199,000Active6 beds 7 baths4,289 sq. ft.
1839 Shelley Court, Highland Park, IL 60035
MLS# 12586561Listed by: @PROPERTIES CHRISTIE'S INTERNATIONAL REAL ESTATE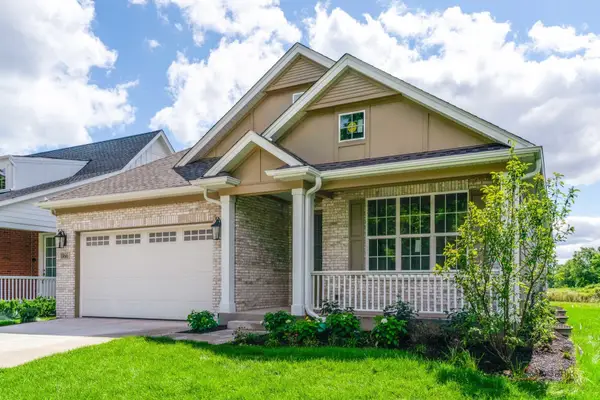 $1,199,900Active3 beds 4 baths3,350 sq. ft.
1066 Livingston (lot 2) Avenue, Highland Park, IL 60035
MLS# 12538211Listed by: MC NAUGHTON REALTY GROUP $1,199,900Pending3 beds 4 baths3,350 sq. ft.
1068 Livingston (lot 1) Avenue, Highland Park, IL 60035
MLS# 12301049Listed by: MC NAUGHTON REALTY GROUP $1,199,900Active3 beds 4 baths3,400 sq. ft.
2522 Hidden Oak (lot 7) Circle, Highland Park, IL 60035
MLS# 12262003Listed by: MC NAUGHTON REALTY GROUP $2,840,000Pending3 beds 4 baths4,105 sq. ft.
650 Walnut Street #301, Highland Park, IL 60035
MLS# 12089216Listed by: DIPLOMAT REALTY, INC.
Local realty services provided by:CENTURY 21 New Beginnings
Copyright 2026 Midwest Real Estate Data LLC. All rights reserved. The data relating to real estate for sale on this web site comes in part from the Broker Reciprocity Program of the Midwest Real Estate Data LLC. Listing information is deemed reliable but not guaranteed.
Neighborhoods near Highland Park, IL
Zip codes near Highland Park, IL
- 60004 homes for sale
- 60015 homes for sale
- 60022 homes for sale
- 60025 homes for sale
- 60026 homes for sale
- 60035 homes for sale
- 60040 homes for sale
- 60043 homes for sale
- 60044 homes for sale
- 60045 homes for sale
- 60048 homes for sale
- 60061 homes for sale
- 60062 homes for sale
- 60064 homes for sale
- 60069 homes for sale
- 60070 homes for sale
- 60089 homes for sale
- 60090 homes for sale
- 60091 homes for sale
- 60093 homes for sale
Popular searches near Highland Park, IL
- Bannockburn homes for sale
- Deerfield homes for sale
- Glencoe homes for sale
- Glenview homes for sale
- Highwood homes for sale
- Lake Bluff homes for sale
- Lake Forest homes for sale
- Lincolnshire homes for sale
- Mettawa homes for sale
- Moraine homes for sale
- New Trier homes for sale
- Northbrook homes for sale
- Northfield township homes for sale
- Northfield homes for sale
- Riverwoods homes for sale
- Shields homes for sale
- Vernon homes for sale
- West Deerfield homes for sale
- Wheeling homes for sale
- Winnetka homes for sale
Protect your home and budget from life's surprises with an Assurant Home Warranty, backed by a partner that supports you through every step of homeownership. Explore Plans.
©2026 Century 21 Real Estate LLC. All rights reserved. CENTURY 21®, the CENTURY 21 Logo and C21® are service marks owned by Century 21 Real Estate LLC. Century 21 Real Estate LLC fully supports the principles of the Fair Housing Act and the Equal Opportunity Act. Each office is independently owned and operated. Listing information is deemed reliable but not guaranteed accurate.