- Beachmont, New Rochelle homes for sale
- Chester Heights, Mount Vernon homes for sale
- Downtown Mount Vernon, Mount Vernon homes for sale
- Downtown New Rochelle, New Rochelle homes for sale
- Eastchester Road, New Rochelle homes for sale
- Fleetwood, Mount Vernon homes for sale
- Franklin Avenue, New Rochelle homes for sale
- Glenwood Lake, New Rochelle homes for sale
- Homestead Park, New Rochelle homes for sale
- Homewood Park, New Rochelle homes for sale
- Huguenot Park, New Rochelle homes for sale
- Mount Vernon Heights, Mount Vernon homes for sale
- Palmer Avenue, New Rochelle homes for sale
- Residence Park, New Rochelle homes for sale
- Rochelle Park - Rochelle Heights Historic District, New Rochelle homes for sale
- Shore Road, New Rochelle homes for sale
- Sunnyside Park, Bronxville homes for sale
- Wykagyl Business District, New Rochelle homes for sale
- Wykagyl Crossways, New Rochelle homes for sale
- Wykagyl Park, New Rochelle homes for sale
Highland Park, New Rochelle, NY - homes for sale
3 of 3 results displayed
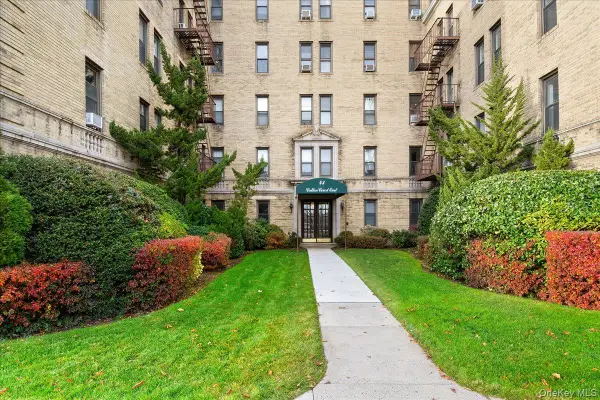 $469,000Active2 beds 2 baths1,520 sq. ft.
43 Calton Road #4A, New Rochelle, NY 10804
MLS# 964204Listed by: KELLER WILLIAMS REALTY GROUP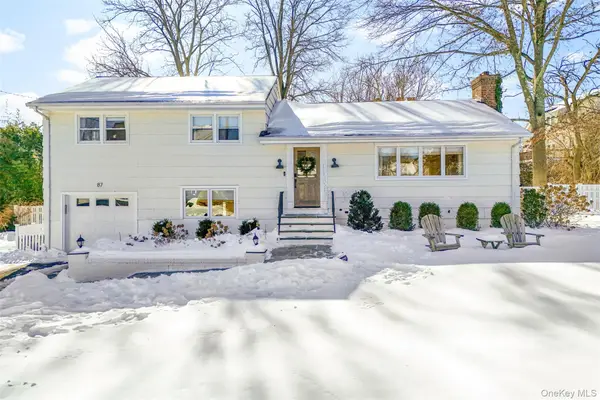 $1,015,000Pending3 beds 3 baths1,716 sq. ft.
87 Inverness Road, New Rochelle, NY 10804
MLS# 958838Listed by: HOULIHAN LAWRENCE INC.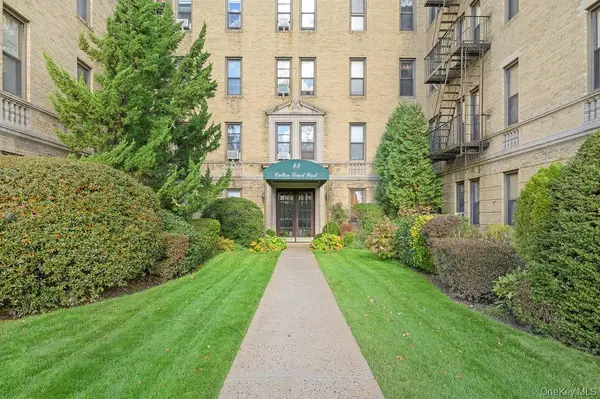 $649,000Active3 beds 2 baths1,888 sq. ft.
43 Calton Road #5C, New Rochelle, NY 10804
MLS# 930803Listed by: WILLIAM RAVEIS REAL ESTATE
Local realty services provided by:CENTURY 21 Monticello Realty
Popular neighborhoods near Highland Park, New Rochelle, NY
Zip codes near Highland Park, New Rochelle, NY
- 10466 homes for sale
- 10470 homes for sale
- 10475 homes for sale
- 10538 homes for sale
- 10543 homes for sale
- 10550 homes for sale
- 10552 homes for sale
- 10553 homes for sale
- 10583 homes for sale
- 10701 homes for sale
- 10703 homes for sale
- 10704 homes for sale
- 10707 homes for sale
- 10708 homes for sale
- 10709 homes for sale
- 10710 homes for sale
- 10801 homes for sale
- 10803 homes for sale
- 10804 homes for sale
- 10805 homes for sale
Protect your home and budget from life's surprises with an Assurant Home Warranty, backed by a partner that supports you through every step of homeownership. Explore Plans.
©2026 Century 21 Real Estate LLC. All rights reserved. CENTURY 21®, the CENTURY 21 Logo and C21® are service marks owned by Century 21 Real Estate LLC. Century 21 Real Estate LLC fully supports the principles of the Fair Housing Act and the Equal Opportunity Act. Each office is independently owned and operated. Listing information is deemed reliable but not guaranteed accurate.