- Cahuenga Terrace, Los Angeles homes for sale
- Center City, Los Angeles homes for sale
- Central Hollywood, Los Angeles homes for sale
- Crescent Heights, Los Angeles homes for sale
- Downtown Hollywood, Los Angeles homes for sale
- Eastside West Hollywood, Los Angeles homes for sale
- Hollywood, Los Angeles homes for sale
- Hollywood Dell, Los Angeles homes for sale
- Hollywood Heights, Los Angeles homes for sale
- McNair Place, Los Angeles homes for sale
- Melrose, Los Angeles homes for sale
- Mount Olympus, Los Angeles homes for sale
- Nichols Canyon, Los Angeles homes for sale
- Outpost Estates, Los Angeles homes for sale
- SoFo, Los Angeles homes for sale
- Spaulding Square, Los Angeles homes for sale
- Sunset Square, Los Angeles homes for sale
- Theater Row, Los Angeles homes for sale
- Whitley Heights, Los Angeles homes for sale
- Yucca Corridor, Los Angeles homes for sale
Hollywood and Highland, Los Angeles, CA - homes for sale
35 of 35 results displayed
- New
 $379,888Active1 beds 1 baths513 sq. ft.
1735 N Fuller #425, Los Angeles, CA 90046
MLS# SR26061279Listed by: CENTURY 21 MASTERS - New
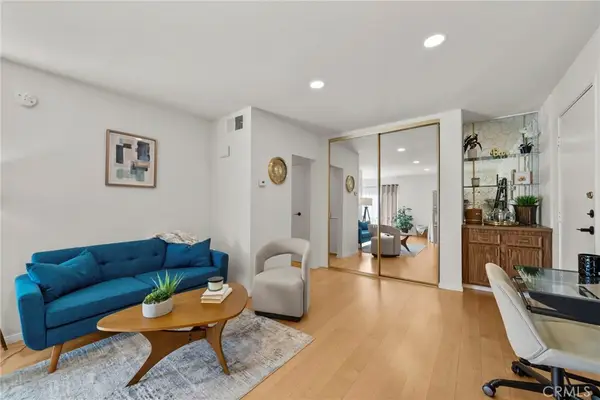
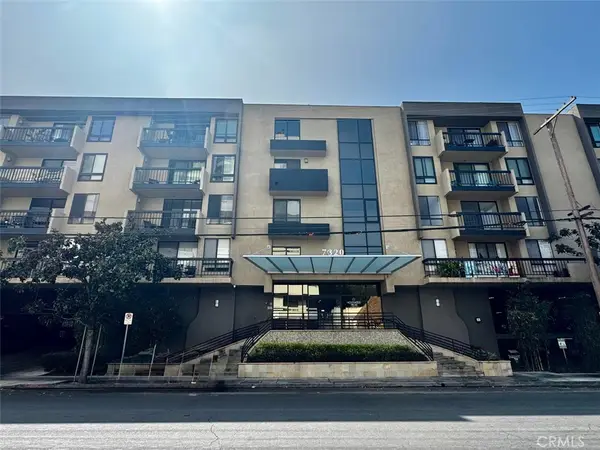 $685,500Active2 beds 2 baths1,140 sq. ft.
7320 Hawthorn #106 Avenue #106, Los Angeles, CA 90046
MLS# BB26061478Listed by: AMR REAL ESTATE SERVICES 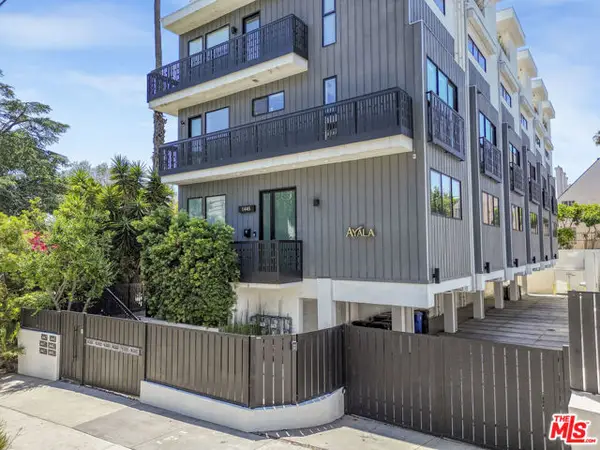 $1,149,000Active3 beds 3 baths1,568 sq. ft.
1445 N Martel Avenue, Los Angeles, CA 90046
MLS# CL26666833Listed by: FORWARD ONE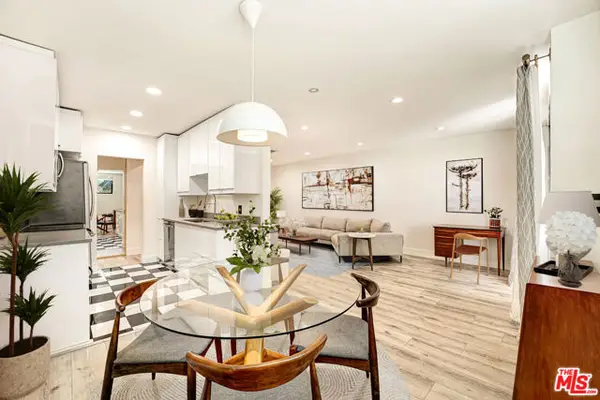 $513,000Active1 beds 1 baths831 sq. ft.
1750 Camino Palmero Street #236, Los Angeles, CA 90046
MLS# CL26665133Listed by: KELLER WILLIAMS REALTY LOS FELIZ $709,000Active2 beds 2 baths1,215 sq. ft.
1310 N Detroit Street #401, Los Angeles, CA 90046
MLS# CL26663689Listed by: COMPASS $5,495,000Active3 beds 4 baths3,580 sq. ft.
7135 Hollywood Boulevard #PHE, Los Angeles, CA 90046
MLS# CL26660689Listed by: THE OPPENHEIM GROUP, INC. $765,000Active2 beds 2 baths1,191 sq. ft.
7300 Franklin Avenue #548, Los Angeles, CA 90046
MLS# CL26663727Listed by: KW WESTSIDE ESTATES $789,000Active1 beds 2 baths998 sq. ft.
7250 Franklin Avenue #603, Los Angeles, CA 90046
MLS# CL26652203Listed by: CAROLWOOD ESTATES $424,500Active1 beds 1 baths807 sq. ft.
7300 Franklin Avenue #447, Los Angeles, CA 90046
MLS# CL26658255Listed by: RODEO REALTY $375,000Active1 beds 1 baths784 sq. ft.
1735 N Fuller Avenue #119, Los Angeles, CA 90046
MLS# 26657697Listed by: KW WESTSIDE ESTATES $364,999Active-- beds 1 baths513 sq. ft.
1735 N Fuller Ave #330, Los Angeles, CA 90046
MLS# CRCV26041078Listed by: RE/MAX MASTERS REALTY $699,500Active2 beds 2 baths1,100 sq. ft.
7320 Hawthorn Avenue #401, Los Angeles, CA 90046
MLS# CL26655751Listed by: CHRISTIE'S INTERNATIONAL REAL ESTATE SOCAL $579,000Active1 beds 1 baths831 sq. ft.
1735 N Fuller Avenue #445, Los Angeles, CA 90046
MLS# SR25263924Listed by: COMPASS $799,900Active3 beds 3 baths1,110 sq. ft.
1628 N Formosa Avenue #A, Los Angeles, CA 90046
MLS# CL26652791Listed by: COMPASS $340,000Active-- beds 1 baths449 sq. ft.
7250 Franklin #1106, Los Angeles, CA 90046
MLS# SR26035351Listed by: CENTURY 21 MASTERS $499,000Active1 beds 1 baths550 sq. ft.
7320 Hawthorn Avenue #315, Los Angeles, CA 90046
MLS# CL26651377Listed by: SOTHEBY'S INTERNATIONAL REALTY $674,500Active2 beds 2 baths1,129 sq. ft.
1745 Camino Palmero Street #104, Los Angeles, CA 90046
MLS# CL26648449Listed by: COMPASS $417,000Active1 beds 1 baths743 sq. ft.
1745 Camino Palmero #440, Los Angeles, CA 90046
MLS# PW26027571Listed by: COLDWELL BANKER REALTY $635,000Active2 beds 2 baths1,060 sq. ft.
7320 Hawthorn Avenue #207, Los Angeles, CA 90046
MLS# CL26644087Listed by: THE AGENCY $499,000Active1 beds 1 baths772 sq. ft.
1730 Camino Palmero #308, Los Angeles, CA 90046
MLS# SR26006369Listed by: RODEO REALTY $699,000Active2 beds 2 baths1,009 sq. ft.
7250 Franklin Avenue #1112, Los Angeles, CA 90046
MLS# CL26640695Listed by: COLDWELL BANKER REALTY $835,000Active2 beds 2 baths954 sq. ft.
7135 Hollywood Boulevard #405, Los Angeles, CA 90046
MLS# SR26016754Listed by: COLDWELL BANKER EXCLUSIVE- Open Sun, 2 to 5pm
 $850,000Active3 beds 3 baths1,470 sq. ft.
1353 N Fuller Avenue #PH7, Los Angeles, CA 90046
MLS# 26638309Listed by: RODEO REALTY  $689,000Active2 beds 2 baths1,087 sq. ft.
7135 Hollywood Boulevard #509, Los Angeles, CA 90046
MLS# CL26637159Listed by: DOUGLAS ELLIMAN OF CALIFORNIA, INC.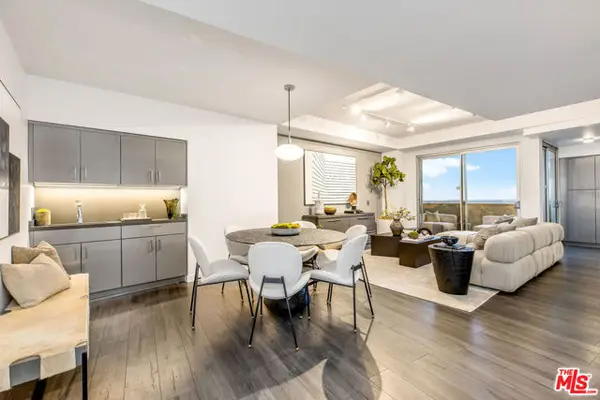 $1,150,000Active2 beds 2 baths1,507 sq. ft.
7250 Franklin Avenue #1204, Los Angeles, CA 90046
MLS# CL26632565Listed by: KELLER WILLIAMS BEVERLY HILLS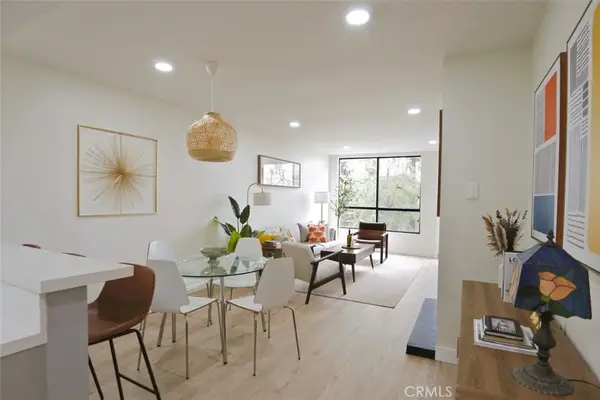 $529,000Active1 beds 1 baths743 sq. ft.
1745 Camino Palmero #537, Los Angeles, CA 90046
MLS# PW26000942Listed by: COLDWELL BANKER REALTY $480,000Active1 beds 1 baths772 sq. ft.
1750 Camino Palmero Street #442, Los Angeles, CA 90046
MLS# CL25631003Listed by: NOURMAND & ASSOCIATES-BH- Open Sat, 1 to 4pm
 $599,900Active2 beds 2 baths1,070 sq. ft.
7320 Hawthorn Avenue #108, Los Angeles, CA 90046
MLS# CV25277161Listed by: RE/MAX 2000 REALTY 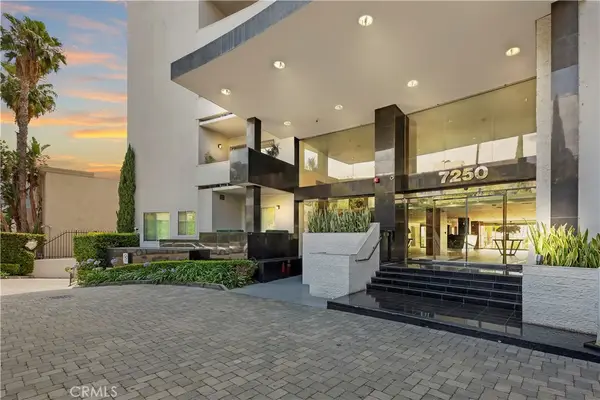 $340,000Active-- beds 1 baths492 sq. ft.
7250 Franklin Avenue #506, Los Angeles, CA 90046
MLS# CV25268521Listed by: BERKSHIRE HATH HM SVCS CA PROP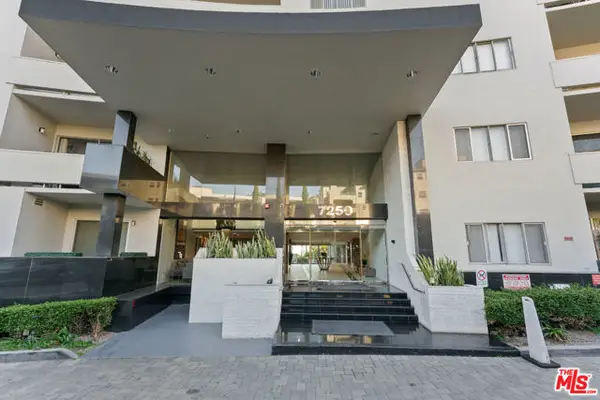 $729,000Active1 beds 2 baths996 sq. ft.
7250 Franklin Avenue #615, Los Angeles, CA 90046
MLS# CL26646865Listed by: RODEO REALTY $799,500Active2 beds 2 baths1,212 sq. ft.
7250 Franklin Avenue #616, Los Angeles, CA 90046
MLS# CL26660391Listed by: SOTHEBY'S INTERNATIONAL REALTY $599,000Active1 beds 1 baths981 sq. ft.
7250 Franklin Avenue #101, Los Angeles, CA 90046
MLS# CL26652335Listed by: COLDWELL BANKER REALTY $349,000Active-- beds 1 baths623 sq. ft.
1745 Camino Palmero Street #106, Los Angeles, CA 90046
MLS# CL25627495Listed by: KELLER WILLIAMS HOLLYWOOD HILLS $749,999Active2 beds 2 baths1,145 sq. ft.
1745 Camino Palmero Street #114, Los Angeles, CA 90046
MLS# CL23324097Listed by: YURI KATZ $499,000Active1 beds 1 baths784 sq. ft.
1750 Camino Palmero Street #237, Los Angeles, CA 90046
MLS# CL26639017Listed by: KELLER WILLIAMS REALTY LOS FELIZ
Local realty services provided by:CENTURY 21 Masters, CENTURY 21 Wildwood Properties, Inc.
The information being provided by California Regional MLS (Southern California) is for the consumer's personal, non-commercial use and may not be used for any purpose other than to identify prospective properties consumer may be interested in purchasing. Any information relating to real estate for sale referenced on this web site comes from the Internet Data Exchange (IDX) program of the California Regional MLS (Southern California). CENTURY 21 Masters is not a Multiple Listing Service (MLS), nor does it offer MLS access. This website is a service of CENTURY 21 Masters, a broker participant of California Regional MLS (Southern California). This web site may reference real estate listing(s) held by a brokerage firm other than the broker and/or agent who owns this web site.
The accuracy of all information, regardless of source, including but not limited to open house information, square footages and lot sizes, is deemed reliable but not guaranteed and should be personally verified through personal inspection by and/or with the appropriate professionals. The data contained herein is copyrighted by California Regional MLS (Southern California) and is protected by all applicable copyright laws. Any unauthorized dissemination of this information is in violation of copyright laws and is strictly prohibited.
Copyright 2021 California Regional MLS (Southern California). All rights reserved.
Popular neighborhoods near Hollywood and Highland, Los Angeles, CA
Zip codes near Hollywood and Highland, Los Angeles, CA
- 90004 homes for sale
- 90005 homes for sale
- 90010 homes for sale
- 90019 homes for sale
- 90020 homes for sale
- 90027 homes for sale
- 90028 homes for sale
- 90029 homes for sale
- 90035 homes for sale
- 90036 homes for sale
- 90038 homes for sale
- 90046 homes for sale
- 90048 homes for sale
- 90068 homes for sale
- 90069 homes for sale
- 90210 homes for sale
- 90211 homes for sale
- 90212 homes for sale
- 91602 homes for sale
- 91604 homes for sale
Counties near Hollywood and Highland, Los Angeles, CA
Protect your home and budget from life's surprises with an Assurant Home Warranty, backed by a partner that supports you through every step of homeownership. Explore Plans.
©2026 Century 21 Real Estate LLC. All rights reserved. CENTURY 21®, the CENTURY 21 Logo and C21® are service marks owned by Century 21 Real Estate LLC. Century 21 Real Estate LLC fully supports the principles of the Fair Housing Act and the Equal Opportunity Act. Each office is independently owned and operated. Listing information is deemed reliable but not guaranteed accurate.