- Avoca, Pittston homes for sale
- Bellevue, Scranton homes for sale
- Bull's Head, Scranton homes for sale
- Dupont, Pittston homes for sale
- Duryea, Duryea homes for sale
- East Mountain, Scranton homes for sale
- Green Ridge, Scranton homes for sale
- Hill Section, Scranton homes for sale
- Hughestown, Pittston homes for sale
- Hyde Park, Scranton homes for sale
- Keyser Valley, Scranton homes for sale
- Lower Green Ridge, Scranton homes for sale
- Minooka, Scranton homes for sale
- Pine Brook, Scranton homes for sale
- Providence, Scranton homes for sale
- South Side, Scranton homes for sale
- The Flats, Scranton homes for sale
- The Plot, Scranton homes for sale
- Tripp's Park, Scranton homes for sale
- West Side, Scranton homes for sale
Honesdale, PA - homes for sale
25 of 25 results displayed
- New
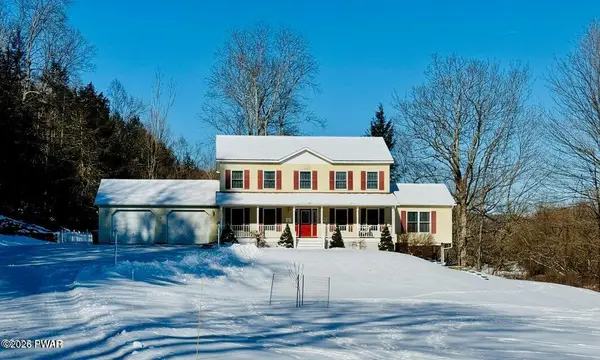 $735,000Active3 beds 4 baths3,842 sq. ft.
1869 Parkway Drive, Honesdale, PA 18431
MLS# PW260472Listed by: RE/MAX WAYNE  $329,000Pending3 beds 2 baths1,498 sq. ft.
304 16th Street, Honesdale, PA 18431
MLS# PW260428Listed by: RE/MAX WAYNE $225,000Active3 beds 2 baths1,784 sq. ft.
1106 Court Street, Honesdale, PA 18431
MLS# PW260376Listed by: RE/MAX WAYNE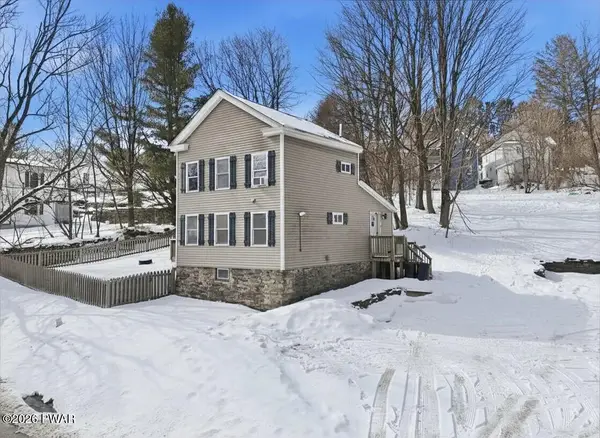 $210,000Active2 beds 2 baths883 sq. ft.
220 Terrace Street, Honesdale, PA 18431
MLS# PW260358Listed by: IRON VALLEY R E INNOVATE $299,000Active6 beds 2 baths1,974 sq. ft.
260 Terrace Street, Honesdale, PA 18431
MLS# PW260328Listed by: SIX PM LLC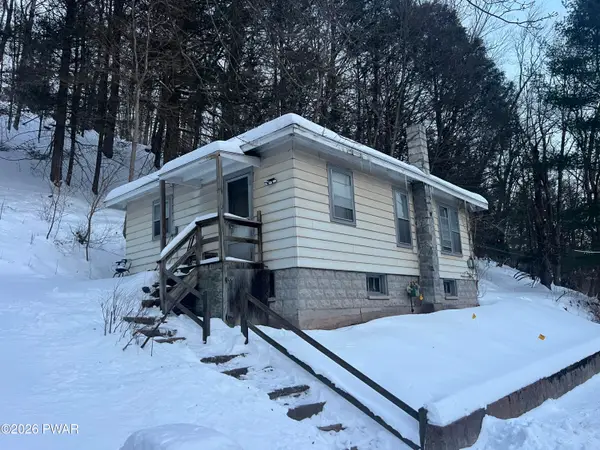 $125,000Active2 beds 1 baths660 sq. ft.
40 Watts Hill Road, Honesdale, PA 18431
MLS# PW260282Listed by: RE/MAX WAYNE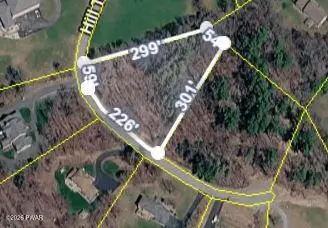 $59,000Active0 Acres
Address Withheld By Seller, Honesdale, PA 18431
MLS# PW260253Listed by: RE/MAX WAYNE $285,000Active3 beds 2 baths1,453 sq. ft.
1517 West Street, Honesdale, PA 18431
MLS# PW260250Listed by: CENTURY 21 SELECT GROUP - LAKE ARIEL $79,000Pending4 beds 2 baths1,728 sq. ft.
500 Church Street, Honesdale, PA 18431
MLS# SC260477Listed by: ERA ONE SOURCE REALTY $339,000Pending3 beds 2 baths1,951 sq. ft.
12 Stourbridge Lane, Honesdale, PA 18431
MLS# PW260224Listed by: LAKE HOMES REALTY, LLC $375,000Active4 beds 2 baths2,361 sq. ft.
107 Willow Avenue, Honesdale, PA 18431
MLS# PW260157Listed by: KELLER WILLIAMS RE HAWLEY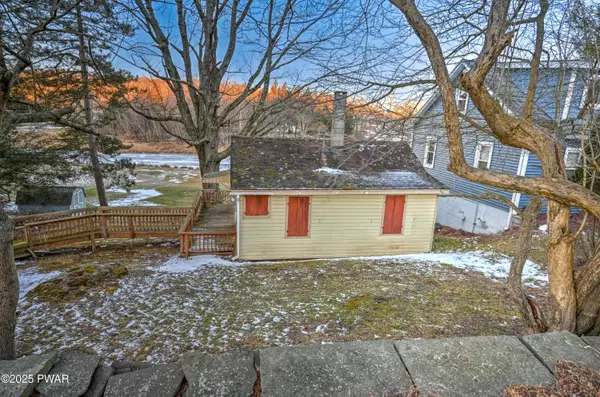 $125,000Pending1 beds 1 baths441 sq. ft.
99 Lakeside Drive, Honesdale, PA 18431
MLS# PW254035Listed by: IRON VALLEY R E INNOVATE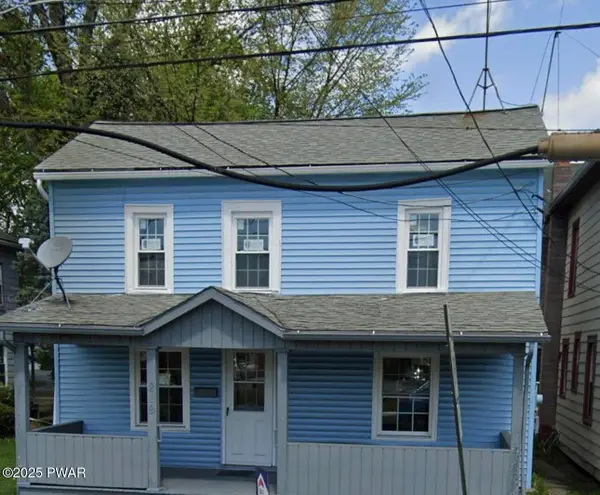
 $169,500Active3 beds 1 baths1,530 sq. ft.
219 4th Street, Honesdale, PA 18431
MLS# PW254027Listed by: CENTURY 21 COUNTRY LAKE HOMES - LORDS VALLEY $79,000Active3 beds 1 baths920 sq. ft.
215 Vine Street, Honesdale, PA 18431
MLS# PW253435Listed by: RE/MAX WAYNE $250,000Active-- beds 2 baths2,700 sq. ft.
1797-1799 N Main Street, Honesdale, PA 18431
MLS# PM-136307Listed by: GLOBAL PROPERTIES NEPA $309,500Active3 beds 3 baths2,316 sq. ft.
225 Willow Avenue, Honesdale, PA 18431
MLS# PW253263Listed by: RE/MAX WAYNE $165,000Pending3 beds 2 baths1,800 sq. ft.
119 Linwood Street, Honesdale, PA 18431
MLS# PW253229Listed by: RE/MAX WAYNE $119,000Active2 beds 1 baths750 sq. ft.
276 Erie Street, Honesdale, PA 18431
MLS# PW253118Listed by: DAVIS R. CHANT - MILFORD $255,000Active3 beds 2 baths1,449 sq. ft.
1223 Dyberry Place, Honesdale, PA 18431
MLS# PW252527Listed by: RE/MAX WAYNE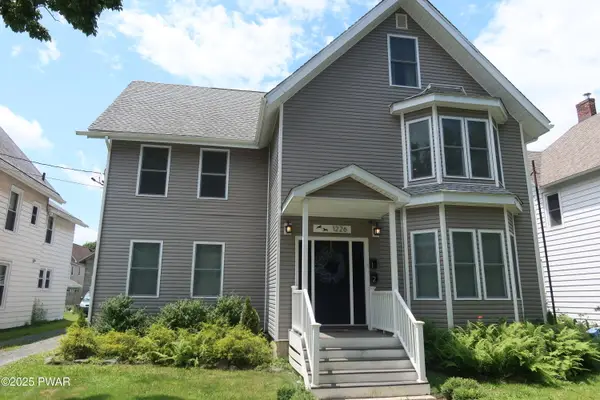 $490,000Active6 beds 3 baths2,946 sq. ft.
1226 Dyberry Place, Honesdale, PA 18431
MLS# PW252103Listed by: KELLER WILLIAMS RE HAWLEY $180,000Pending4 beds 2 baths1,725 sq. ft.
236 Vine Street, Honesdale, PA 18431
MLS# PW250315Listed by: CENTURY 21 COUNTRY LAKE HOMES - LORDS VALLEY $40,000Pending0 Acres
Vine Street, Honesdale, PA 18431
MLS# PW250316Listed by: CENTURY 21 COUNTRY LAKE HOMES - LORDS VALLEY $109,000Active0 Acres
Hancock Highway, Honesdale, PA 18431
MLS# PW232439Listed by: RE/MAX WAYNE $300,000Active4 beds 2 baths1,729 sq. ft.
341 Broad Street, Honesdale, PA 18431
MLS# PW232633Listed by: DAVIS R. CHANT - LORDS VALLEY $70,000Pending-- beds -- baths888 sq. ft.
360 Cliff Street, Honesdale, PA 18431
MLS# PW233205Listed by: RE/MAX WAYNE
Local realty services provided by:CENTURY 21 Select Group, CENTURY 21 Jack Ruddy Real Estate, CENTURY 21 Keim Realtors
Neighborhoods near Honesdale, PA
Zip codes near Honesdale, PA
- 12764 homes for sale
- 12792 homes for sale
- 18403 homes for sale
- 18405 homes for sale
- 18407 homes for sale
- 18415 homes for sale
- 18417 homes for sale
- 18421 homes for sale
- 18425 homes for sale
- 18428 homes for sale
- 18431 homes for sale
- 18435 homes for sale
- 18436 homes for sale
- 18438 homes for sale
- 18453 homes for sale
- 18456 homes for sale
- 18463 homes for sale
- 18464 homes for sale
- 18469 homes for sale
- 18472 homes for sale
Popular searches near Honesdale, PA
- Beach Lake homes for sale
- Berlin homes for sale
- Cherry Ridge homes for sale
- Clinton homes for sale
- Damascus homes for sale
- Fawn Lake Forest homes for sale
- Hawley homes for sale
- Lackawaxen homes for sale
- Lake homes for sale
- Lakeville homes for sale
- Lebanon homes for sale
- Narrowsburg homes for sale
- Palmyra homes for sale
- Paupack homes for sale
- Prompton homes for sale
- South Canaan homes for sale
- Texas homes for sale
- The Hideout homes for sale
- Waymart homes for sale
- White Mills homes for sale
Protect your home and budget from life's surprises with an Assurant Home Warranty, backed by a partner that supports you through every step of homeownership. Explore Plans.
©2026 Century 21 Real Estate LLC. All rights reserved. CENTURY 21®, the CENTURY 21 Logo and C21® are service marks owned by Century 21 Real Estate LLC. Century 21 Real Estate LLC fully supports the principles of the Fair Housing Act and the Equal Opportunity Act. Each office is independently owned and operated. Listing information is deemed reliable but not guaranteed accurate.